Chapter 11: Population Growth and Regulation (MODIFIED)
1/65
There's no tags or description
Looks like no tags are added yet.
Name | Mastery | Learn | Test | Matching | Spaced |
|---|
No study sessions yet.
66 Terms
Formula for population Size Change
N(t+1)= N(t)+B-D+I-E
N(t+1)= Pop size at end of time t
N(t)= Pop size at beginning of time t
B= Births
D=deaths
I=immigration
E=emmigration
4 factors that cause population size change
birth
death
immigration
emmigration
What is the significance of populations growing by multiplication
Allows for unchecked population growth at a constant rate that would rapidly climb toward infinity
Population increase in proportion to its size (like how saving account earns interest on principal)
With constant 10% annual rate of increase
A pop of 100 would add 10 individuals per year
A pop of 1000 would add 100 individuals per year
A pop of 10 billion would add 1 billion individuals per year
What allows for two different unlimited population growth models to even exists?
Differences in life histories among organisms
Two models are exponential and geometric
When does geometric growth occur?
When a population with synchronous reproduction changes by a constant proportion from one discrete time period to the next
When does exponential growth occur?
When a population with continuous reproduction changes in size by a constant proportion at each instant in time
Geometric Growth in a single time period equation
N(t+1)= N(t) x λ
N(t+1)= Number individuals at end of time period
N(t)= Number of individuals at beginning of time period
λ= Geometric growth rate (multiple by which population grows in each time period)
Geometric Growth rate in Multiple time periods formula
N(t)= N(0) x λᵗ
N(t)= # individuals after t units
N(0)= # individuals at time 0
λ= Geometric growth rate
ᵗ= # Time periods 9yrs, hours, day, etc)
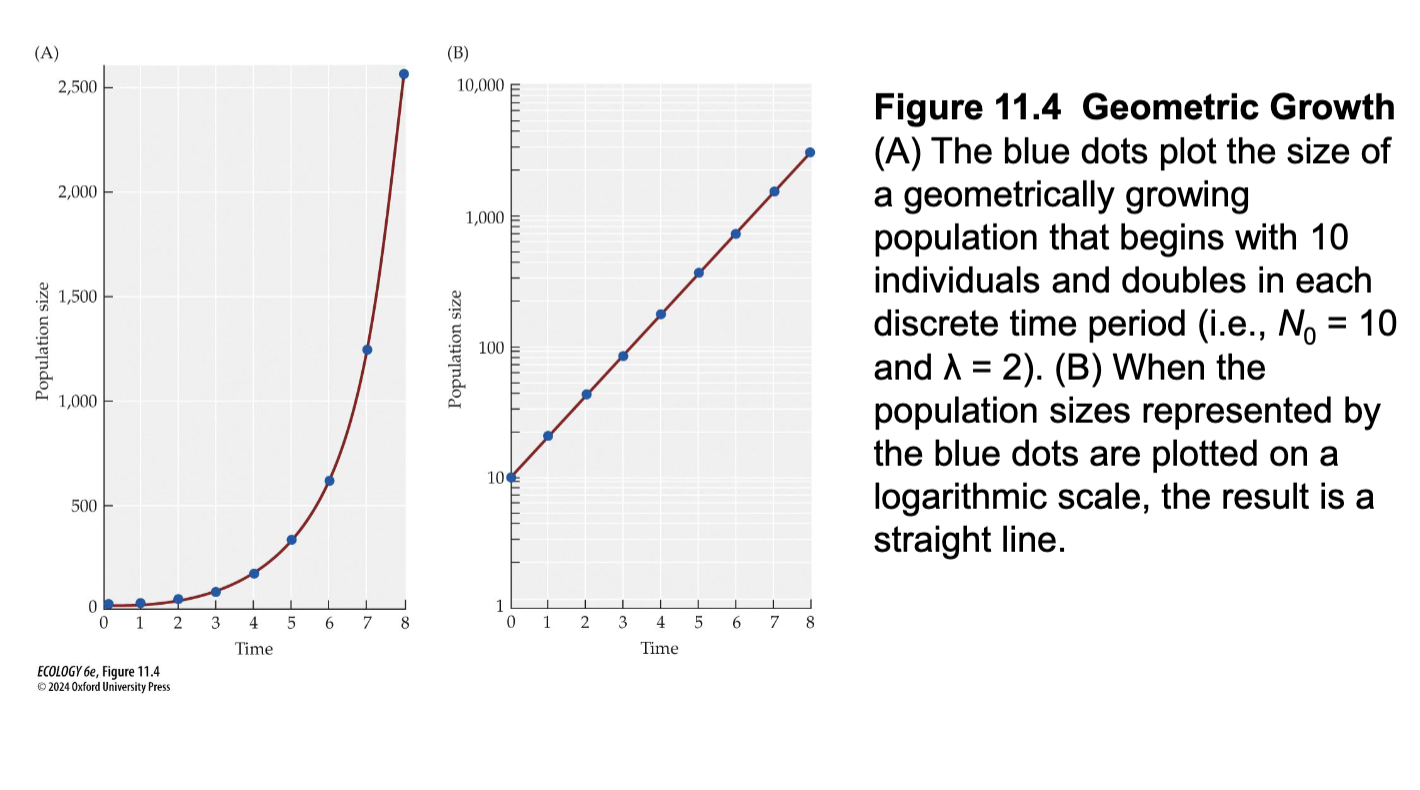
Figure 11.4- Geometric growth
Graph a
Geometric growth begins with 10 individuals and doubles each time period
this mans N(0)= 10 and λ= 2
Graph b
Plotted on log scale resulting in straight line
Exponential Growth rate formula
N(t)= N(0) x eʳᵗ
N(t)= # Individuals after t units
N(0)= # individuals at time 0
ʳ= exponential growth rate per unit time (intrinsic growth rate)
ᵗ= # time units
Exponential example:
N0 = 100 (starting population size at time=0)
e = 2.72
r = 0.15 (15% exponential growth rate per year)
t = 10 (we want to know pop. size 10 years in future)
Nt = N0e rt
N10 = 100 x(2.72 (0.15*10)) = 448
Exponential Example
What is the rate of increase in population size given by?
Derivative of the exponential growth equation
Rate of increase in population size formula
(dN/dt)= rN
(dN/dt)= instantaneous rate of inc/dec in pop size per unit time
r= exponential growth rate (expresses pop increase on a per capita/ per individual basis
N= population zie
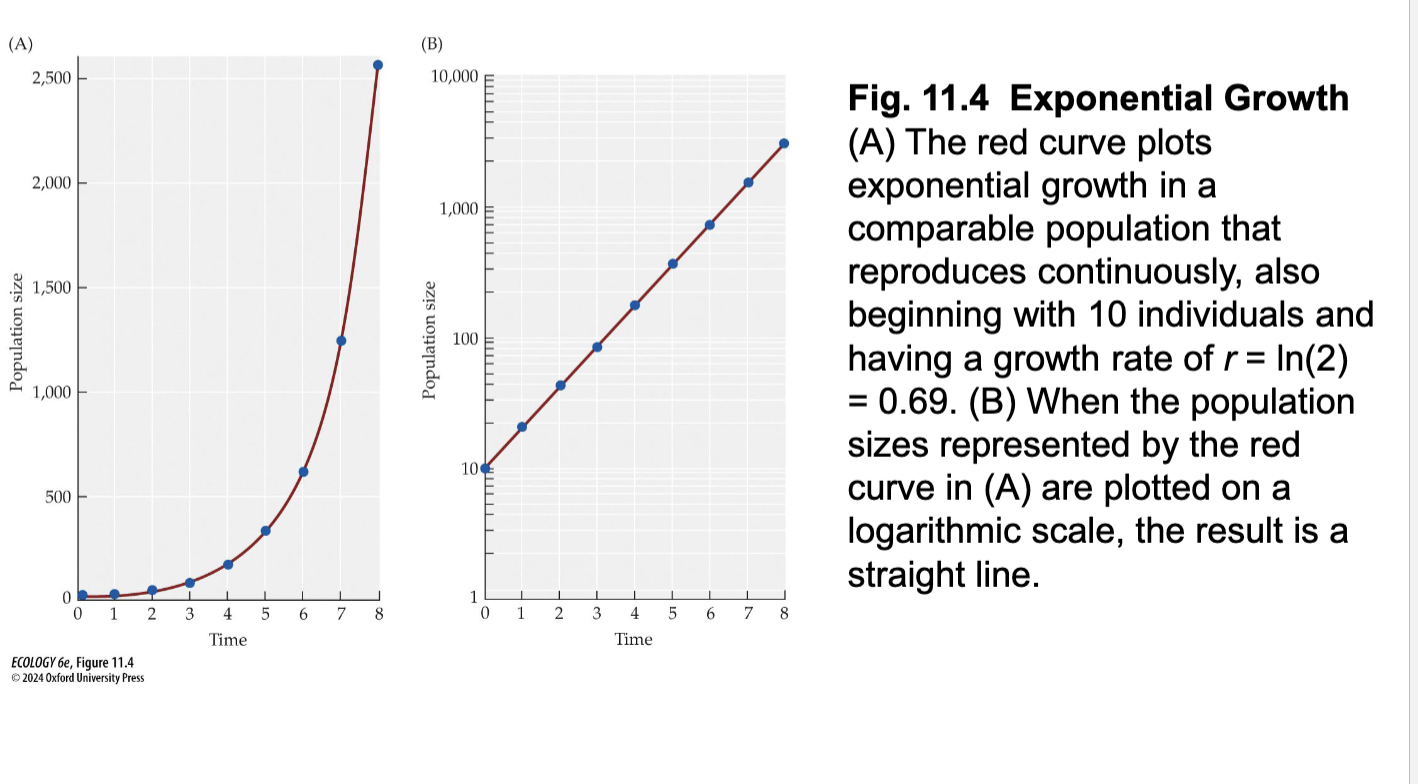
Figure 11.3- Exponential growth
Figure a
Exponential growth reproduces continuously, also beginning with 10 individuals
growth rate of r=ln (2)= 0.69
Figure b
Log scale results in straight line
Exponential and geometric patterns of growth when overlap occurs equation
λ = eʳ
e=2.72
ʳ= exponential growth rate
λ= geometric growth rate
Per capita exponential growth rate equation
r= b-d
r= exponential growth rate
b= avg per capita birth
d= avg per capita deaths
If b>d, then r is …
positive
If b<d then r is …
negative
Per capita rates are only meaningful at which level?
At the population level
(When b=0.5, that doesnt mean each individual is actually having half an offspring per year)
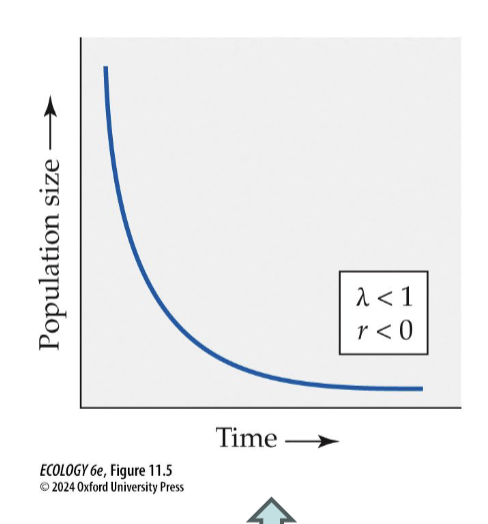
Growth Graph and pop size when λ<1 and r<0
Continuously decelerating curve of decrease
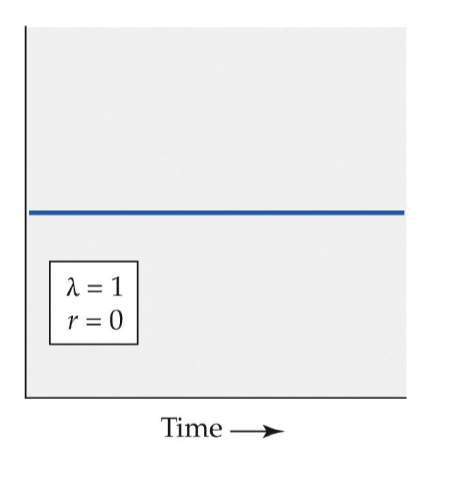
Growth Graph and pop size when λ=1 and r=0
No change, straight line
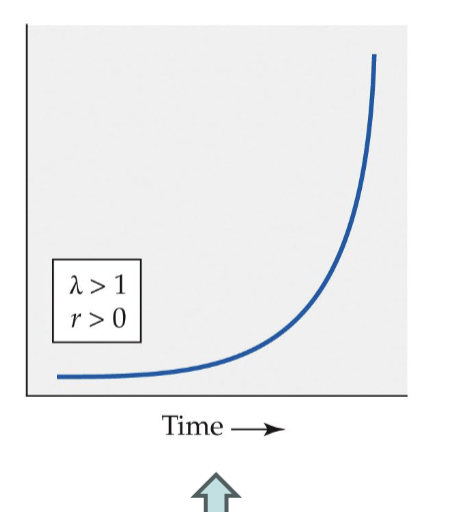
Growth Graph and population size λ>1 and r>0
Continuously accelerating graph of increase
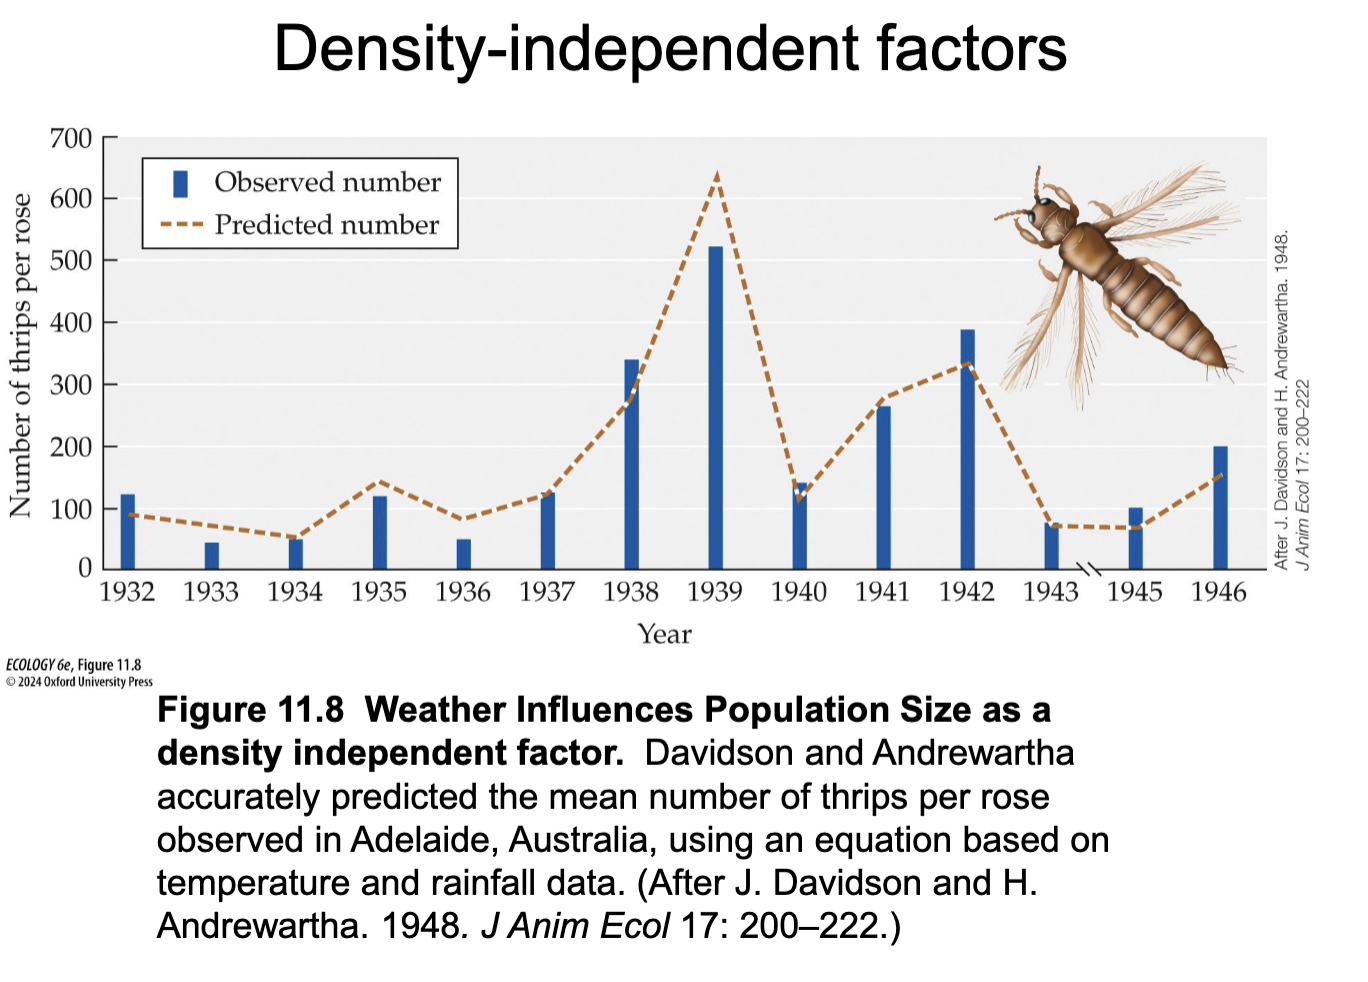
Density independent factors
Affect population size per capita growth rate independent of population density
Play a major role in determining changes in population size
Examples of density independent factors
Abiotic factors such as:
Weather
Climate
Natural disasters
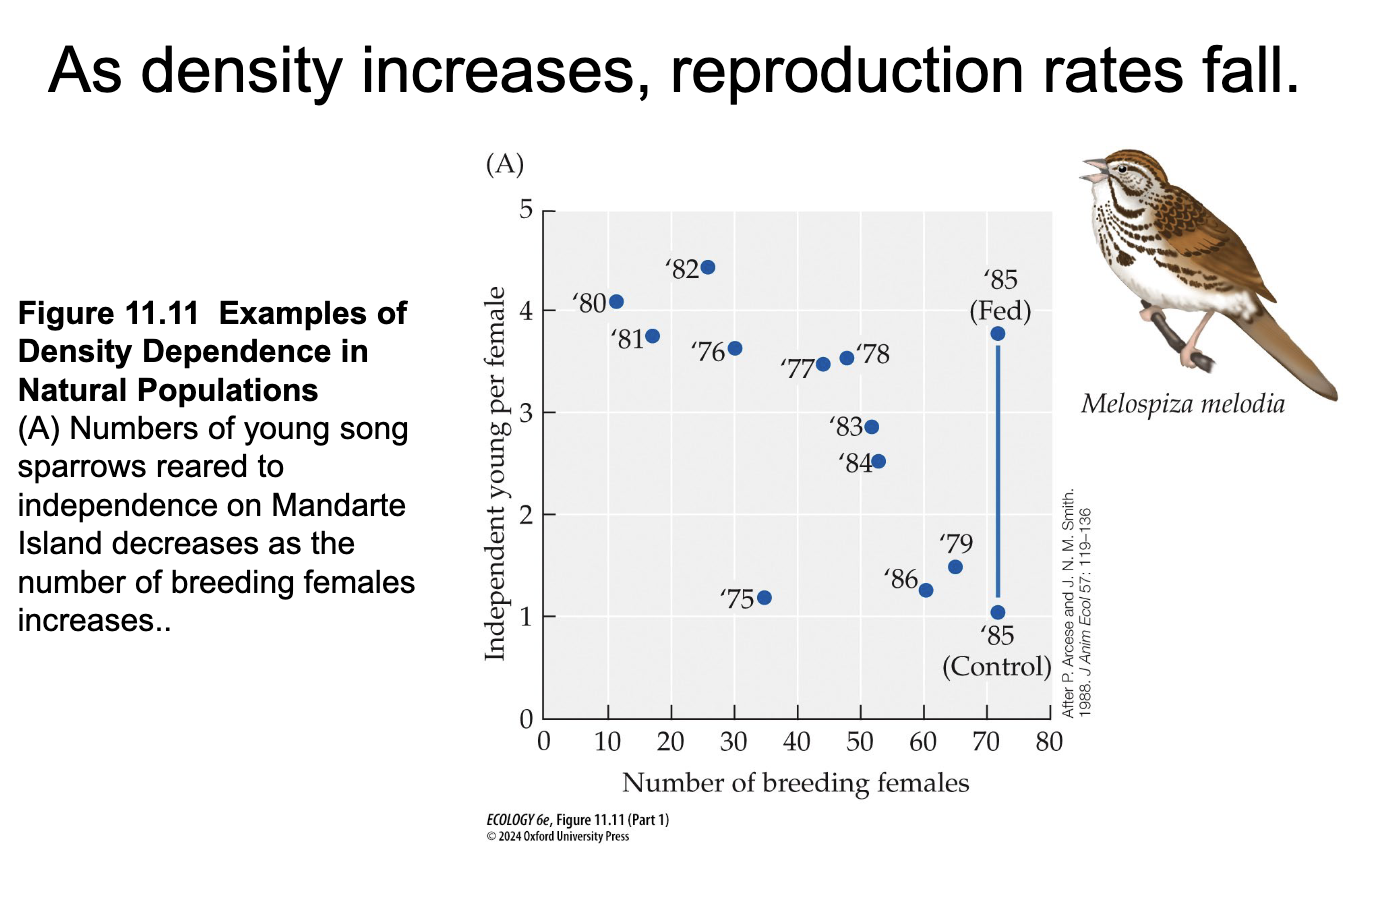
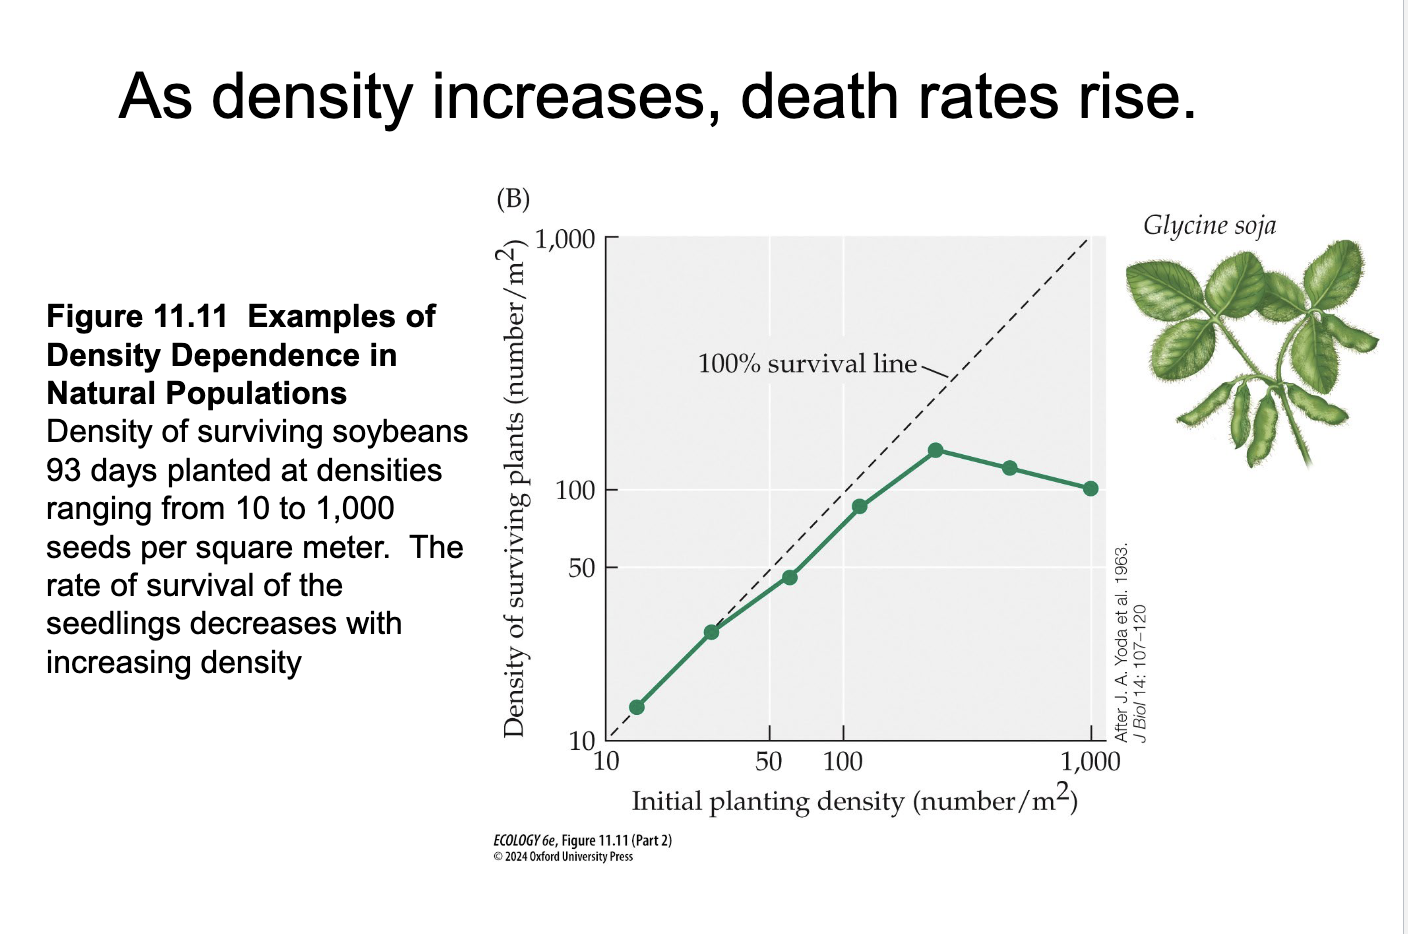
Density- dependent factors
Affect population size and growth as a consequence of population density
When a population size becomes large enough, a lack of food, habitat, or other resources causes birth rates to dec and death rates to inc, dispersal to inc
Example of density- dependent factors
Food availability, predation rates, parasite infection loads
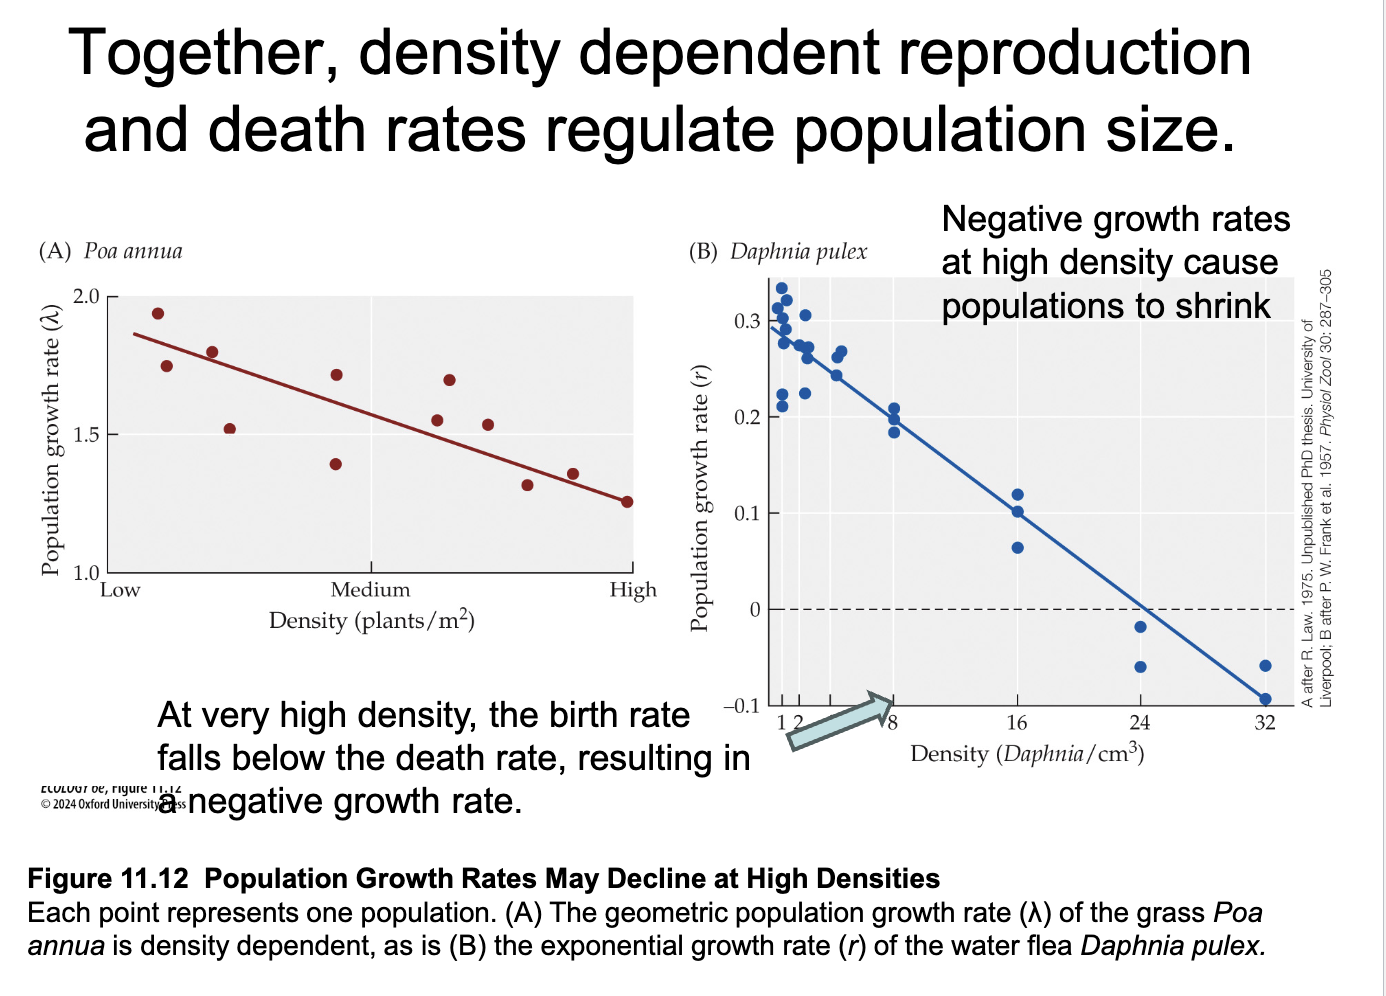
How do density dependent reproduction and death rates regulate population size?
Causes negative growth rates at high densities because populations shrink
At very high densities the birth rate falls below death rate, causing a negative growth rate
Why are there limits to exponential and geometric population growth
Because all resources eventually become limiting exponential and geometric growth never continue indefinitely
When do Populations experience geometric and exponential growth?
when environmental resource are unlimiting (superabundant )
Not realisitic
Pearl and Reed proposition states:
The exponential rate of growth should be variable and decrease with increasing population size due to density- dependent birth and mortality rates
Pearl and Reed proposition formula/ logistic (since includes density-dependent portion)
r= r(0) x (1- N/K)
r= realized exponential growth rate (a density dependent variable that decreases as N increases)
r(0)= maximum exponential growth rate (constant value assuming population size=0 and resources are unlimiting)
N= actual pop size (varies across time)
K= carrying capacity (max N supportable indefinitely by the resources in the environment, constant value)
Exponential Growth formula vs Logistic growth Formula
Exponential Growth formula
(dN/dt)= rN
Logistic growth formula
(dN/dt)= r(0)N x ( K-N/(K) )
r(0)= max exponential growth rate
N= actual pop size
K= carrying capacity
What type of growth does a small population that exhibits logistic equation show?
Sigmoidal growth
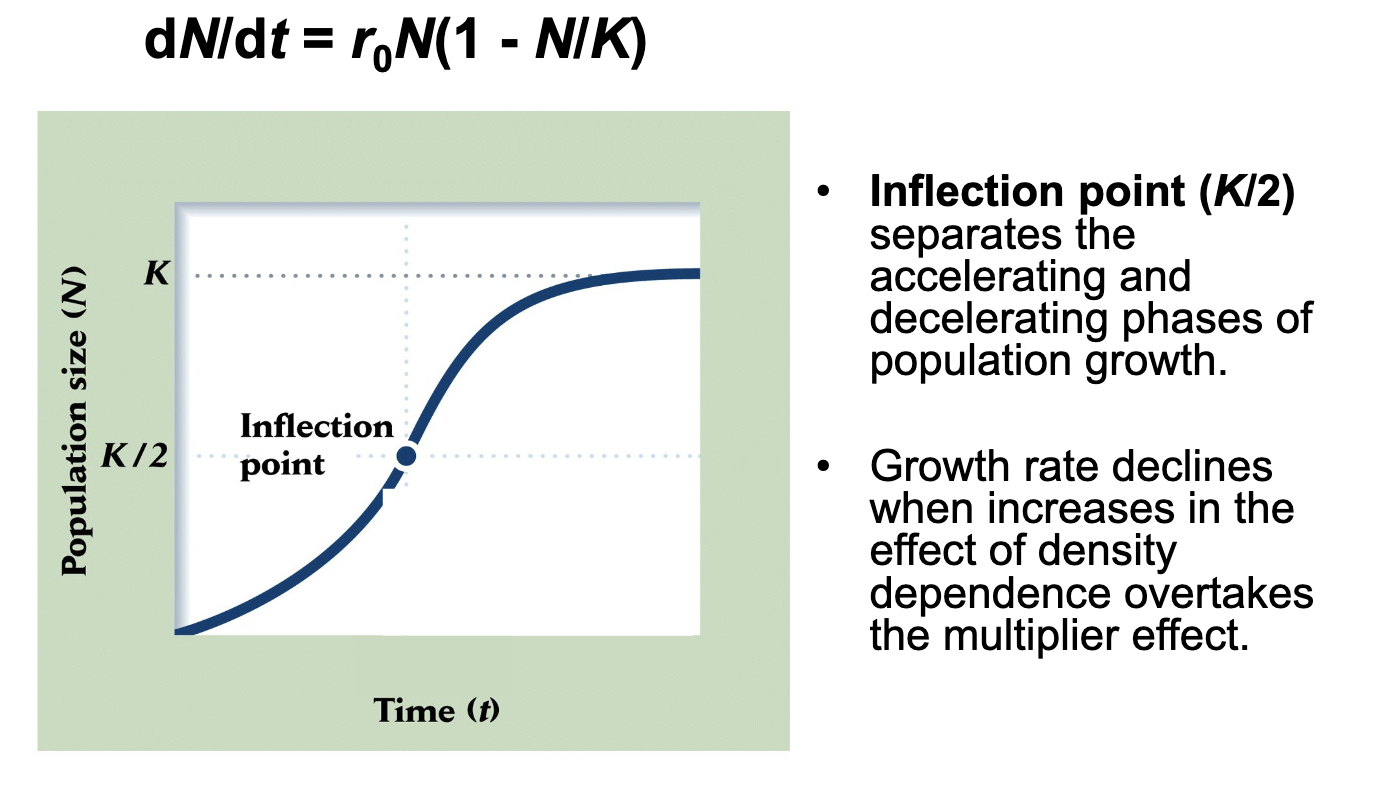
What is inflection point (K/2)
Separates the accelerating and decelerating phases of population growth
Growth rate declines when increases in the effect of density-dependence takes over the multiplier effect
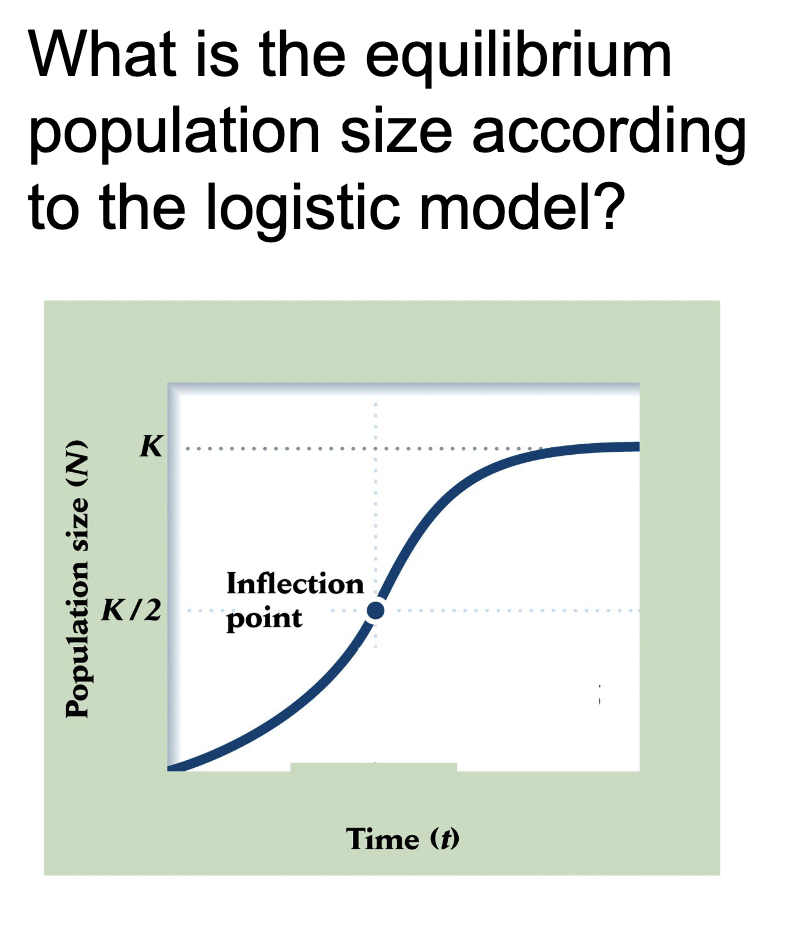
What is the equilibrium Population Size according to the logistic model?
As N approaches K, the multiplies (1-N/K) approaches 0
If N overshoots K, the multiplier (1-N/K) is negative (pop decreases)
This means population size always converges on equilibrium capacity (K)
3 outcomes of Population below/constant/above K
Pops below K grow
Pops above K dec
Pops at K remain constant
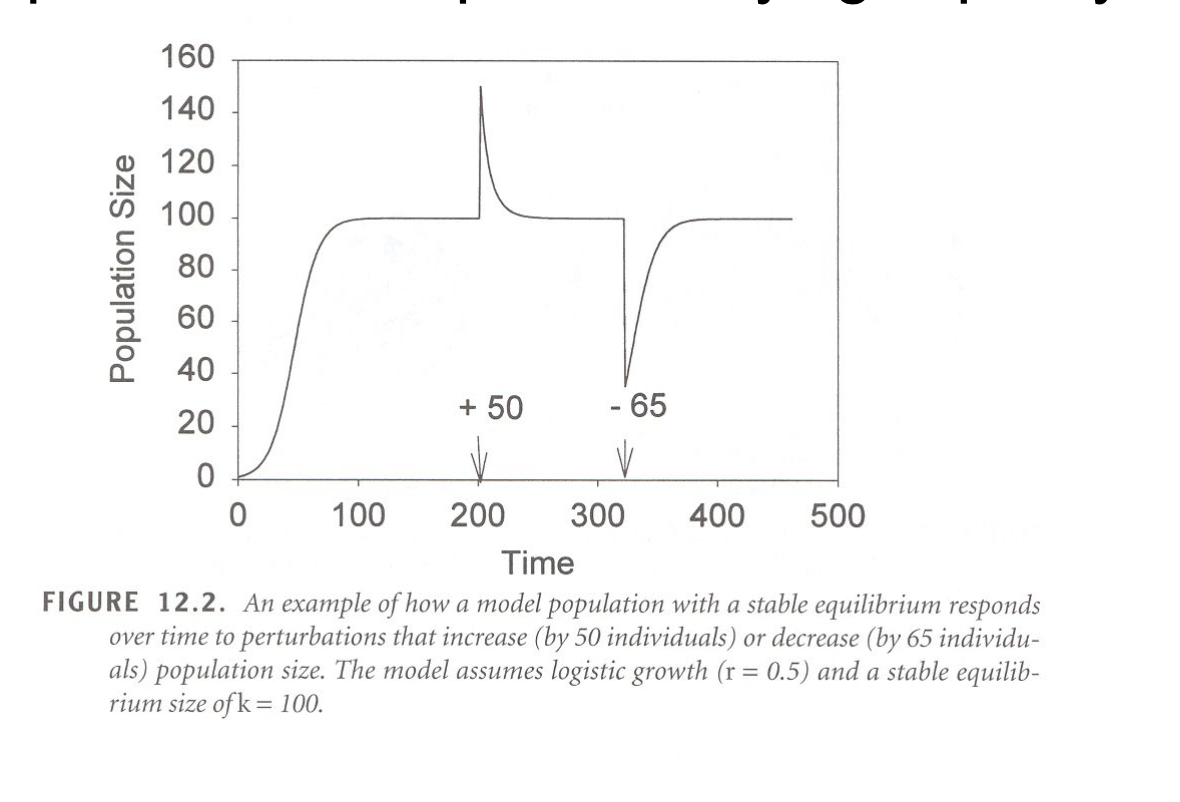
What does logistic growth result in?
An equilibrium pop size equal to carrying capacity
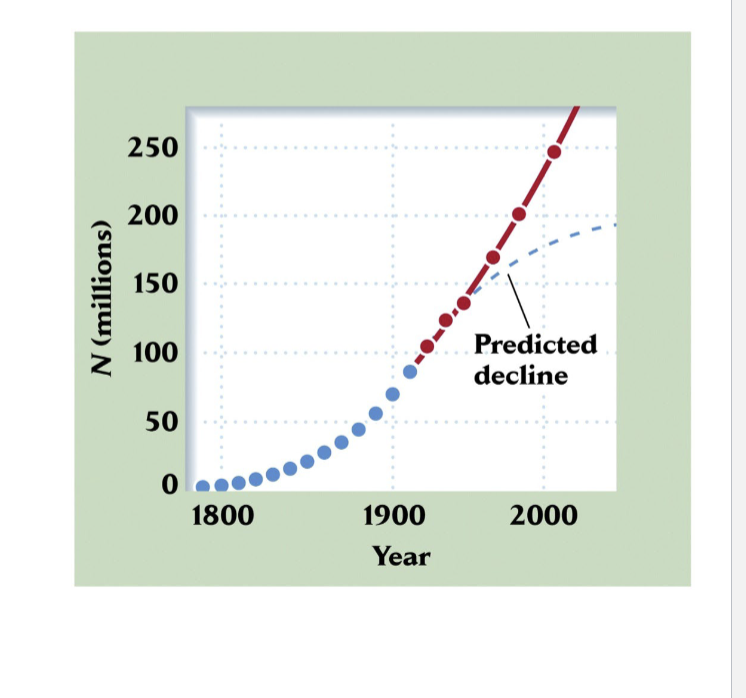
Pearl and Reed population projection
Human pop stabilized at K of 97,273,000
U.S Pop reached this level between 1960 and 1970 and has continued growing ever since
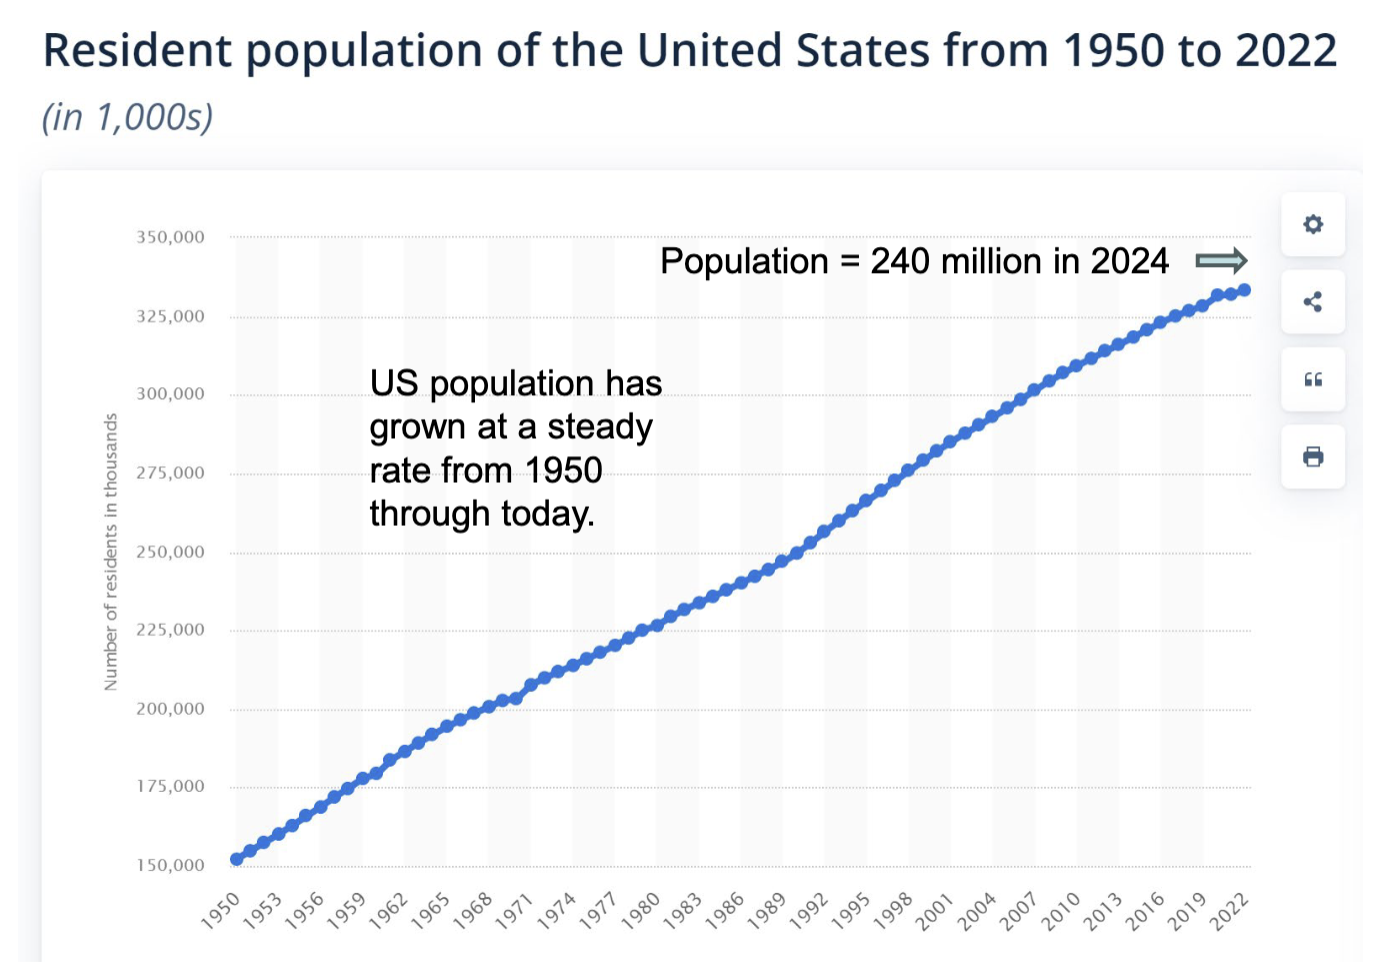
U.S. Population rowth rate from 1950
Steady growth
Population 2024= 240 million
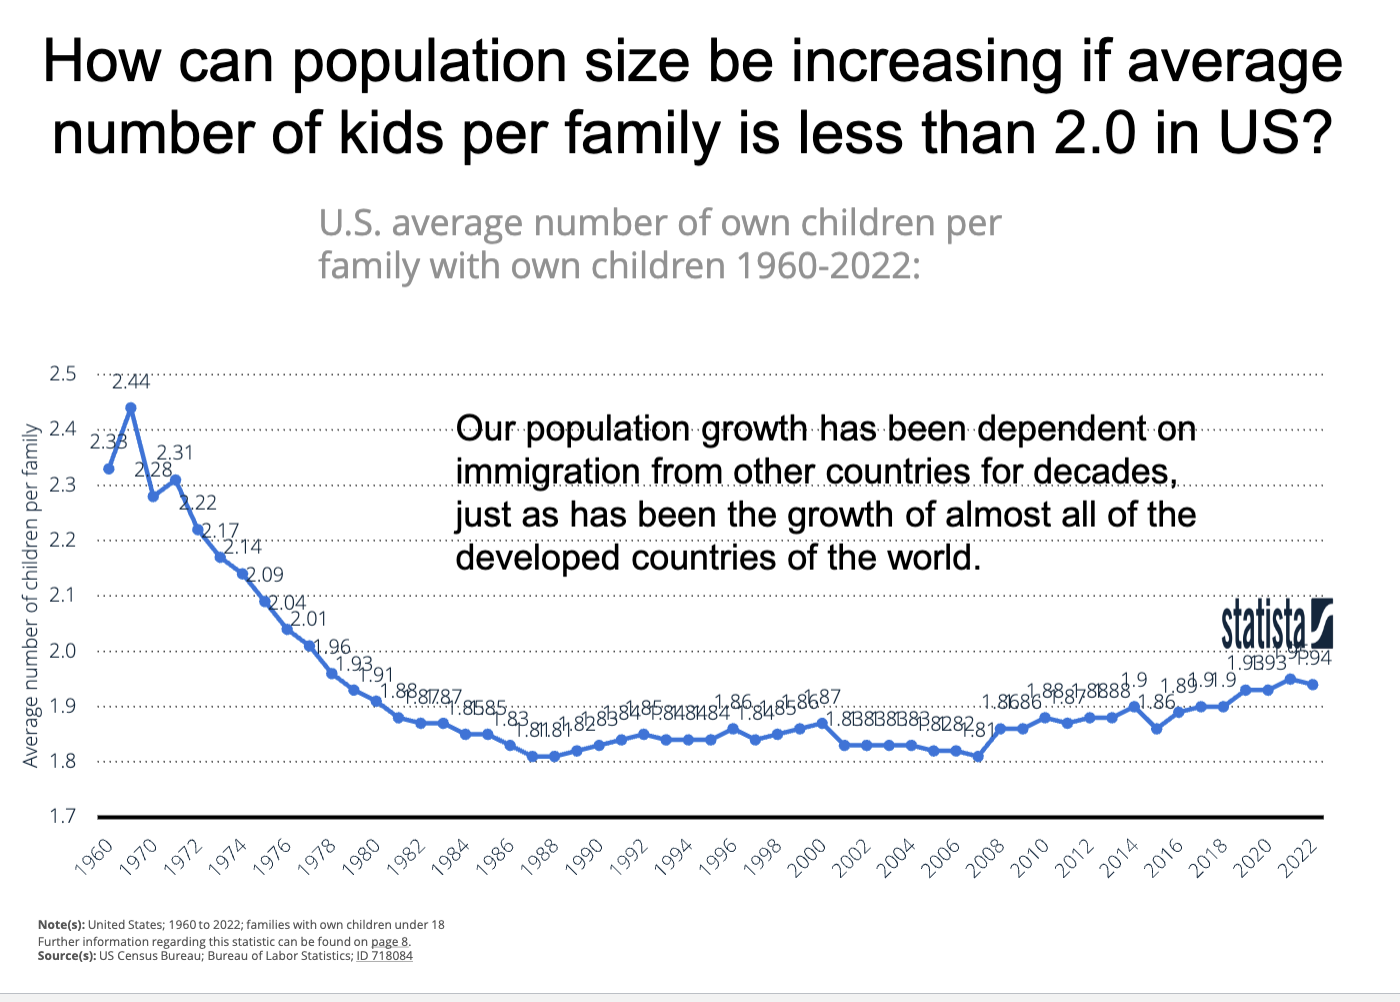
How can population size be increasing if average number of kids per family is less than 2.0 in U.S ?
Our population growth has been dependent on immigration from other countries for decades just as has been the growth of almost all of the developed countries of the world
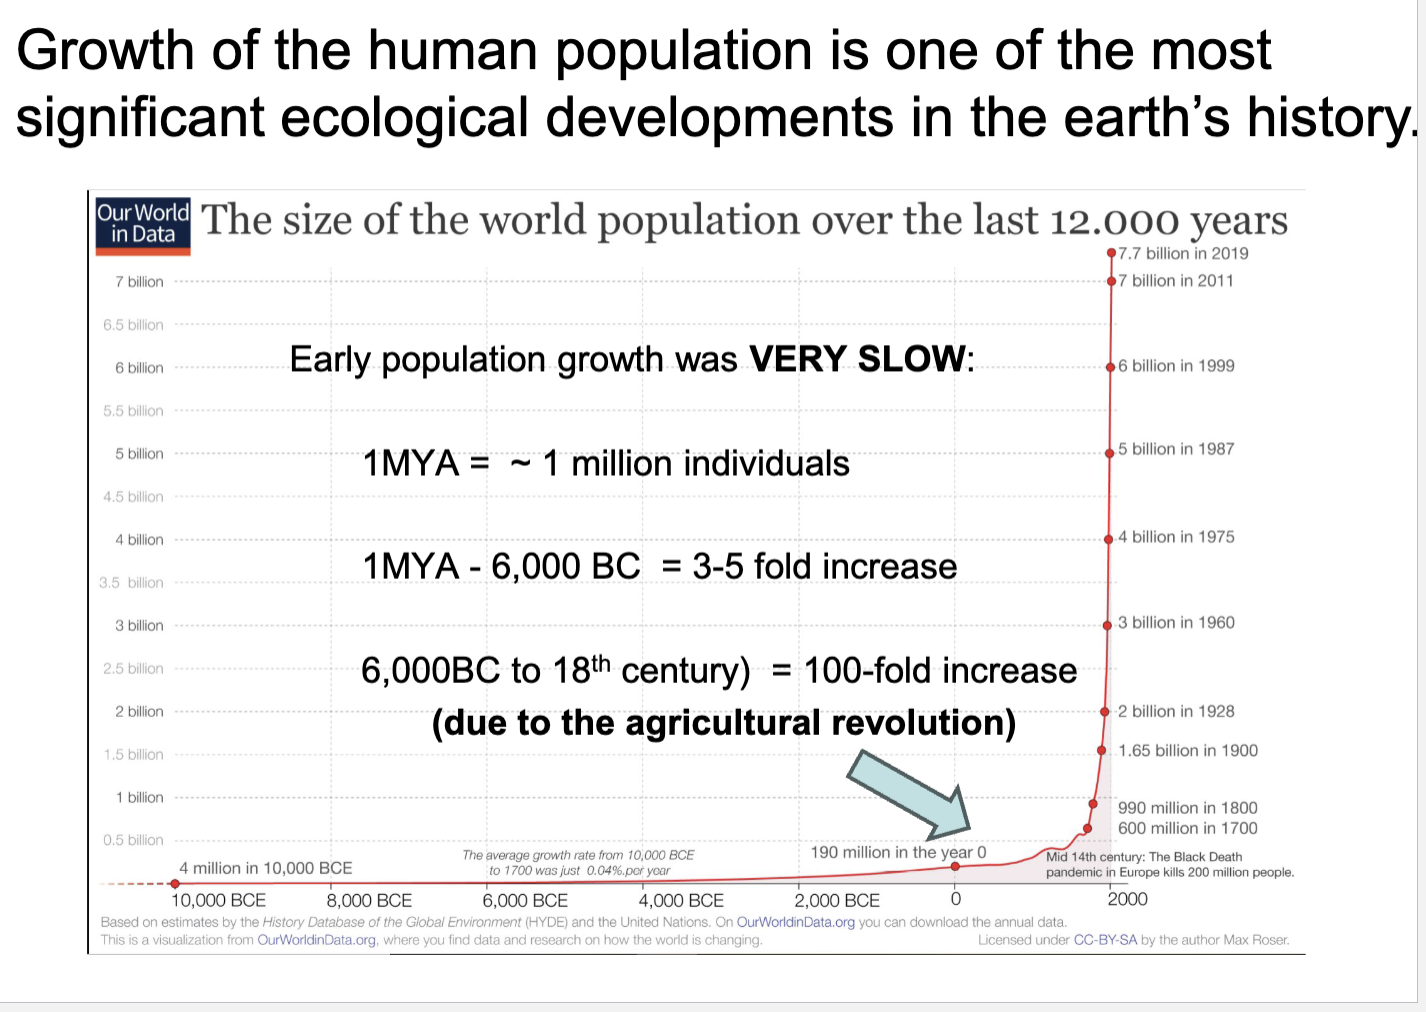
Early population growth was…
Very Slow
What cause the human population increase 100-fold
Agricultural revolution
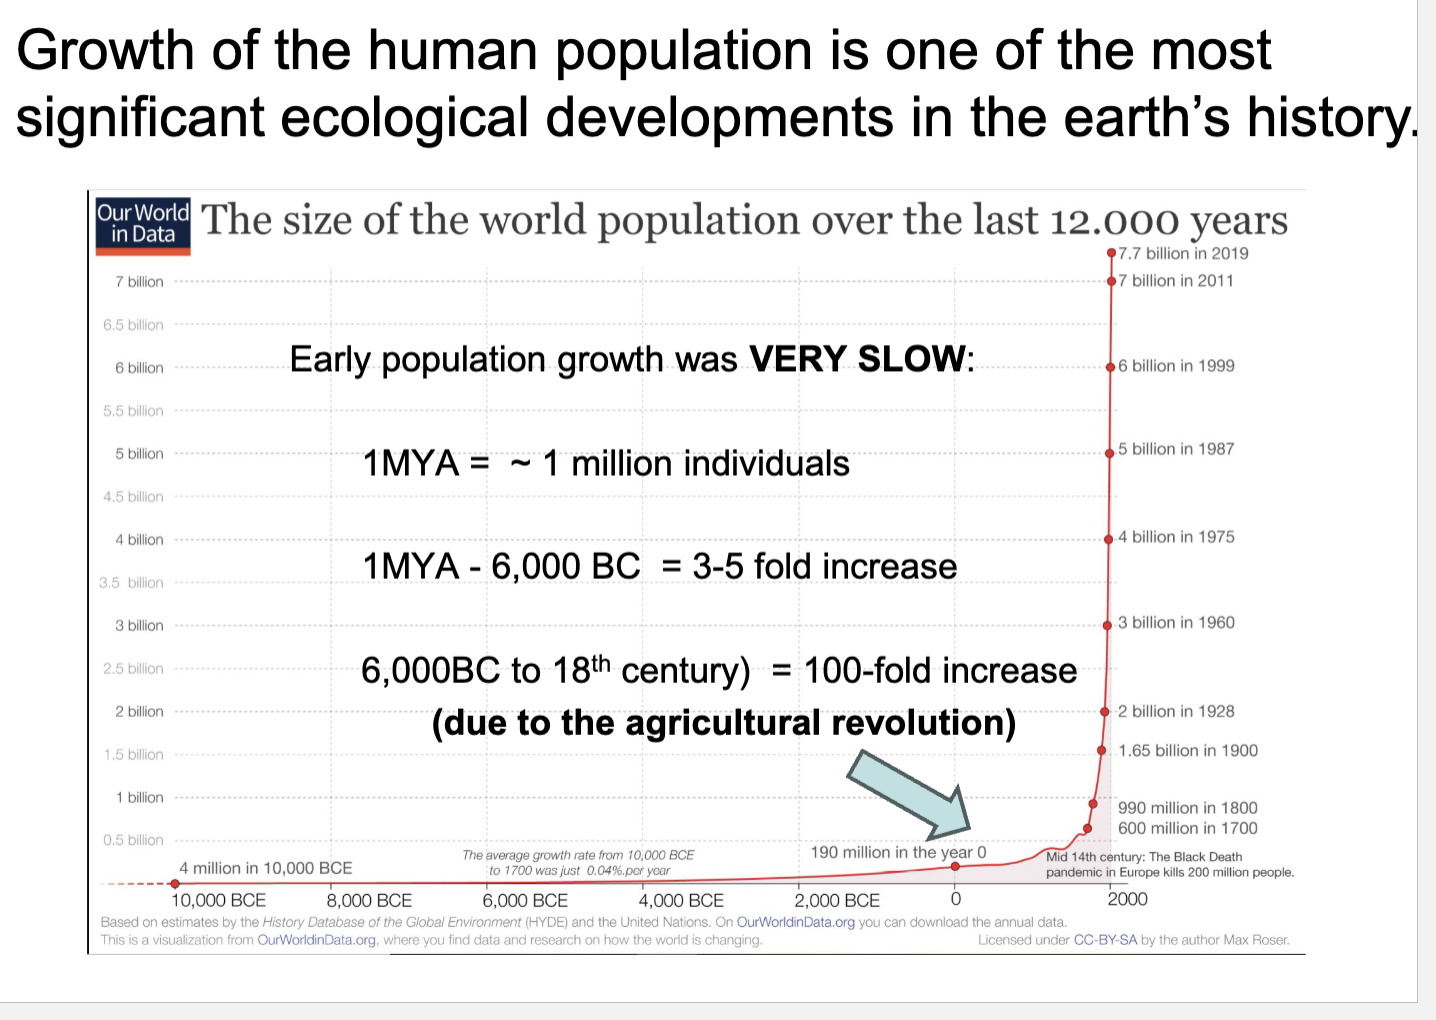
Why has population growth since 1800 been especially rapid
Due to medical advances reducing death rates
When, and at what level will the human population cease to grow?
There are many unknowns
The UN predicts plateau at 9 billion
Will the human population exceed the ability of the earth to support it?
There is no consensus on this point
What is agreed upon is that continued population growth will further stress the biosphere
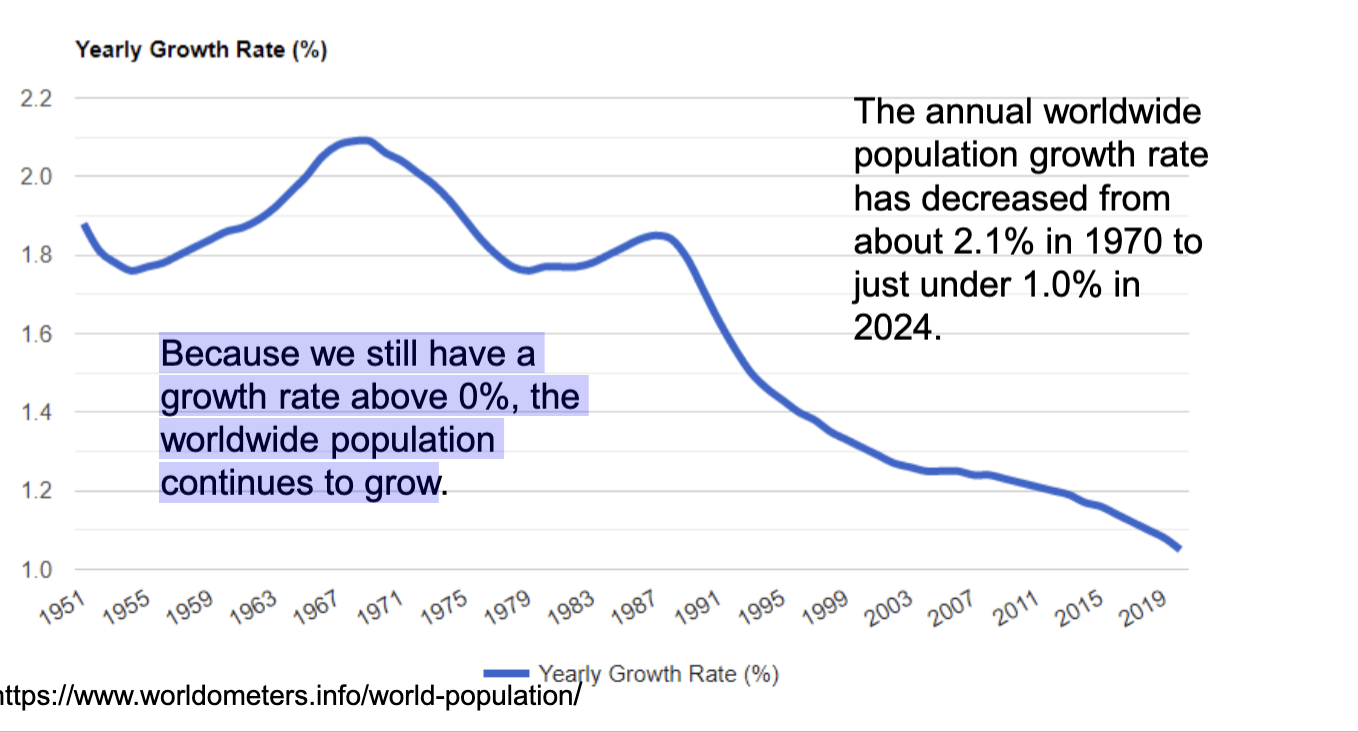
Developing countries are still growing but worldwide, human population growth rate has been declinign for decades
The annual worldwide population growth rate has decreased from about 2.1% in 1970 to just under 1.0% in 2024.
Because we still have a growth rate above 0%, the worldwide population continues to grow
Why is the reason fro decline in global growth not density dependent
Birth rates tend to decline in countries when income increases
With rising income, children are increasingly perceived as a liability rather than an asset
Population projections vary greatly, that median scenario predicting a plateau at 10.4 billion
The UN estimates that the best-case scenario is a plateau at 9 billion in 2050, then falling to 7.3 billion by 2100.
Low scenario depends upon aggressive education and rising incomes rapidly reducing birth rates in developing countries
Otherwise, a plateau of 10-11 billion is likely.
Life Tables
record how survival and reproductive rates vary with the age, size, or life stage of the individuals, allowing more accurate determinations of population growth rates
To estimate the per capita growth rate, r,
R0= Sum((Ix) x (Fx))
R0= Net reproductive rate
Ix= Survivorship
Fx = Fecundity
Then, G= SUM (( x * Ix * Fx) / (R0))
G= Generation Time
x= age values
Finally, r= ((ln R0) / (G))
r= Exponential growth rate
3 Takeaways from life tables
Age structure plays an important role in determining a population’s
reproductive rate and death rate, the two together determining a
population’s growth rate and population size over time.Knowing not only the age structure of a population, but also the
reproductive rates (fecundity) and death rates (mortality) of the
individual age classes can allow much more accurate predictions
of future changes in population size.If one population has many older individuals, while the other has
many younger individuals, the second population will likely grow
faster because it contains more individuals of reproductive age
and fewer individuals at the end of their life span.
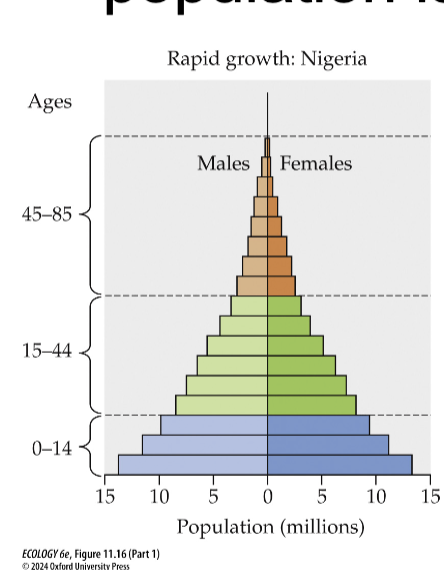
Rapid Growth Population structure
More population of individuals that can reproduce
Less old ppl
Negative Growth Population Structure
Less individuals at reproductive age
3 Takeaways from population structures
When each new cohort is larger than the last, the population is growing.
When each new cohort is smaller than the last, the population is declining.
If one population has many older individuals, while a second has many younger individuals, the second population will likely grow faster, all else equal, because it contains more individuals of reproductive age and fewer individuals at the end of their life span
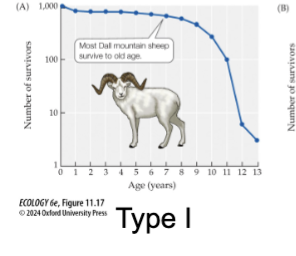
Type I Survivorship curve
High survival of young
Individuals survive to old age (late loss)
High survivorship throughout life
Majority reach old age
Human
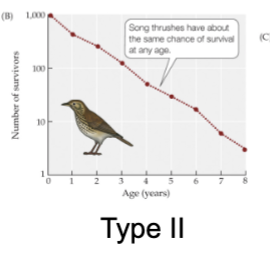
Type II Survivorship
Constant loss
Equal probability of dying throughout life
Bird, rodents
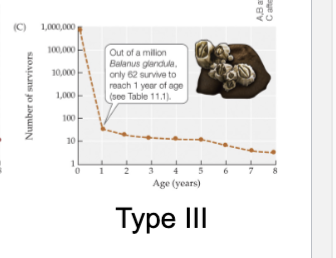
Type III Survivorship
Early Loss
Low survival of young
Low death rate after maturity
Oysters, small fishes, trees
Age (x) in life table
Age(x)= age of cohort year x
Age (0)= newborns
Age (1)= One-yr olds
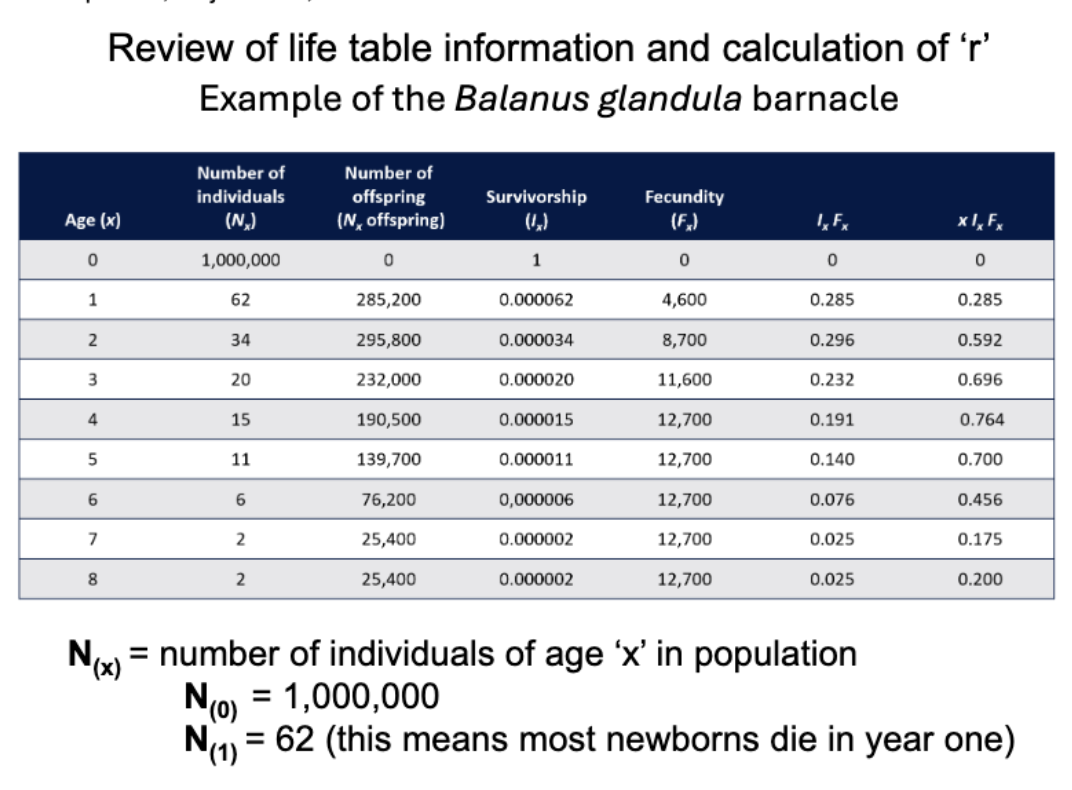
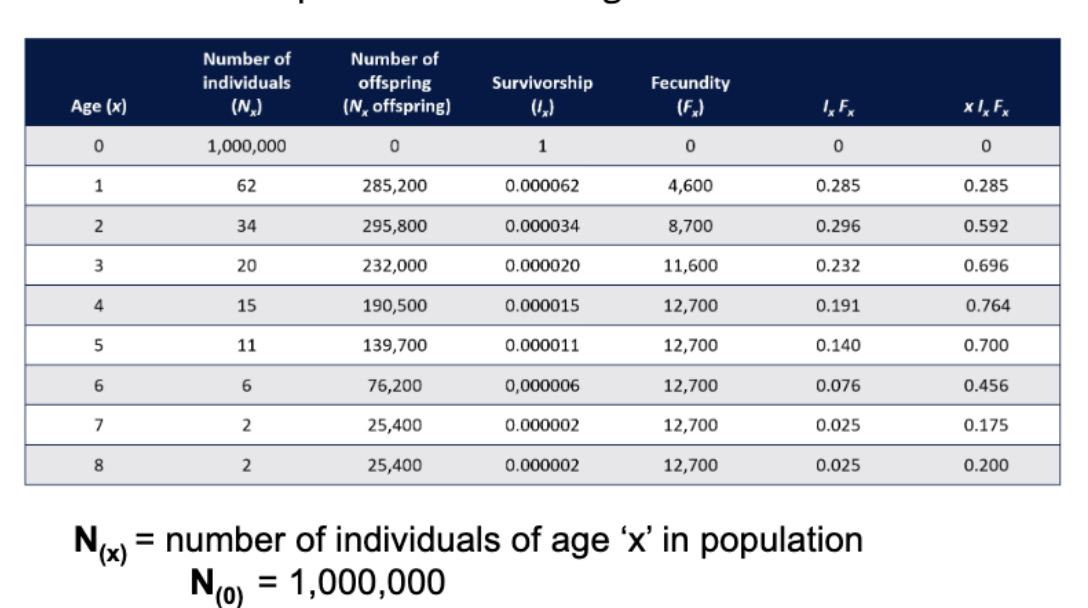
N(x) in life table
N(x)= number of individuals of age x in population
N(0)= 1,000,000
N(1)= 62 (means most newborns die in year one)
N(x) offspring in Life table
N(x) offspring= NUMBER OF OFFSPRING FROM INDIVIDUALS OF AGE (X)
N(0)= 0 (new borns have no offspring)
N(1)= 285,200
I(x) in life table
I(x)= Survivorship, proportion of og cohort that is still alive at age (x)
I(x)= N(x)/ N(0)
I(0)= 1,000,000/ 1,000,000= 1.0 ( By definition, all are alive when first born)
I(1)= 62/ 1,000,000= .000062 (But most are dead by end of first year of life)
What type of survivorship did B. glandula have?
Type III
F(x) in Life table
F(x)= Fecundity
F(x)= N(x) offspring= N(x)
F(1)= 285,200/62= 4600
F(2)= 295,800/34= 8700
For B. glandula offspring per individual increases age
R0 in life table
R 0 = sum (lx * Fx)
Net reproductive rate
The mean number of offspring produced per individual, adjusted for survival
G in life table
G= sum (x* lx * Fx)/ R0
Generation time
The average age of parents of all offspring in cohort
R in life life table
r = (ln R 0 )/ G
Exponential growth rate