microe ch 3
1/91
There's no tags or description
Looks like no tags are added yet.
Name | Mastery | Learn | Test | Matching | Spaced |
|---|
No study sessions yet.
92 Terms
demand
the amount of some good or service consumers are willing and able to purchase at each price
influenced by
changes in individual income
change in country economy (recession/inflation)
higher price for a substitute good has the reverse effect
supply
refers to the amount of some good or service a producer is willing and able to supply at each price. price is what the producer receives for selling 1 unit of a good or service
influenced by
changes in country economy (recession or inflation in case of war or natural disaster)
changes in innovation that might speed up production and/or change the cost of production can also have an effect
demand
also based on ability to pay
if you cannot pay for it, you have no effective demand
price
what a buyer pays for a unit of the specific good or service
qty demanded
the total number of units that consumers would purchase at that price is called
a rise in price of a good/service almost always decreases the ? of that good or service (inverse)
law of demand
inverse relationship btw price and qty demanded
assumes that all other variables that affect demand, are held constant
the amt consumers buy falls for 2 reasons
higher price
lower income
demand vs qty demanded
demand
relationship btw a range of prices and the quantities demanded at those prices
usually illustrate with a demand curve or a demand schedule
refers to the curve
qty demanded
means only a certain point on the demand curve or 1 qty on the demand schedule
refers to a specific point on the curve
supply vs qty supplied
supply
relationship btw a range of prices and the quantities supplied at those prices
illustrate with supply curve or a supply schedule
the curve
qty supplied
only a certain point on the supply curve, or one qty on the supply schedule
specific point on curve
demand curve
shows the relationship btw price and qty demanded on a graph
x axis: qty
y axis: price per gallon
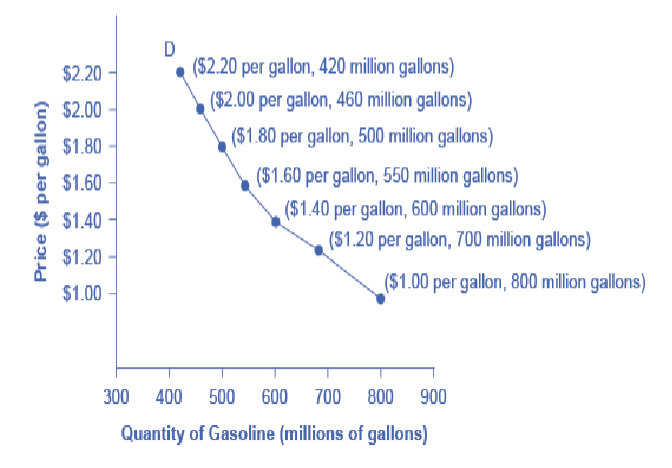
demand curves
fundamental similarities
slope down from L to R
embody the law of demand
as price increases, the qty demanded decreases
conversely, as the price decreases, the qty demanded increases
remember demand refers to the relationship btw a range of prices and the quantities demanded at those prices
demand refers to the curve but qty demanded refers to the specific point on the curve
law of supply
positive relationship btw price and qty supplied
higher price leads to a higher qty supplied
lower price leads to a lower qty supplied
price is what the producer receives for selling 1 unit of a good or service
a rise in price almost always leads to an increase in the qty supplied of that good or service
a fall in price will decrease the qty supplied
supply curve
graphic illustration of relationship btw price (y) and quantity (x)
supply schedule and the supply curve are 2 diff ways of showing the same info
the horizontal and vertical axes on the graph for the ? are same as for demand curve
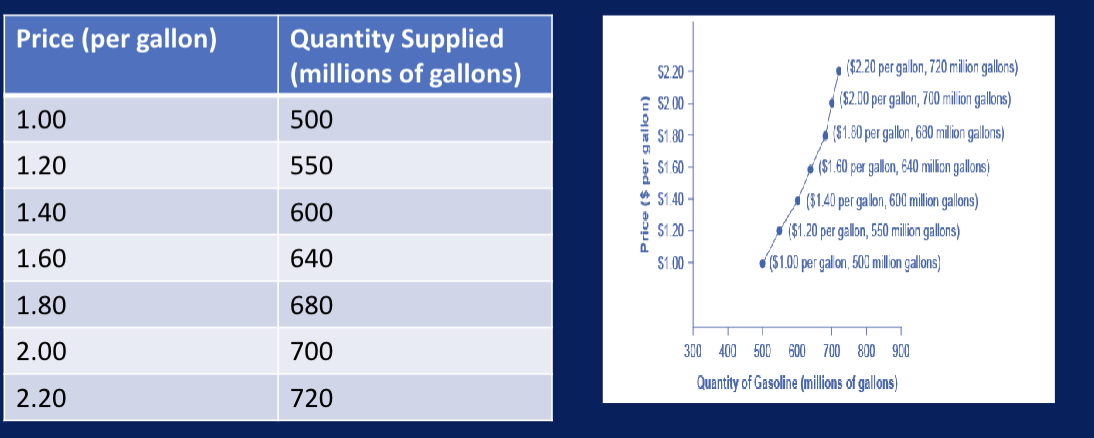
supply curves
fundamental similarity
slope up from L to R and illustrate the law of supply
as the price increases, the qty supplied increases
as the price falls, qty supplied decreases
remember
supply- relationship btw a range of prices and the qty supplied at those prices, a relationship illustrated by supply curve or supply schedule
supply refers to the curve and qty supplied refers to the specific point on the curve.
equilibrium
interaction of demand and supply where qty demanded= qty supplied
optimum level of production
shortage
demand exceeds supply
surplus
supply exceeds demand
equilibrium price (balance)
only price where the plans of consumers and plans of producers agree
aka market clearing price
if qty demanded doesn’t exactly equal the qty supplied, the market isn’t in equilibrium at that price. ten economic pressures arise to move the market toward the equilibrium price and equilibrium qty
equilibrium qty
where the amount of the product consumers want to buy (qty demanded) = amt producers want to sell (qty supplied)
no, price + willingness to purchase (desire) or ability to purchase (income)
is price the only factor influencing demand?
demand factors
price
pick another factor
willingness to purchase (desire)
ability to purchase (income)
ceteris paribus assumption
latin “other things being equal”
any given demand or supply curve is based on assumption that all else is held equal
a demand/supply curve is a relationship btw 2 and ONLY 2 variables when all other variables are kept constant
if other variables not held constant, then laws of supply and demand won’t necessarily hold, but we examine the changes one at a time, assuming other factors held constant
analyze each factor separately, then combine the results
ceteris paribus assumption
analyze complex problems more easily
allows you to look at the effect of 1 factor at a time on what it is you’re trying to analyze
when you’ve analyzed all the factors individually, you add the results together to get the final answer
ex., increase in interest rate causes demand for loans to fall (increase cost of borrowing, so less demand, but if confidence is high, ppl still want to borrow more. ceteris paribus assumes things like confidence remain the same).
market as a whole
a shift in demand curve captures a pattern for the market as a whole
not everyone has a higher/lower income and not everyone would buy or not buy an additional car.
normal good
a product whose demand rises when income rises and vice versa
for some- luxury cars, vacations in Europe and fine jewelry
inferior good
a product whose demand falls when income rises
as incomes rise, many people will buy fewer generic brand groceries and more name brand groceries
less likely to buy used cars and more likely to buy new cars
less likely to rent apartment and more likely to own a home
changing tastes or preferences
another factor that shifts demand curves
changes like shift from beef to chicken
change the qty of a good demanded at every price
they shift the demand curve for that good rightward for chicken and leftward for beef.
changes in population composition
another factor that shifts demand curves
more elderly people
notice a higher demand for nursing homes and hearing aids
changes in expectations about future prices or other factors affecting demand
although price of a good affects the qty demanded, also true that expectations about the future price can affect demand
shift in demand happens when a change in some economic factor (other than price) causes a diff qty to be demanded at every price
substitute
a good or service that we can use in place of another good or service
ex., price of coffee increases, the demand for tea may also increase as consumers switch from coffee to tea to maintain their budgets
complements
we often use the goods together bc consumption of one good tends to enhance consumption of the other
ex., breakfast cereal and milk
if the price of one good decreases, that will lead the demand of the other good to increase
a shift of the demand curve for beef to the left
After widespread press reports about the dangers of contracting "mad cow disease" by consuming beef from Canada, the likely economic effect on the U.S. demand curve for beef from Canada is:
A. no change; only the supply curve for beef is likely to be affected.
B. a shift of the demand curve for beef to the left.
C. a movement down along the demand curve for beef to the right.
D. a shift of the demand curve for beef to the right.
production costs and supply
supply curve shows how qty supplied changes as price changes (assume ceteris paribus)
when costs of production fall, firm will tend to supply a larger qty at any given price for its output
other factors that affect supply, profits (firm or business motivation)
firm produces goods and services using combo of labor, materials, and machinery (inputs or factors of production)
weather/natural conditions effect on supply
weather conditions affect cost of production for many agricultural products
severe drought→ decrease supply→ at any given price, a lower qty will be supplied (vise versa)
new tech for production affecting supply
a tech improvement that reduces costs of production will shift supply to the R, so that a greater qty will be produced at any given price
government policies affecting supply
can affect the cost of production and the supply curve thru taxes, regulations, and subsidies
businesses treat taxes as costs, so higher costs decrease supply of x
government subsidies affecting supply
occurs when government pays a firm directly or reduces the firm’s taxes if the firm carries out certain actions. from firm’s perspective, taxes or regulations are an additional cost of production that shifts supply to the L, leading the firm to produce a lower qty at every given price
the supply curve
A severe freeze has once again damaged the Florida orange crop. The impact on the market for orange juice will be a leftward shift of:
A. the supply curve.
B. the demand curve, as consumers try to economize because of the shortage. C. both the supply and demand curves.
D. the supply curve and a rightward shift of the demand curve, resulting in a higher equilibrium price.
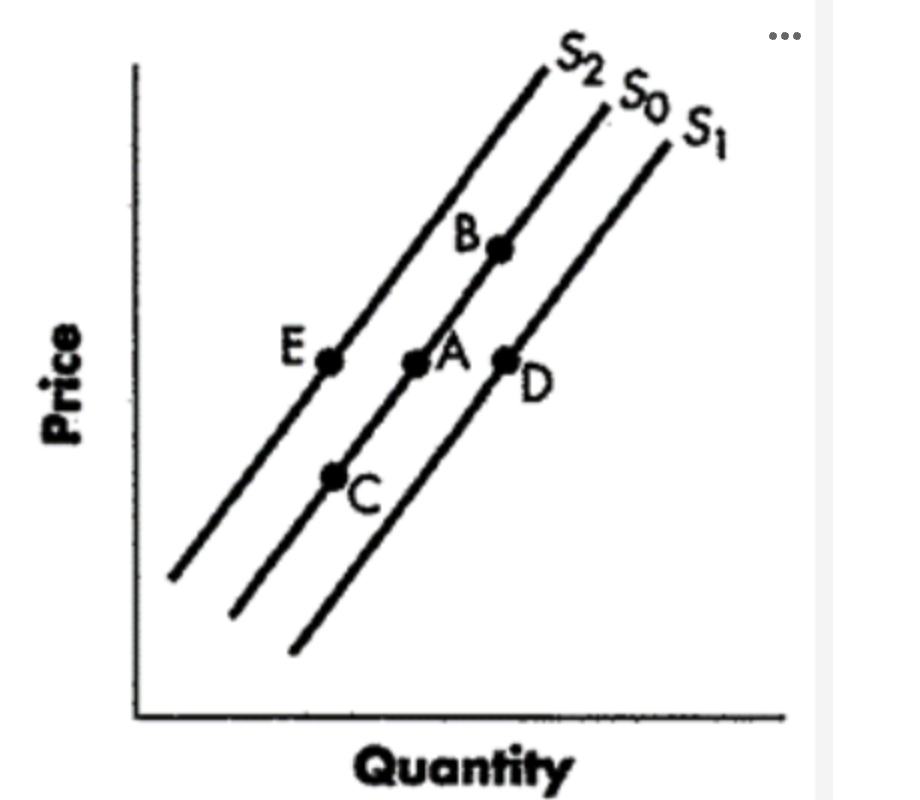
decrease in supply
change from point A to point E
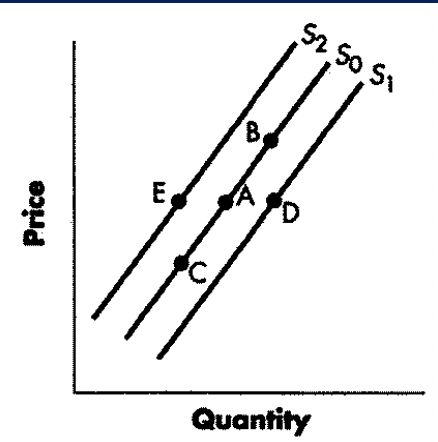
increase in supply
a change from point A to point D

increase in qty supplied
change from point A to point B

decrease in qty supplied
change from point a to point c

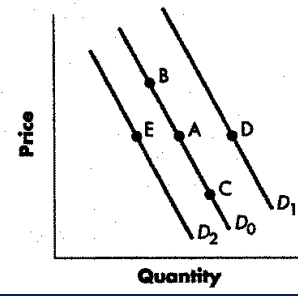
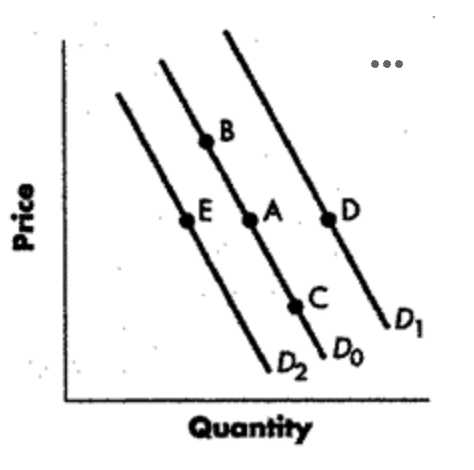
decrease in demand
change from point A to point E

increase in demand
change from point a to point d

decrease in qty demanded
change from point a to point b represents

increase in qty demanded
change from point a to point c represents
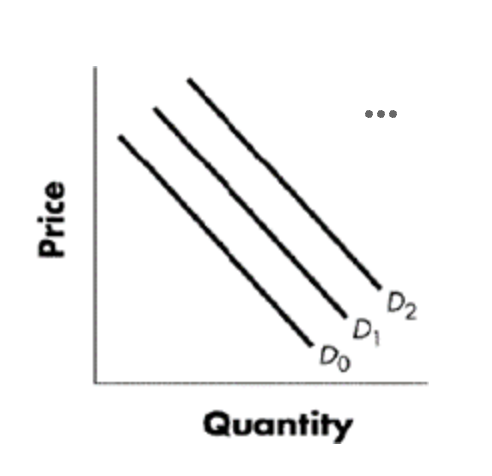
evaluating how economic event affected equilibrium price and qty
develop a demand and supply model to think about what the market looked like before the event
demand curve D0 and supply curve S0 show the og relationships
did the described change affect supply or demand
was the effect on demand positive or negative (r or l curve shift)
compare the new equilibrium price and qty to the original equilibrium price
types of changes
shift in demand curve, positive or negative
shift in supply curve, positive or negative
shift in both curves (supply and demand at the same time)
free market
operate with no government intervention
price controls
laws that governments enact to regulate prices
price ceiling
keeps a price from rising above a certain level (the “ceiling”)
price floor
keeps a price from falling below a given level
price ceiling
legal maximum price that one pays for some good or service
a government imposes this to keep the price of some necessary good or service affordable
pros
those who manage to purchase the product at the lower price given by the price ceiling will benefit
one of the ironies is that while it was intended to help renters rent control becomes a politically hot topic when rents begin to rise rapidly
cons
when market price isn’t allowed to rise to equilibrium level, qty demanded exceeds qty supplied, and thus a shortage occurs
quality is also likely to deteriorate
price floors
lowest price that one can legally pay for some good or service
ex., minimum wage (working FT should be able to afford basic standard of living)
pros:
when qty supplied exceeds the qty demanded, a surplus exists
cons:
if the government is willing to purchase the excess supply (or to provide payments for others to purchase it), then farmers will benefit from the price floor, but taxpayers and consumers will pay the costs
agricultural economists and policy makers have offered numerous proposals for reducing farm subsidies
price floors
aka price support
they support a price by preventing it from falling below a certain level
the lowest price one can legally pay for some good or service
ex., minimum wage
ex., agriculture sector (++ gov enters the market sometimes and buys up the product)
economic efficiency
the familiar demand and supply diagram holds within it the concept of ?
1 typical way economists define ? is when it’s impossible to improve the situation of one party wo imposing a cost on another. vise versa
basically, the optimal amount of each good and service is produced and consumed
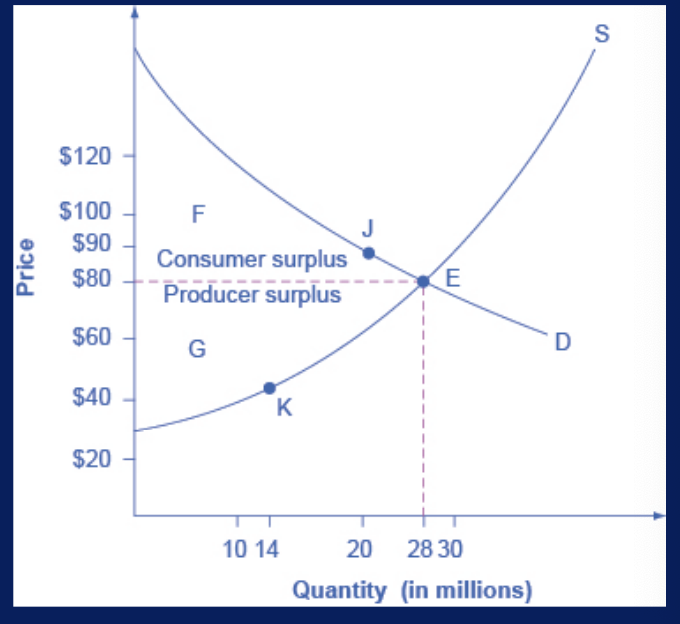
consumer surplus
the amount that individuals would have been willing to pay, minus the amount that they actually paid
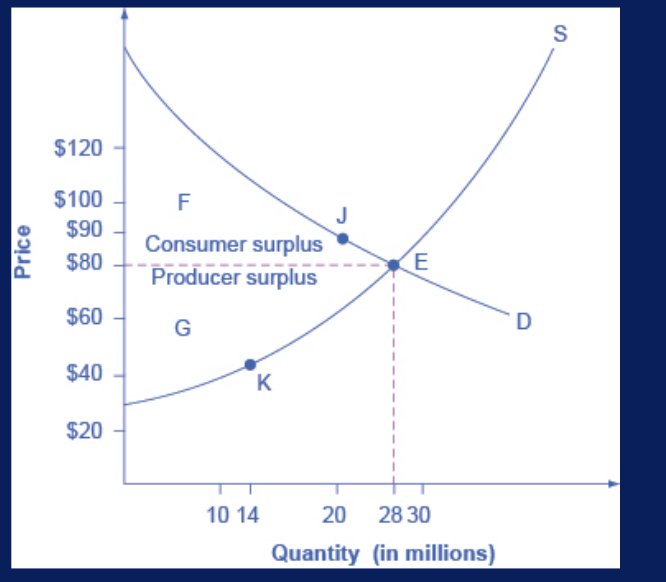
producer surplus
the amount that a seller is paid for a good minus the seller’s actual cost
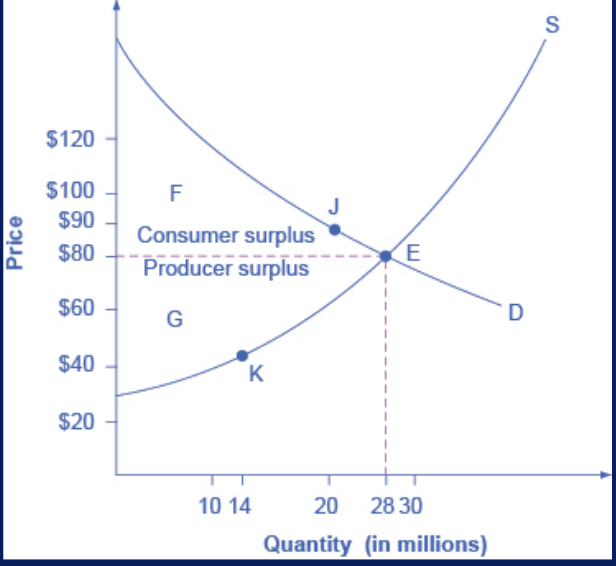
social surplus (total)
consumer surplus + producer surplus = ?
aka economic surplus
shown in area F+G
larger at equilibrium qty and price than it would be at any other qty
demonstrates economic efficiency of the market equilibrium
efficiency achieved when ? is maximized
inefficiency of price floors and ceilings
imposition of price floor or a price ceiling will prevent a market from adjusting to its equilibrium price and qty, and thus will create an inefficient outcome
there is a way to prevent crating inefficiency, price floors and ceilings will also transfer some consumer surplus to producers, or some producer surplus to consumers
an inefficient outcome occurs and the total surplus of society is reduced. The loss in social surplus that occurs when the economy produces at an inefficient qty is deadweight loss
price ceiling will transfer some producer surplus to consumers which is why consumers often favor them
a price flow will transfer some consumer surplus to producers, which is why producers often favor them
deadweight loss
the loss in social surplus that occurs when the economy produces at an inefficient qty
demand and supply as a social adjustment mechanism
demand and supply model emphasizes that prices are not set only by demand or only by supply but by their interaction
excess demand
If the price is below the equilibrium level, then the quantity demanded will exceed the quantity supplied. This is known as ________________.
Option A
a price ceiling
Option B
ceteris paribus
Option C
excess demand
Option D
excess supply
law of demand
Economists refer to the relationship that a higher price leads to a lower quantity demanded as the
Option A
law of demand
Option B
income gap
Option C
market equilibrium
Option D
price model
supply curve to the right
A drought decreases the supply of agricultural products, which means that at any given price a lower quantity will be supplied; conversely, especially good weather would shift the _________________________.
Option A
demand curve to the left
Option B
supply curve to the right
Option C
demand curve to the right
Option D
supply curve to the left
The statement is correct.
Interpret the following statement: "An increase in the price of wheat will encourage farmers to increase the quantity of wheat supplied to the market."
Option A
The statement is incorrect because it confuses a change in quantity supplied with a change in supply.
Option B
The statement is correct.
Option C
The statement would be correct if "quantity of wheat demanded" were substituted for "quantity of wheat supplied."
Option D
The statement would be correct if it read that a "decrease in the price of wheat will encourage farmers to increase the quantity of wheat supplied to the market."
all else is held equal
Any given demand or supply curve is based on the ceteris paribus assumption that
Option A
everything is variable.
Option B
what is true for the individual is not necessarily true for the whole.
Option C
all else is held equal
Option D
no one knows which variables will change and which will remain constant
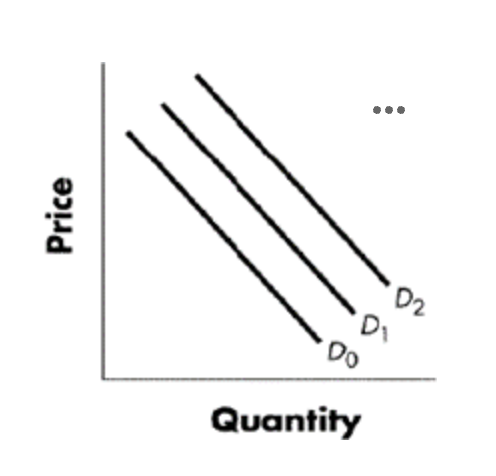
increase in demand
Refer to the Figure blow, Using the graph above and beginning on D1, a shift to D2 would indicate a(n):
Option A
decrease in demand.
Option B
decrease in quantity demanded.
Option C
increase in demand.
Option D
increase in quantity demanded.
costs of production fall
When __________________, a firm will supply a higher quantity at any given price for its output, and the supply curve will shift to the right.
Option A
equilibrium is achieved
Option B
costs of production fall
Option C
there is a population increase
Option D
prices rise
qty supplied
When economists talk about supply, they are referring to a relationship between price received for each unit sold and the ________________.
Option A
quantity supplied
Option B
demand curve
Option C
demand schedule
Option D
market price
a rise in demand ig*
The computer market in recent years has seen many more computers sell at much lower prices. What shift in demand is most likely to explain this outcome?
Option A
A rise in demand
Option B
A rise in supply
Option C
A fall in demand
Option D
A fall in supply
equilibrium qty
The _______________ is the quantity where quantity demanded and quantity supplied are equal at a certain price.
Option A
equilibrium quantity
Option B
quantity demanded
Option C
supply schedule
Option D
demand schedule
up from L to R
Nearly all supply curves share a basic similarity: they slope ________________.
Option A
up from left to right
Option B
up from right to left
Option C
down from left to right
Option D
down from right to left
buyers desire to purchase less of it.
The nature of demand indicates that as the price of a good increases:
Option A
suppliers wish to sell less of it.
Option B
buyers desire to purchase less of it.
Option C
more of it is produced.
Option D
more of it is desired.
a change along the supply curve
A change in price of a good or service typically causes ________________ for that specific good or service.
Option A
the supply curve to shift to the left
Option B
a decreased demand
Option C
a new equilibrium price
Option D
a change along the supply curve
qty demanded
refers to the total number of units that are purchased at that price.
Option A
market quantity
Option B
supply
Option C
quantity
Option D
quantity demanded
qty
A supply curve is a graphical illustration of the relationship between price, shown on the vertical axis, and _________________, shown on the horizontal axis.
Option A
price of quantity supplied
Option B
quantity
Option C
demand
Option D
quantity demanded
price, qty demanded
The downward slope of the demand curve again illustrates the pattern that as _____________ rises, ______________ decreases.
Option A
price, quantity demanded
Option B
price, quantity supplied
Option C
quantity supplied, quantity demanded
Option D
quantity demanded, price
decrease in supply
Refer to Figure 3-3. A change from Point A to Point E (top to bottom) represents a(n):
Option A
increase in supply.
Option B
decrease in supply.
Option C
increase in quantity supplied.
Option D
decrease in quantity supplied.
decrease in qty demanded
a change from Point A to Point B represents an:
Option A
increase in quantity demanded.
Option B
decrease in demand.
Option C
increase in demand.
Option D
decrease in quantity demanded.
goods x and y are complement goods
if an increase in price of good x causes a decrease in demand for good y…
goods x and y are normal goods
goods x and y are substitute goods
goods x and y are complement goods
the price of good y will increase
price, qty demanded
The downward slope of the demand curve again illustrates the pattern that as _____________ rises, ______________ decreases.
Option A
quantity supplied, quantity demanded
Option B
price, quantity demanded
Option C
quantity demanded, price
Option D
price, quantity supplied
qty demanded
____________ refers to the total number of units that are purchased at that price.
Option A
quantity
Option B
quantity demanded
Option C
market quantity
Option D
supply
decrease in supply
A change from Point A to Point E (top to bottom) represents a(n):
Option A
increase in supply.
Option B
decrease in quantity supplied.
Option C
increase in quantity supplied.
Option D
decrease in supply.
decrease in quantity demanded.
Shift from Point A to Point B
decrease in demand.
Option B
increase in quantity demanded.
Option C
increase in demand.
Option D
decrease in quantity demanded.
excess demand
If the price is below the equilibrium level, then the quantity demanded will exceed the quantity supplied. This is known as ________________.
Option A
ceteris paribus
Option B
a price ceiling
Option C
excess demand
Option D
excess supply
increase in demand
shift from d1 to d2
increase in quantity demanded.
Option B
decrease in demand.
Option C
decrease in quantity demanded.
Option D
increase in demand.
a change along the supply curve
A change in price of a good or service typically causes ________________ for that specific good or service.
Option A
a decreased demand
Option B
a change along the supply curve
Option C
the supply curve to shift to the left
Option D
a new equilibrium price
buyers desire to purchase less of it
The nature of demand indicates that as the price of a good increases:
Option A
buyers desire to purchase less of it.
Option B
more of it is desired.
Option C
more of it is produced.
Option D
suppliers wish to sell less of it
costs of production fall
When __________________, a firm will supply a higher quantity at any given price for its output, and the supply curve will shift to the right.
Option A
costs of production fall
Option B
equilibrium is achieved
Option C
prices rise
Option D
there is a population increase
qty
A supply curve is a graphical illustration of the relationship between price, shown on the vertical axis, and _________________, shown on the horizontal axis.
Option A
demand
Option B
price of quantity supplied
Option C
quantity
Option D
quantity demanded