The Heart
0.0(0)
Card Sorting
1/23
Earn XP
Description and Tags
Study Analytics
Name | Mastery | Learn | Test | Matching | Spaced |
|---|
No study sessions yet.
24 Terms
1
New cards
![A student carried out a dissection of the heart.
This is an example of a drawing from one of the students.
Name the structure labelled X. \[1\]](https://knowt-user-attachments.s3.amazonaws.com/550751441adf491bb7b2fa496fa1d392.jpeg)
A student carried out a dissection of the heart.
This is an example of a drawing from one of the students.
Name the structure labelled X. \[1\]
This is an example of a drawing from one of the students.
Name the structure labelled X. \[1\]
Septum
2
New cards
![A student carried out a dissection of the heart.
This is an example of a drawing from one of the students.
Another student pointed out that there were structural and labelling errors in the drawing. List 3 errors and the correction you would make for this drawing.
Biological drawing errors are not required. \[3\]](https://knowt-user-attachments.s3.amazonaws.com/9c121fbb09c24b4aa47eaaa57e160c89.jpeg)
A student carried out a dissection of the heart.
This is an example of a drawing from one of the students.
Another student pointed out that there were structural and labelling errors in the drawing. List 3 errors and the correction you would make for this drawing.
Biological drawing errors are not required. \[3\]
This is an example of a drawing from one of the students.
Another student pointed out that there were structural and labelling errors in the drawing. List 3 errors and the correction you would make for this drawing.
Biological drawing errors are not required. \[3\]
left ventricle wall should be thicker than right (not equal) ✓
label ‘right ventricle’ should be (left / right) atrium ✓
label ‘tricuspid valve’ should be semi-lunar valve ✓
idea that drawing is wrong way round so left ventricle should be on the right side of the page ✓
label ‘right ventricle’ should be (left / right) atrium ✓
label ‘tricuspid valve’ should be semi-lunar valve ✓
idea that drawing is wrong way round so left ventricle should be on the right side of the page ✓
3
New cards
![This is a drawing of a dissected human heart.
Identify the structures labelled A to E. \[5\]](https://knowt-user-attachments.s3.amazonaws.com/25700feab96f47bdacb1f6633b4900c0.jpeg)
This is a drawing of a dissected human heart.
Identify the structures labelled A to E. \[5\]
Identify the structures labelled A to E. \[5\]
A sino-atrial node (SAN)
B right atrium
C inferior vena cava
D semi-lunar valve
E atrioventricular valve (bicuspid valve)
B right atrium
C inferior vena cava
D semi-lunar valve
E atrioventricular valve (bicuspid valve)
4
New cards
What are the different valves?
Semi-lunar valve (aortic) is between left ventricle and aorta
Atrioventricular valves are between ventricles and atria:
* Mitral/Bicuspid valve is left side of heart
* Tricuspid valve is right side of heart
Atrioventricular valves are between ventricles and atria:
* Mitral/Bicuspid valve is left side of heart
* Tricuspid valve is right side of heart
5
New cards
![Valves control the flow of blood through the heart.
Complete the table below to show the roles of two valves in the heart. \[2\]](https://knowt-user-attachments.s3.amazonaws.com/5cafbdf3ceb04d5e960fdf9d0b095b81.jpeg)
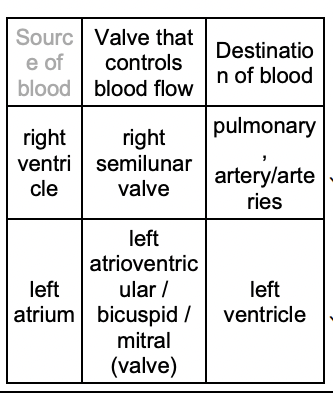
Valves control the flow of blood through the heart.
Complete the table below to show the roles of two valves in the heart. \[2\]
Complete the table below to show the roles of two valves in the heart. \[2\]
6
New cards
![A ventricular septal defect (VSD) is a hole in the septum of the heart.
The diagram below shows a heart with VSD.
Describe and explain why people with VSD can easily become tired. \[4\]](https://knowt-user-attachments.s3.amazonaws.com/c7f28938ecee42479c7196c69ace4bab.jpeg)
A ventricular septal defect (VSD) is a hole in the septum of the heart.
The diagram below shows a heart with VSD.
Describe and explain why people with VSD can easily become tired. \[4\]
The diagram below shows a heart with VSD.
Describe and explain why people with VSD can easily become tired. \[4\]
blood, leaks from left to right ventricle (during ventricular systole) ✓
(**more**) oxygenated blood delivered to lungs ✓
deoxygenated blood passes into left ventricle (during atrial systole) ✓
**less** oxygenated blood pumped, around the body / to tissues / to cells ✓
**less** oxygen available for (aerobic) respiration / ATP production ✓
(**more**) oxygenated blood delivered to lungs ✓
deoxygenated blood passes into left ventricle (during atrial systole) ✓
**less** oxygenated blood pumped, around the body / to tissues / to cells ✓
**less** oxygen available for (aerobic) respiration / ATP production ✓
7
New cards
![Both of these hearts were considered for use in a school dissection.
A student decided heart 2 would be better as it has more structures present.
What evidence from the 2 hearts support the student’s decision? \[1\]](https://knowt-user-attachments.s3.amazonaws.com/3671ef58be6f4f05bd11642ddc3ec9a6.jpeg)
Both of these hearts were considered for use in a school dissection.
A student decided heart 2 would be better as it has more structures present.
What evidence from the 2 hearts support the student’s decision? \[1\]
A student decided heart 2 would be better as it has more structures present.
What evidence from the 2 hearts support the student’s decision? \[1\]
* Can see aorta
* Can see blood vessels (such as vena cava, pulmonary artery etc)
* Can see blood vessels (such as vena cava, pulmonary artery etc)
8
New cards
![Name the structure labelled Z. \[1\]](https://knowt-user-attachments.s3.amazonaws.com/aeea0e75ccdb4cec96e91a288b86cd6a.jpeg)
Name the structure labelled Z. \[1\]
Left ventricle
9
New cards
![A school biology class carried out a dissection of a mammalian heart. A student drew the diagram shown.
Name the structures labelled A. \[1\]](https://knowt-user-attachments.s3.amazonaws.com/d5cbd23aeeec4afba7dd6feecd853e95.jpeg)
A school biology class carried out a dissection of a mammalian heart. A student drew the diagram shown.
Name the structures labelled A. \[1\]
Name the structures labelled A. \[1\]
Branches of the coronary artery
10
New cards
![A school biology class carried out a dissection of a mammalian heart. A student drew the diagram shown.
Name the tissue labelled B. \[1\]](https://knowt-user-attachments.s3.amazonaws.com/563809610d9345ac85760d4bbbd0f23a.jpeg)
A school biology class carried out a dissection of a mammalian heart. A student drew the diagram shown.
Name the tissue labelled B. \[1\]
Name the tissue labelled B. \[1\]
Cardiac/ heart muscle
11
New cards
![One heart being examined in the lesson had both atria missing. The internal structure of this heart was examined by a pair of students.
Complete Table 3.1 to indicate which features were **visible to the naked eye** on the heart **with no atria**. \[3\]](https://knowt-user-attachments.s3.amazonaws.com/5629a58e0b77413aa77fa46fbd4d8566.jpeg)
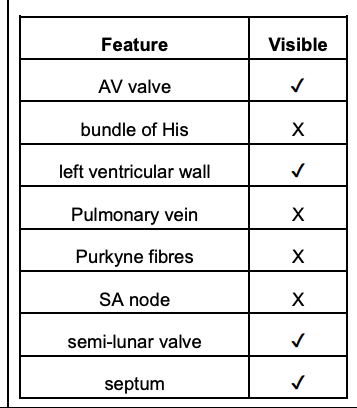
One heart being examined in the lesson had both atria missing. The internal structure of this heart was examined by a pair of students.
Complete Table 3.1 to indicate which features were **visible to the naked eye** on the heart **with no atria**. \[3\]
Complete Table 3.1 to indicate which features were **visible to the naked eye** on the heart **with no atria**. \[3\]
12
New cards
![This graph shows the pressure changes during the cardiac cycle.
Use the figure to compare the changes in pressure in the left ventricle with the changes in pressure in the left atrium. \[4\]](https://knowt-user-attachments.s3.amazonaws.com/6715ce63cef046e6a85b8dbba1a33563.jpeg)
This graph shows the pressure changes during the cardiac cycle.
Use the figure to compare the changes in pressure in the left ventricle with the changes in pressure in the left atrium. \[4\]
Use the figure to compare the changes in pressure in the left ventricle with the changes in pressure in the left atrium. \[4\]
1\. similar increase and decrease (in pressure), between 0 to 0.15s / to 0.15s / to point X ✓
2\. steeper / faster, rise / fall, in ventricle (pressure) ✓
3\. bigger , increase / decrease, in ventricle (pressure) ✓
4\. idea that at approximately 0.15s atrial (pressure) has, (small) rise and fall / AW, but ventricular is increasing ✓
5\. idea that from approximately 0.3s ventricular pressure decreases but atrial pressure still increasing ✓
6\. from 0.5s no change in pressure(s) in both ✓
7\. comparative figures with units ✓
13
New cards
![Use the figure to calculate the heart rate of the individual to 2 s.f. \[1\]](https://knowt-user-attachments.s3.amazonaws.com/f7a10fd5988b47c1a6da00c3b8b2e4fb.jpeg)
Use the figure to calculate the heart rate of the individual to 2 s.f. \[1\]
86 bpm
(0.7s for one; do 60s/0.7s= 85.7)
(0.7s for one; do 60s/0.7s= 85.7)
14
New cards
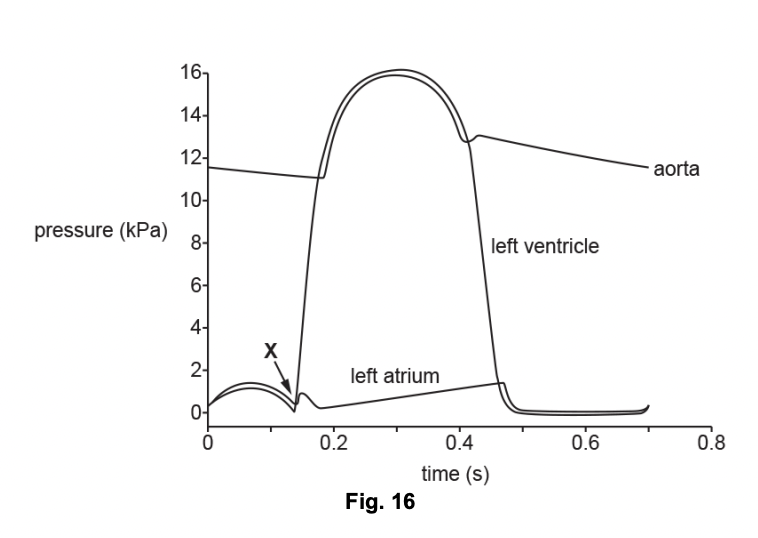
Name the valve which closes at point X on the figure.
atrioventricular
15
New cards
![The figure shows the heart at different stages of the cardiac cycle.
Box A shows atrial diastole. Blood is entering the atria, which are relaxed.
Outline the remaining stages of the cardiac cycle, with reference to the remaining boxes in the figure. \[6\]](https://knowt-user-attachments.s3.amazonaws.com/d0a01216cb204c9fbbf49983b37ced26.jpeg)
The figure shows the heart at different stages of the cardiac cycle.
Box A shows atrial diastole. Blood is entering the atria, which are relaxed.
Outline the remaining stages of the cardiac cycle, with reference to the remaining boxes in the figure. \[6\]
Box A shows atrial diastole. Blood is entering the atria, which are relaxed.
Outline the remaining stages of the cardiac cycle, with reference to the remaining boxes in the figure. \[6\]
B:
• atrial diastole
• ventricular diastole
• atria relax
• ventricles relax •
blood flows through, atrioventricular / AV / bicuspid / tricuspid, valve(s) OR ref. to their opening (more)
• blood enters atria (passively) • blood enters ventricles (passively)
\
C:
• atrial systole
• atria contract
• pressure (on blood) in atria increases
• blood flows through, atrioventricular / AV / bicuspid / tricuspid, valve(s) OR ref. to their being open
• ventricles fill / more blood enters ventricles • volume (of ventricles) increases
• pressure (of blood against ventricles) increases
• pressure in arteries is, low / at a minimum
D:
• ventricular systole
• ventricles contact
• volume (of ventricles) decreases
• pressure (on blood in ventricles) increases
• atrioventricular / bicuspid / tricuspid, valves close
• semi-lunar valves open
• blood flows into aorta
• blood flows into pulmonary arteries
16
New cards
![The pressure changes in one mammalian cardiac cycle is shown in this graph.
Which of the following time periods, A to D, shows ventricular systole? \[1\]
A. 0.0 to 0.1 s
B. 0.2 to 0.3 s
C. 0.4 to 0.5 s
D. 0.6 to 0.8 s](https://knowt-user-attachments.s3.amazonaws.com/00f7905261a44065aedf05859bc6b2f6.jpeg)
The pressure changes in one mammalian cardiac cycle is shown in this graph.
Which of the following time periods, A to D, shows ventricular systole? \[1\]
A. 0.0 to 0.1 s
B. 0.2 to 0.3 s
C. 0.4 to 0.5 s
D. 0.6 to 0.8 s
Which of the following time periods, A to D, shows ventricular systole? \[1\]
A. 0.0 to 0.1 s
B. 0.2 to 0.3 s
C. 0.4 to 0.5 s
D. 0.6 to 0.8 s
B. 0.2 to 0.3 s
17
New cards
![Describe the events taking place at the points marked W, X, Y and Z and explain how these events are related to the changes in pressure shown in the diagram. \[6\]](https://knowt-user-attachments.s3.amazonaws.com/3d02c124ebc64303981ff7611240ac18.jpeg)
Describe the events taking place at the points marked W, X, Y and Z and explain how these events are related to the changes in pressure shown in the diagram. \[6\]
__Chambers__
• ventricles begin to contract at Y
• ventricles are relaxing between W and Y
• atria relaxed at W, X, Y and Z • atrial contraction completed before Y.
__Valves__
• A-V / bicuspid, valve closes at Y and opens at X
• semilunar / aortic, valve opens at Z and closes at W.
__Pressure__
• At W ventricular pressure falls below aortic pressure
• At X ventricular pressure falls below atrial pressure
• At Y ventricular pressure rises above atrial pressure
• At Z ventricular pressure rises above aortic pressure.
18
New cards
![A patient was admitted to a hospital ward suffering from a heart rhythm abnormality.
The figure shows an ECG trace of the patient upon arrival at the hospital and a trace from when their heart rhythm had settled down to that of a normal functioning heart.
Use the traces to name the heart rhythm abnormality that the patient is suffering from. \[1\]](https://knowt-user-attachments.s3.amazonaws.com/95034438b11648aba8061969cf428bfb.jpeg)
A patient was admitted to a hospital ward suffering from a heart rhythm abnormality.
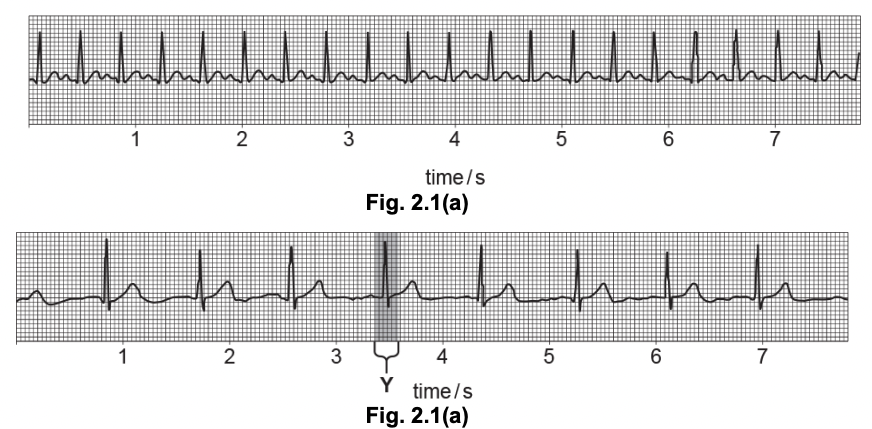
The figure shows an ECG trace of the patient upon arrival at the hospital and a trace from when their heart rhythm had settled down to that of a normal functioning heart.
Use the traces to name the heart rhythm abnormality that the patient is suffering from. \[1\]
The figure shows an ECG trace of the patient upon arrival at the hospital and a trace from when their heart rhythm had settled down to that of a normal functioning heart.
Use the traces to name the heart rhythm abnormality that the patient is suffering from. \[1\]
Tachycardia
19
New cards
Explain how the heart is controlling the electrical activity on the figure.
1 wave of excitation
2 from atrioventricular node
3 (through / along) bundle of His / Purkyne fibres, to (cause contraction of) ventricles
2 from atrioventricular node
3 (through / along) bundle of His / Purkyne fibres, to (cause contraction of) ventricles
20
New cards
![The figure shows an ECG trace of a person with an abnormal heart rhythm.
Using this information, what conclusions can you draw about the way in which this person’s heart is functioning abnormally? \[3\]](https://knowt-user-attachments.s3.amazonaws.com/f7d2b419e27f4d1facd66e51a2e3d986.jpeg)
The figure shows an ECG trace of a person with an abnormal heart rhythm.
Using this information, what conclusions can you draw about the way in which this person’s heart is functioning abnormally? \[3\]
Using this information, what conclusions can you draw about the way in which this person’s heart is functioning abnormally? \[3\]
no distinct, P wave showing atrial depolarisation (1)
irregular / weak, atrial contraction (1)
insufficient blood forced into ventricles (1)
although ventricles contract, there is less blood forced from the heart (1)
irregular / weak, atrial contraction (1)
insufficient blood forced into ventricles (1)
although ventricles contract, there is less blood forced from the heart (1)
21
New cards
![This is an ECG of a patient’s heart after a black widow spider bite.
Which heart abnormality is suggested by this trace? \[1\]](https://knowt-user-attachments.s3.amazonaws.com/464beb6f1a5e4e94b6eadeaf3f9d732e.jpeg)
This is an ECG of a patient’s heart after a black widow spider bite.
Which heart abnormality is suggested by this trace? \[1\]
Which heart abnormality is suggested by this trace? \[1\]
Ventricular tachycardia
22
New cards
![These are ECGs from two different individuals: X and Y.
Describe and explain the differences between the 2 ECGs. \[4\]](https://knowt-user-attachments.s3.amazonaws.com/7c8de1e23cec492da364577cc155b0d8.jpeg)
These are ECGs from two different individuals: X and Y.
Describe and explain the differences between the 2 ECGs. \[4\]
Describe and explain the differences between the 2 ECGs. \[4\]
* X shows atrial fibrillation, Y shows a normal sinus rhythm
* X shows no defined P wave, whereas Y does
* X shows rapid electrical atrial impulses
* X is getting electrical impulses from places other than SAN
* X shows smaller gaps between QRS complexes
* the heart rate set by the SAN is faster in X
* X shows no defined P wave, whereas Y does
* X shows rapid electrical atrial impulses
* X is getting electrical impulses from places other than SAN
* X shows smaller gaps between QRS complexes
* the heart rate set by the SAN is faster in X
23
New cards
Draw an ECG trace to represent a recording from a patient with an ectopic heartbeat.
Show at least 3 cardiac cycles. \[2\]
Show at least 3 cardiac cycles. \[2\]
three cardiac cycles drawn (1)
second cardiac cycle closer to the first cycle than the third cycle (1)
abnormal QRS in second cycle (e.g. extended peak or lack of T phase) (1)
second cardiac cycle closer to the first cycle than the third cycle (1)
abnormal QRS in second cycle (e.g. extended peak or lack of T phase) (1)
24
New cards
![The most obvious feature of tachycardia is an increased heart rate.
Using the information shown, what are other key features of tachycardia? \[2\]](https://knowt-user-attachments.s3.amazonaws.com/aaf3820f59f84ef3a55619fbe3673d98.jpeg)
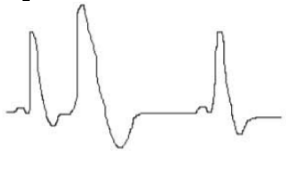
The most obvious feature of tachycardia is an increased heart rate.
Using the information shown, what are other key features of tachycardia? \[2\]
Using the information shown, what are other key features of tachycardia? \[2\]
lower (Q)R(S) peak (1)
P and T equal in height (1)
width of T wave greater (1)
P and T equal in height (1)
width of T wave greater (1)