Chapter 12: Aquatic and Terrestrial Pollution
- Pollution is a major problem that has been caused by humans and impacts ecosystems as well as human health. While we have laws that have helped in the United States, there are global concerns for the animals and plants on our planet from the pollution that we have created.
- Human activities, including the use of resources, have physical, chemical, and biological consequences for ecosystems.
- Pollutants can have both direct and indirect impacts on the health of organisms, including humans.
Key Terms
- Point source: A pollutant that you can see and point to. Usually a single source.
- Nonpoint source: A pollutant that comes from many sources such as pollution from cars in a city. You can’t point to one particular place or thing.
- Dead zones: Formed in the ocean where there is low oxygen (hypoxic) caused by too many nutrients coming from the land.
- Oxygen sag curve: A graph of discharged pollutant and the distance from the discharge. It is usually sewage pollution but can be other things.
- Endocrine disruptors: Chemicals that can mimic hormones in organisms and can cause birth defects and have been linked to developmental, reproductive, neural, immune, and other problems in animals.
- Wetland: Land consisting of marshes, swamps, or bogs; saturated land.
- Eutrophication: A body of water that has so many nutrients (fertilizers like nitrogen and phosphorus) that have run off from the land that the nutrients have “fertilized” the algae that live in the water.
- Hypoxic: A body of water with little to no oxygen in the water.
- Oligotrophic: A body of water with normal to low algae levels, high amounts of oxygen, and very few nutrients.
- Thermal pollution: Occurs when warm water is pumped into a lake or river, lowering the oxygen levels and harming biodiversity.
- Persistent organic pollutants: do not break down in the environment very quickly and can build up in the tissues and fat of animals.
- Bioaccumulation: POPs, like the pesticide DDT, can accumulate in the fatty tissues of animals; this is referred to as bioaccumulation.
- Biomagnification: When animals eat other animals and the prey have POPs that have bioaccumulated in their tissues, the POPs can magnify up the food chain. This biomagnification occurs because top predators eat many different prey.
- E-waste: Electronic waste like TVs, computers, phones, etc.
- Sanitary municipal landfill: Where solid waste from homes, businesses, and more is stored. It has a clay or plastic liner, leachate detection systems, a way for the gas to be collected or burned, and a way to make sure storm water doesn’t enter the landfill.
- Recycling: Taking solid waste and turning it into something new rather than throwing it away.
- Composting: Taking food, yard, or other organic waste and letting it decompose to form good soil.
- Primary sewage treatment: The first stage of sewage treatment in which the sewage is filtered in grates and screens for items that are not liquid. In addition, the sewage is slowed down so things like eggshells and coffee grounds that also are not liquid can sink to the bottom and be disposed of in a landfill.
- Secondary sewage treatment: The second stage of sewage treatment where lots of air is added so the bacteria found in the sewage can begin to consume the waste and break it down into carbon dioxide and inorganic sludge. The sludge sinks to the bottom of the tank and is disposed of as well.
- Tertiary sewage treatment: The stage of sewage treatment where either chemicals like chlorine and ozone gas or UV light kills any remaining bacteria. Then the water is released to a river or lake.
- Lethal Dose 50%: A term used in toxicology to indicate the amount of a toxin that kills 50 percent of the organisms that are being tested.
- Dose-response curve: A curve plotting the relationship between the dose of a drug administered and its pharmacological effect. This is usually graphed with the dose on the x-axis and the effect on the y-axis.
Sources of Pollution
- Point source is pollution you can point to and say, “There it is.”
- For example, a pipe that is dumping waste into a river.
- On the flip side is nonpoint source pollution. You can’t point to any particular thing, like cars on the road. You can’t point with your finger to all the cars on the road, or farmers spraying pesticide on all the crops in an area.
Human Impacts on Ecosystems
- Organisms have specific ranges of tolerance that they can live within, known as a species range of tolerance.
- If you go outside without any protection in below-freezing weather, you could survive for a while but pretty quickly you would begin to shiver, get frostbite, and if you couldn’t protect yourself, you might even die from the cold.
- Other organisms have similar ranges of tolerance and humans are putting stresses, particularly pollutant stresses, on them.
- That can have many different impacts, depending on the organism and the pollutant. For example, many aquatic organisms would die if the salinity were to exceed the species range of tolerance.
- One example is coral reefs. Corals are very delicate animals that live in shallow, warm waters where they can get lots of sunlight and food.
- When corals die they turn white because their exoskeletons are white and the coral animal, which can be many beautiful colors, is no longer alive.
- Humans are doing harm to corals through global climate change, which has caused water temperatures to rise past the range of tolerance for coral animals to live.
- We are also causing erosion on the land, which runs off into the water and clouds the water so the coral animals can’t get sunlight.
- There are also fishing techniques that are harming the corals when fisherman drag nets across them or drop anchors down on top of the coral reefs.
- Oil spills are another way humans are harming the oceans.
- Oil that spills from drilling platforms, pipes, and ships can cause damage to animals that live on the surface of the water such as birds and mammals, where the oil gets in their feathers or fur and they lose their ability to fly or stay warm.
- Some oil components sink to the ocean floor where they can do damage to organisms like oysters and clams that live on the ocean floor.
- In addition, some of the oil might end up on the beach or in the estuaries and cause damage to organisms that live there.
- Dead zones are being formed in the ocean where there is low oxygen (hypoxic) caused by too many nutrients coming from the land.
- For example, the Gulf of Mexico has a huge “dead zone” that varies in size but can be 6,000 to 8,000 square miles large.
- This is because of the fertilizers that are coming from the Mississippi River watershed. The map in Figure 12.1 shows the Mississippi River watershed.
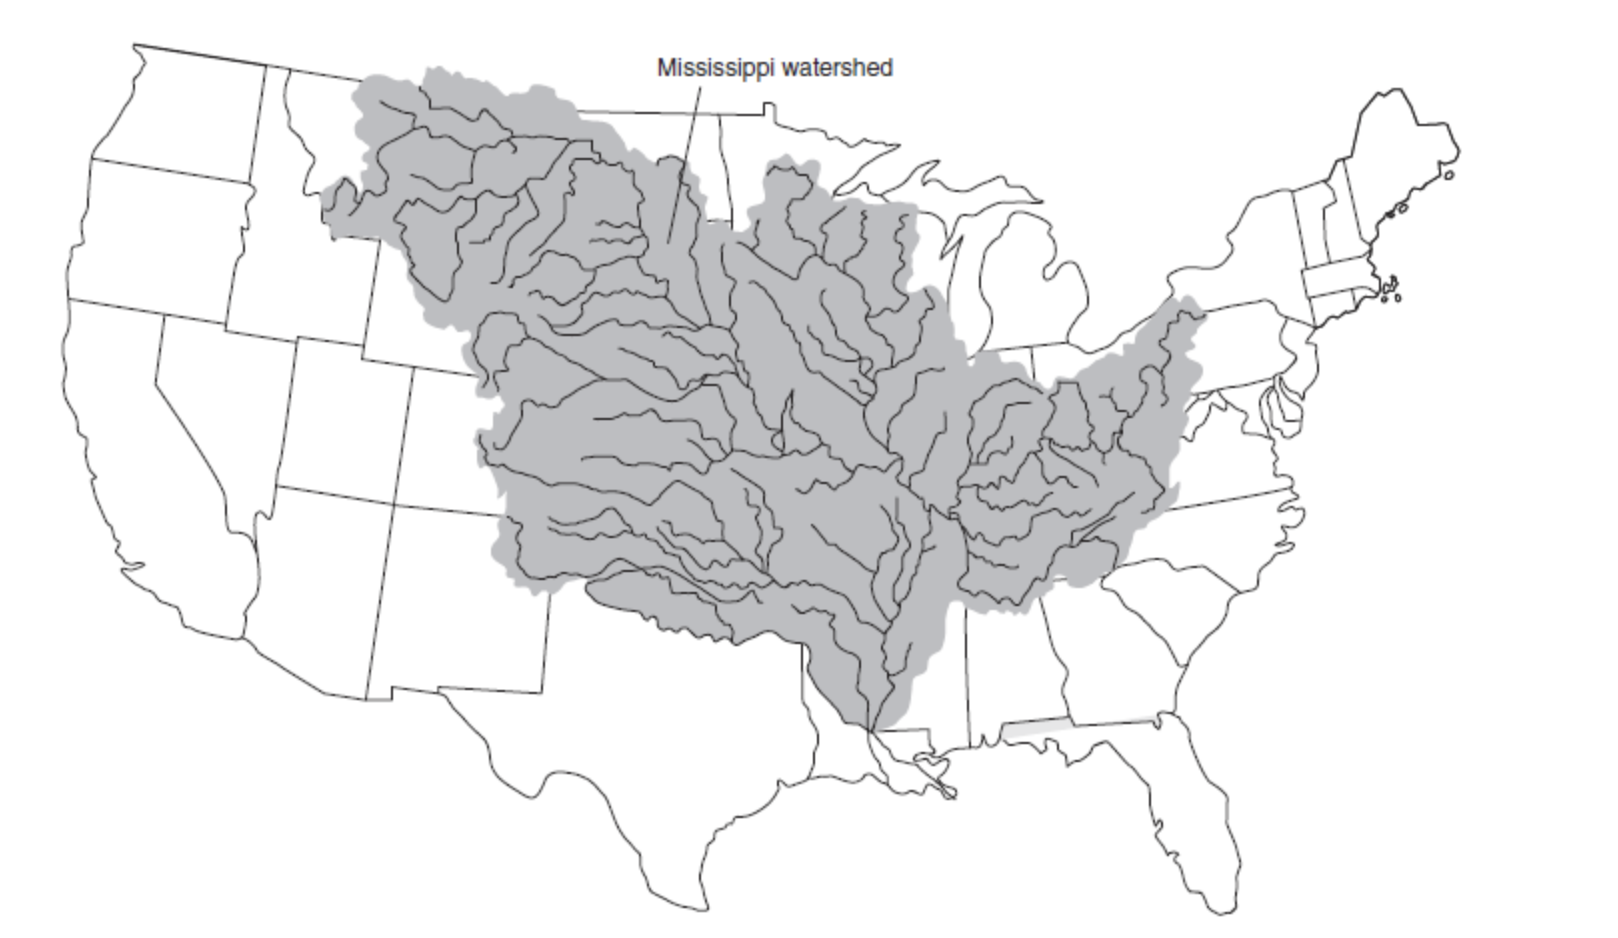
- Since a lot of the area in the watershed is farmland and very dense urban populations that use a lot of fertilizer, this amount adds up to millions of tons of nitrogen and phosphorus fertilizers in the Gulf.
- The Gulf of Mexico is just one example; there are ocean dead zones all over the world.
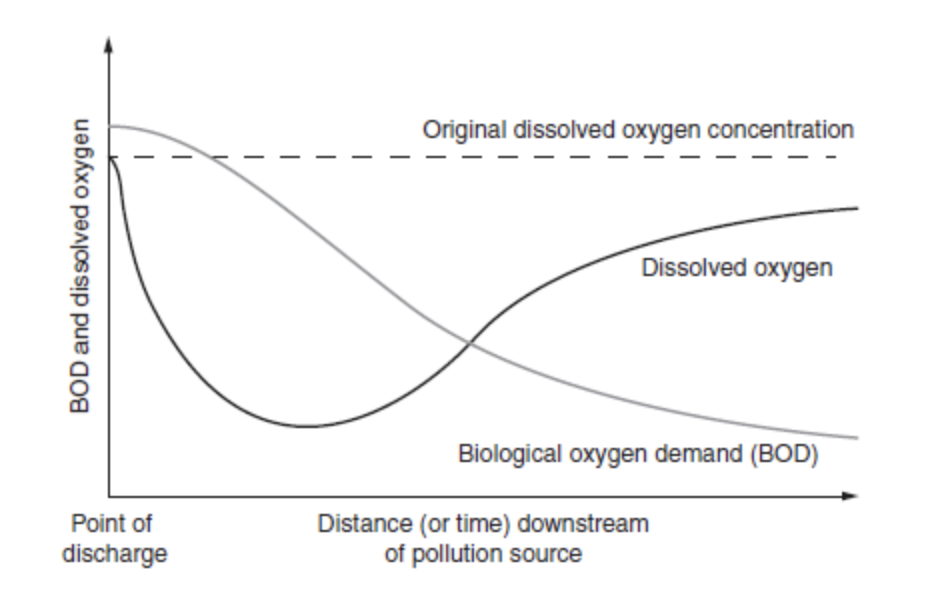
- An oxygen sag curve is a graph of discharged pollutant and the distance from the discharge.
- It is usually sewage pollution but can be other things.
- Figure 12.2 shows a graphical view of a river. The point of discharge is where the sewage is being dumped into the river.
- The dissolved oxygen begins to drop because sewage contains millions of organisms, like fungi and bacteria, that need oxygen.
- This increases the biological oxygen demand (BOD) on the oxygen in the river and lowers the amount of dissolved oxygen.
- Usually there are very few organisms that can live in the area where the dissolved oxygen is at the lowest.
- However, since this is a river and the pollutant will eventually get diluted, the dissolved oxygen goes up again as you get farther downstream from the pollutant.
- One great way to remember this is “dilution is the solution to pollution.” This helps you remember that time and space disperse pollutants!
- Other things that can harm aquatic ecosystems are litter, heavy metals from industry, and mercury that is released into the air from coal-burning power plant smokestacks, among other sources.
- The bacteria in the water can take the mercury and convert it to an extremely toxic form called methylmercury.
- Another concern with mercury is Minamata disease, which is a neurological syndrome caused by severe mercury poisoning.
Endocrine disruptors
- Endocrine disruptors are chemicals that can mimic hormones in organisms; they can come from a variety of things, like pesticides, food, and pharmaceuticals.
- These can cause birth defects and have been linked to developmental, reproductive, neural, immune, and other problems in animals.
- The endocrine disruptor can block the receptor protein so that the cell can’t receive a hormone signal. This can also lead to fertility problems.
Human Impacts on Wetlands and Mangroves
- Swamps, marshes, and bogs are the three main types of wetlands that have a huge ecological importance.
- They do things like clean the water naturally, protect from floods, and provide habitats to many plants and animals.
- This ecosystem service helps humans and has ecological importance as well for animals.
- Mangroves are trees and shrubs found near the coastal zone that protect the coast from erosion and flooding and provide habitat to many organisms.
- These are being harmed by humans when we drain and build on the areas and pollute with trash and chemical waste.
Eutrophication
- Eutrophication occurs when a body of water has so many nutrients (fertilizers like nitrogen and phosphorus) that have run off from the land that the nutrients “fertilize” the algae that live in the water.
- This comes from agriculture runoff, mainly from fertilizers and waste water runoff from concentrated animal feeding operations (CAFOs).
- This can cause the water to become so thick and green with algae that no light can penetrate it. The water can literally look like pea soup.
- Then, when the algae die, microbes like bacteria and fungi that live in the water eat the algae and in doing so take up a lot of oxygen.
- As with an oxygen sag curve, when there isn’t enough oxygen, it results in large die-offs of fish and other aquatic organisms that need to oxygen to survive. When a body of water has little to no oxygen it is known as hypoxic.
- On the flip side, we have waters that have very few nutrients in them. These are known as oligotrophic(oligo meaning “few”) and they have normal-to-low algae levels, high amounts of oxygen, and very few nutrients. The water is usually very clear and often very deep.
Thermal Pollution
- Thermal pollution is often from a nuclear power plant where large amounts of heated water are being dumped into a body of water.
- The heated water doesn’t have to have any pollutants in it, but just being warm can cause problems.
- This is because warm water can’t hold as much oxygen as cold water. The oxygen diffuses out of the water and into the air.
- If an organism such as fish that need dissolved oxygen in the water can’t get it, they might die. In addition, the higher temperatures may exceed an organism’s range of temperature tolerance.
Persistent Organic Pollutants (POPs)
- There are 12 key persistent organic pollutants (POPs) that were targeted in the 2001 Stockholm Convention to be reduced or eliminated.
- You are probably most familiar with DDT (dichlorodiphenyltrichloroethane), a synthetic organic chemical used as an insecticide, and PCBs (polychlorinated biphenyls), used as dielectric and coolant fluids in electrical equipment.
- POPs do not break down in the environment very quickly and can build up in the tissues and the fat of animals. This accumulation of POPs in an organism’s tissues can be toxic.
- In addition, because they are persistent (they don’t break down quickly), because animals migrate long distances, and because these chemicals can travel in wind and water very far distances, we have POPs in almost all parts of our planet.
Bioaccumulation and Biomagnification
- As mentioned above, chemicals like the pesticide DDT can build up in the fatty tissues of animals because they don’t break down but accumulate there. This is referred to as bioaccumulation.
- In addition, because animals eat other animals, these chemicals can magnify up the food chain; this is referred to as biomagnification.
- It occurs because top predators eat many different prey; each prey may have eaten many different organisms as well. Figure 12.3 is an illustration of how things magnify up the food chain.
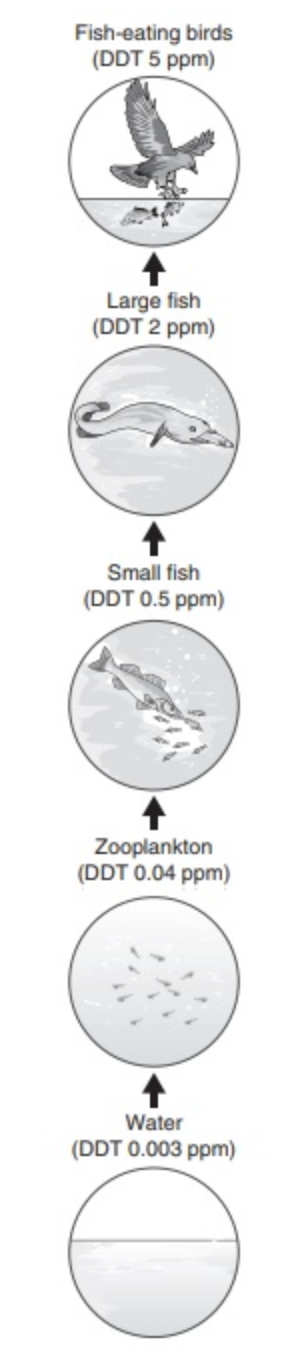
- As you can see in the illustration, the water has only a small amount of DDT, but as the zooplankton pick this up it gets a little more, then because the small fish eat many zooplankton, it gets even more.
- Then, when large fish eat many small fish, the amount of DDT greatly increases and finally when we get to the birds, it is at the highest.
- This amount of DDT is now high enough to cause major problems to the birds that might not have happened to the organisms down the food chain.
- Persistent chemicals like DDT, PCBs, and mercury can have environmental and human health effects.
- For example, when DDT made its way up to predatory birds like bald eagles, the chemical interfered with the ability of the bird to make strong eggshells.
- The shells were so soft that they often broke during incubation and the baby birds died.
- It went on for many generations with the bald eagle population, and we had entire species on the brink of extinction due to this problem.
- In humans, persistent chemicals can damage the reproductive, nervous, and circulatory systems.
Solid Waste Disposal
- Humans generate large amounts of solid waste.
- This can be normal household trash; e-waste from electronics like computers, televisions, and cell phones; or waste from industrial and agricultural processes.
Most waste in the United States is sent to a landfill.
- A landfill must be carefully maintained and monitored or the waste can leach out and contaminate groundwater.
- As the waste decomposes it can produce methane and carbon dioxide, which can lead to climate change.
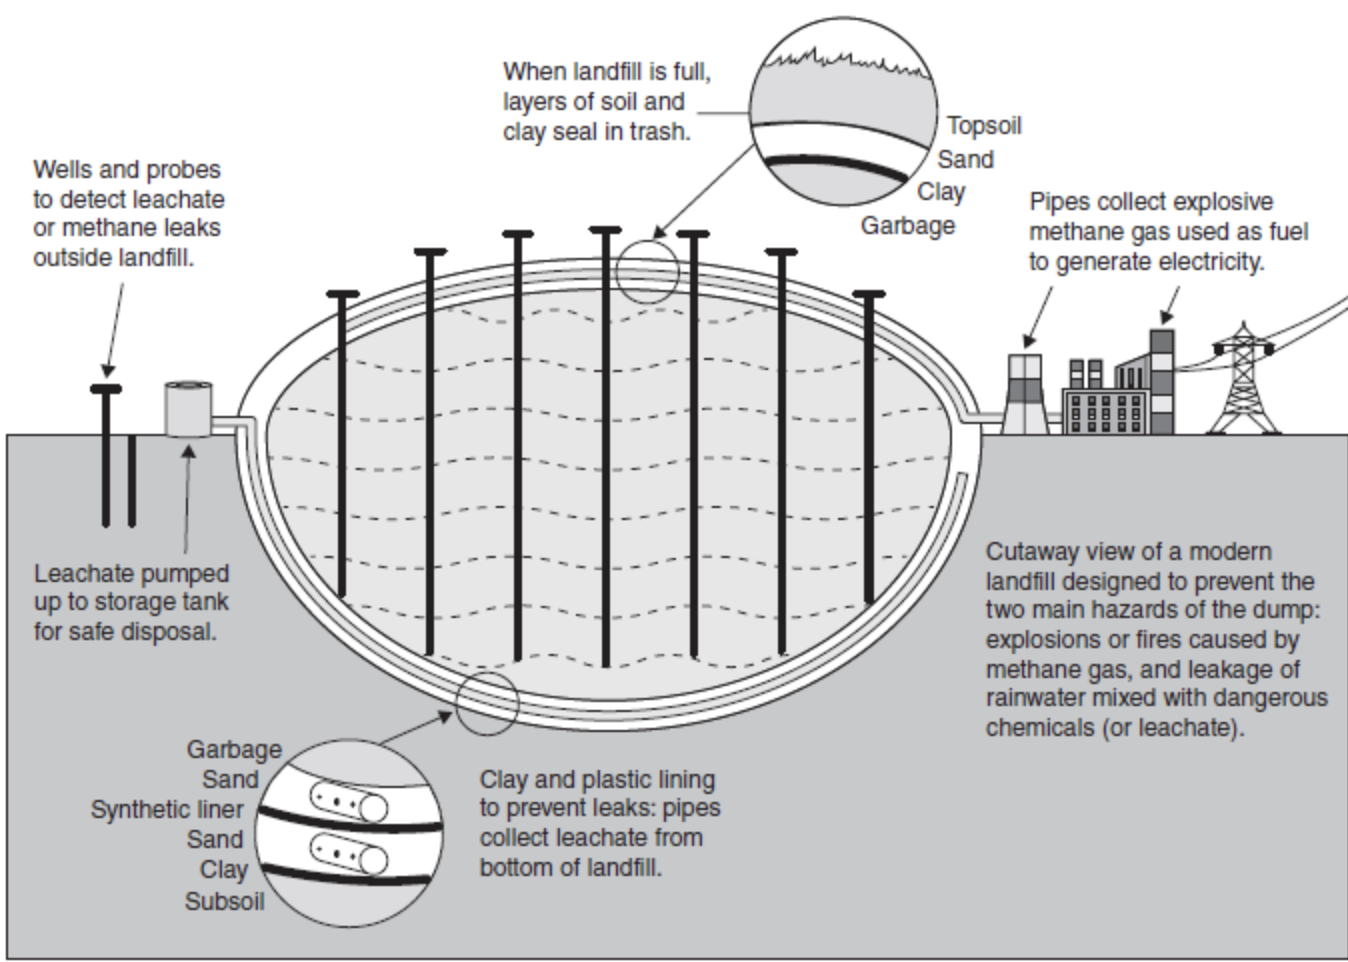
- Sanitary municipal landfills have been designed to control the disposal of solid waste so that our water and air is protected. Look at Figure 12.4.
- There is a clay and plastic lining to prevent leaks, a leachate pump to collect the liquid that passed through the trash, and, in addition, there are pipes to collect the methane gases produced as a result of decomposition.
- The methane is either used to create electricity or burned off safely.
- There are also ways to collect large amounts of storm water so it doesn’t end up in the landfill.
- How quickly the trash decomposes depends on: composition of trash, landfill location, temperature, & amount of rainfall.
- In addition to putting trash into a landfill, we can also burn the trash at high temperatures. It is important that this is done carefully as air pollutants can be released.
- But, as a result of burning, the volume of the trash is greatly reduced and the concern of water pollution goes way down.
- Other concerns about solid waste are people illegally dumping it into our oceans and people putting things into landfills that are not allowed.
Waste Reduction Methods
- We know that solid waste is going to be a problem because of the numbers of people on Earth. However, there are other ways to reduce the amount of waste or to recycle the waste.
- Recycling is taking something like plastic and turning it into something new. This does a few things: first, it means that new oil doesn’t have to be pumped to make more plastic, and it also means that the plastic doesn’t end up in the landfill or the ocean.
- However, recycling can be expensive and require a lot of energy.
- Another way to reduce the waste that is generated is to compost it.
- Composting works well for food waste, paper waste, and yard trimmings.
- Rather than throwing these products into the landfill, we can put them in composting piles, and after they decompose, we can use it for fertilizer.
- Some people don’t like composting because it can attract rodents and can have a pungent odor.
- However, it produces some of the best fertilizer and is chemical free.
- Computers, TVs, cell phones, and other e-waste can also be recycled for their parts and turned into new items. Like the example above, this avoids having to mine new metals and prevents the items from ending up in a landfill.
- Another way to lessen the impact of landfills can be done after they are full. If we cap them and plant trees and other plants to restore habitats or use as city parks, we can help lower the impact they have on the environment.
- Finally, the methane and CO2 gas from a landfill can be captured. Then it can be burned to heat water, produce steam, and turn a turbine to generate electrical energy.
Sewage Treatment
- The first step is known as primary treatment. This is where the sewage is filtered with grates and screens for large solid items that are not liquid.
- In addition, grit chambers allow the sewage to slow down so things like ground-up eggshells and coffee grounds that also are not liquid can sink to the floor and be disposed of in a landfill.
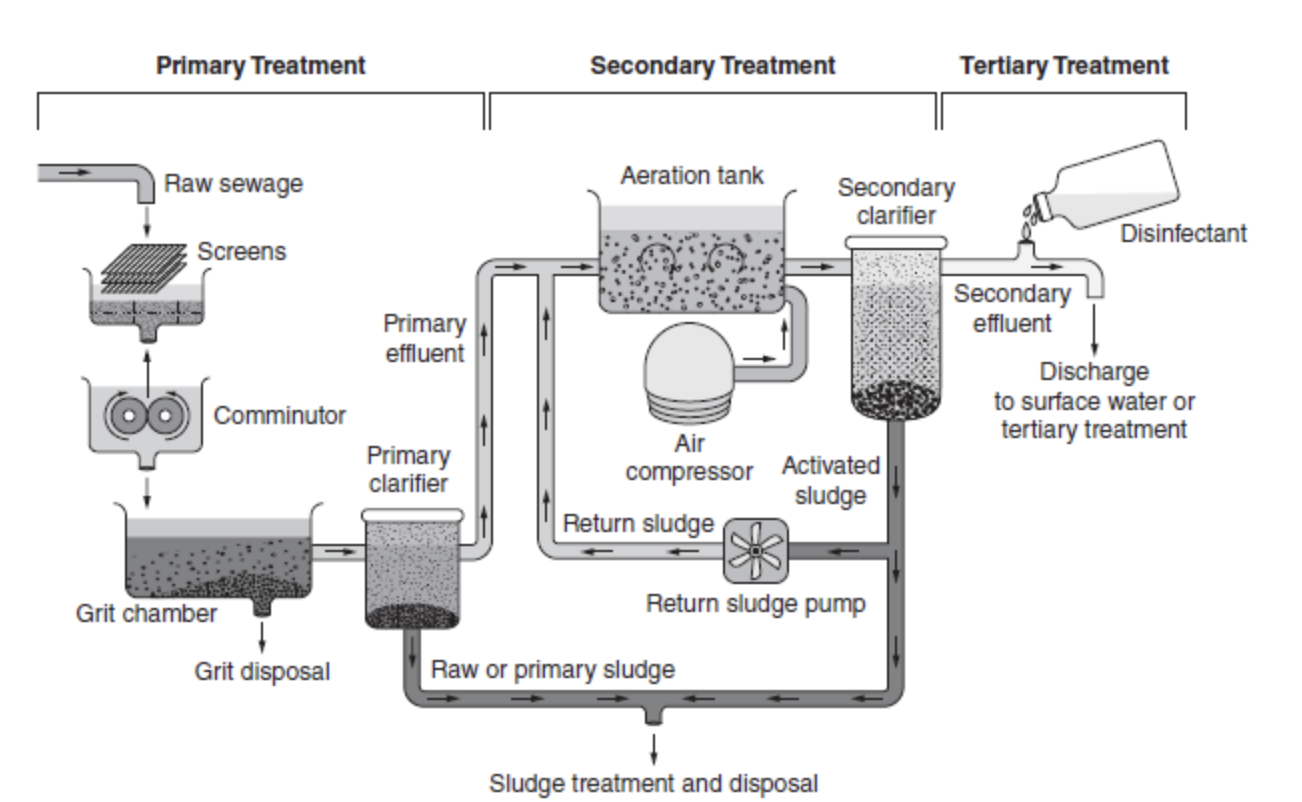
- Now, only liquid waste is going to move into the next stage, secondary treatment.
- The bacteria found in the sewage is given lots of air so it can begin to consume the waste and break it down into carbon dioxide and inorganic sludge.
- The sludge sinks to the bottom of the tank and is disposed of as well.
- Finally, we move to the last stage known as tertiary treatment, where either chemicals like chlorine and ozone gas or water disinfectants like UV light kill any bacteria that remain.
- Then the water is released to a river or lake.
Lethal Dose 50% (LD50)
- Lethal Dose 50% is a term used in toxicology to say the amount of a toxin that kills 50 percent of the organisms that are being tested. This can be any animal but usually refers to test rats and mice in a laboratory.
- This concept is useful for toxicology because it can help us determine the relative short-term toxicity of a substance. For example, the LD50 of nicotine is 50 milligrams per kilogram for a rat; for table salt it is 3,000 milligrams per kilogram for a rat.
- This is commonly used to measure the toxicity of a chemical’s active ingredient and is a way to measure the short-term poisoning potential of a substance.
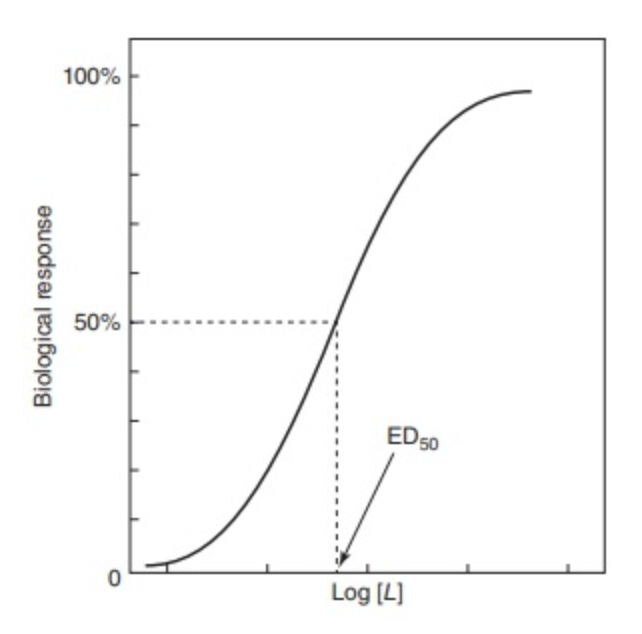
Dose-Response Curve
- A dose-response is curve is usually shaped like the letter “S.” This is because usually small doses are not toxic and as you increase the dose, the individuals show a response to that dose.
- Look at the example of a dose-response curve in Figure 12.6; the sharp increase in the graph of the line shows that there are increasingly higher risks of toxic response as the dose amount increases until almost 100 percent of the organisms are experiencing toxicity.
Pollution and Human Health
- Humans are exposed to many different chemicals every day. This can be in what we eat, what we breathe, where we live, and so on.
- Therefore, it is hard to directly say if a particular chemical causes a particular human health issue. However, there are a few that can be significantly linked to particular things.
- For example, dysentery is an infection of the intestines resulting in severe diarrhea with blood and mucus in the feces.
- This comes from untreated sewage in streams and rivers that become drinking water or food contaminates.
- Another is asbestos, a building material that was used because it was flame resistant. That seemed like a good idea—build homes that couldn’t catch on fire!
- What we didn’t know at the time was that when these panels, floor boards, or ceiling tiles began to break down, tiny fibers would be released into the air that people breathed in.
- This led to various serious lung conditions such as lung cancer.
- Also, as tropospheric ozone from the chemical reaction between NOx and VOCs is formed and we breathe it in we can get respiratory problems like asthma, emphysema, and COPD.
Pathogens and Infectious Disease
- A pathogen is a bacterium, virus, or other microorganism that can cause disease.
- This disease can be transmitted from human to human or animal to human.
- You could be asked about a number of pathogens and how they are transferred.
- Take a look at the table below with the pathogens you need to know:
- As our climate is changing and the Earth is getting warmer, diseases from insects like West Nile and malaria are spreading to areas that they were not in before.
- In addition, many of these diseases are spread in areas that are poor and lack sanitation or clean water.
| PATHOGEN | INFORMATION ABOUT |
|---|---|
| Plague | A bacterial infection transmitted by fleas, famous for killing millions in Europe in the Middle Ages. Modern antibiotics are effective in treating this. |
| Tuberculosis (TB) | A bacterial infection that usually attacks the lungs and is spread from one person to another. TB can be treated by taking several drugs for six to nine months. |
| Malaria | A parasitic disease transmitted by mosquitos. People get fever, chills, and flu-like illness. However, if left untreated it can be deadly. Nearly half a million people die each year, mostly in the African region. |
| West Nile virus | A mosquito-transmitted virus and most people show no signs or symptoms. However, fever, a mild headache, and inflammation of the spinal cord or brain can occur. |
| Severe acute respiratory syndrome (SARS) | SARS is a viral respiratory illness that was first reported in 2003 but there haven’t been any known cases since 2004. It is spread easily by coughing and sneezing, touching contaminated surfaces, skin-to-skin contact, or kissing. |
| Middle East respiratory syndrome (MERS) | A viral respiratory illness that was first reported in 2012. This causes fever, coughing, and shortness of breath. It is transferred from animal to human. |
| Zika | Zika is a virus from infected mosquitoes, sexual contact, blood transfusions, or from a pregnant woman to her fetus. There is no vaccine or medicine for Zika. It causes fever, rash, headache, and joint/muscle pain. |
| Cholera | A bacterial disease that causes severe diarrhea and dehydration and is spread in water. Rehydration and antibiotics are the treatment for this disease. |