Chapter 3: Populations
3.1: Generalists and Specialists Species
| Generalists | Specialists |
|---|---|
| Able to use a variety of environmental resources | Use specific set of resources. |
| Adaptable to a wide range of environments | Less adaptable due to specialized needs |
| Have a high level (range) of tolerance | Have a low level of tolerance |
| Have an advantage when environmental conditions change | Easily affected when environmental conditions change |
| Less likely to be extinct | More likely to become extinct |
| Example: Human | Example: Panda |
3.2: K-Selected & R-Selected Species
| r-Strategists | K-Strategists |
|---|---|
| Not endangered | Most endangered |
| Have many offspring and tend to overproduce | Have few offspring |
| Low parental care | High parental care |
| Mature rapidly | Mature slowly |
| Population size limited by density-independent limiting factors, including climate, weather, natural disasters, and requirements for growth | Density-dependent limiting factors to population growth stem from intraspecific competition and include competition, predation, parasitism, and migration |
| Short-lived | Long-lived |
| Tend to be prey | Tend to be predator and prey |
| Tend to be small | Tend to be larger |
| Type III survivor curve | Type I or II survivor curve |
| Wide fluctuations in population density | Population size stabilizes near the carrying capacity. |
| Examples: most insects, algae, bacteria, rodents, and annual plants | Examples: humans, elephants, cacti, and sharks |
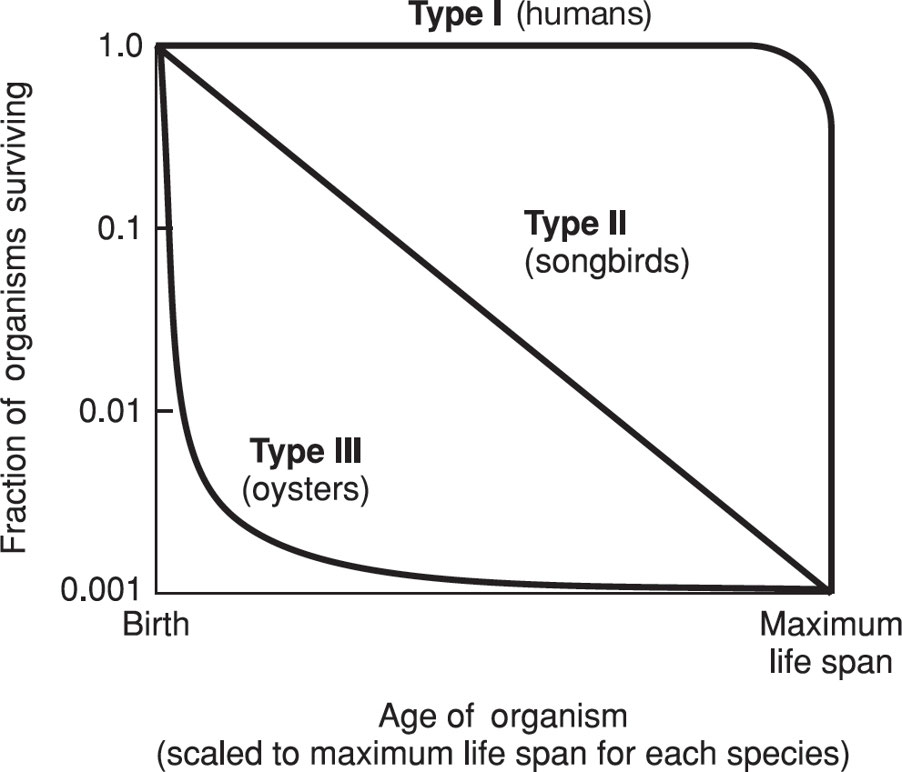
3.3: Survivorship Curve
- Survivorship curves: It show age-distribution characteristics of species, reproductive strategies, and life history.
- Reproductive success: It is measured by how many organisms are able to mature and reproduce, with each survivorship curve representing a balance between natural resource limitations and interspecific and intraspecific competition.
Survivorship Curves Table Guide
Type I - Late Loss
- Reproduction occurs fairly early in life, with most deaths occurring at the limit of biological life span.
- Low mortality at birth with a high probability of surviving to advanced age.
- Death rates decrease in younger years due to advances in prenatal care, nutrition, disease prevention, and cures, including immunization.
- Examples: humans, annual plants, sheep, and elephants.
Type II - Constant Loss
- Individuals in all age categories have fairly uniform death rates, with predation being the primary cause of death.
- Typical of organisms that reach adult stages quickly.
- Examples: rodents, perennial plants, and songbirds.
Type III - Early Loss
- Typical of species that have great numbers of offspring and reproduce for most of their lifetime.
- Death is prevalent for younger members of the species due to environmental loss and predation and declines with age.
- Examples: sea turtles, trees, internal parasites, fish, and oysters.
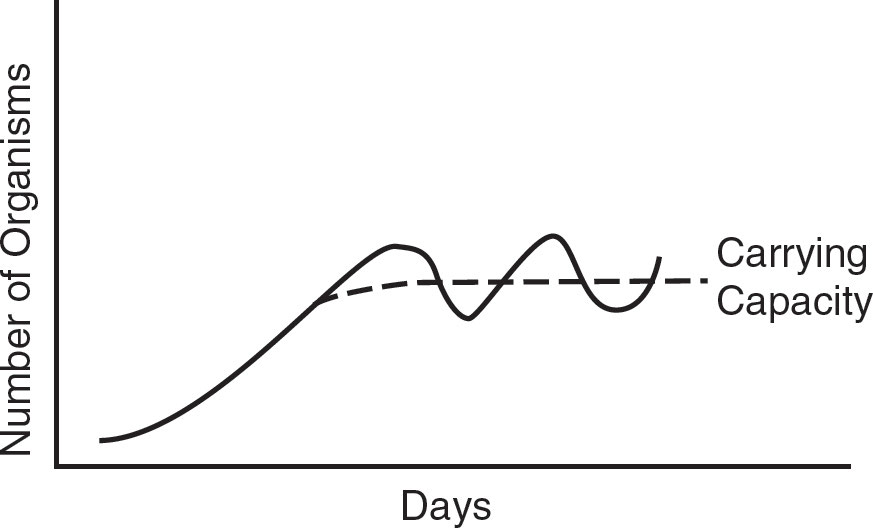
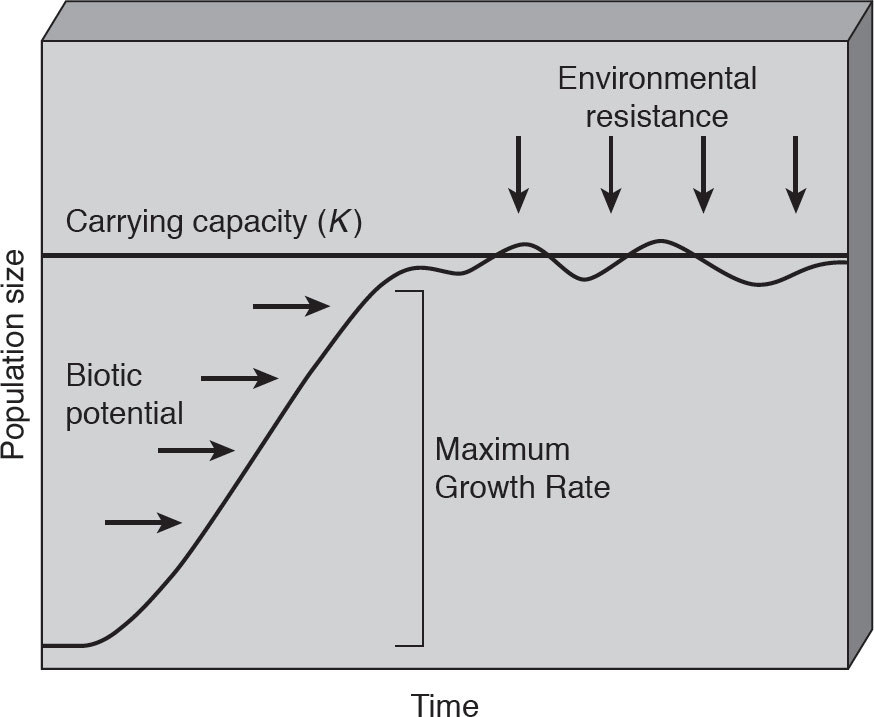
3.4: Carrying Capacity
Carrying capacity (K): It refers to the number of individuals that can be supported sustainably in a given area.
- It varies from species to species and is subject to changes over time. As an environment degrades, the carrying capacity decreases.
Factors that keep population sizes in balance with the carrying capacity are called regulating factors and include the following:
- Amount of sunlight available
- Food availability
- Nutrient levels in soil profiles
- Oxygen content in aquatic ecosystems
- Space
3.5: Population Growth and Resource Availability
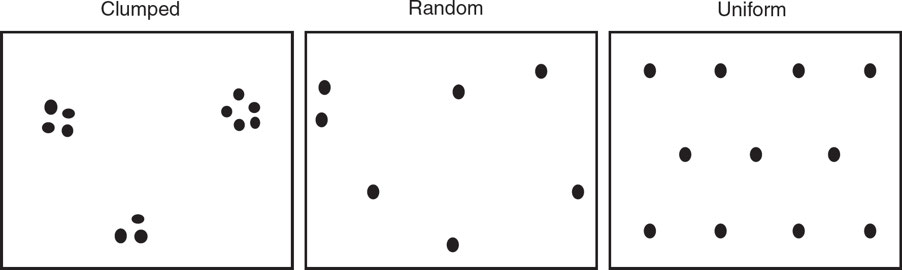
Population Dispersal Patterns
Population dispersal pattern: It is how individuals or species of animal become distributed in different spaces over certain periods of time.
Clumped: Some areas within a habitat are dense with organisms, while other areas contain few members.
- Found in environments with “patch” resources.
- Living in groups provides advantages and is common for animals.
- Examples include the following:
- Animals living in social families.
- Animals that feel safer living in groups
- Animals that serve as prey
- Animals that work together to trap or corner prey.
- Animals with inability of their offspring to independently move from their habitat.
Random: Occurs in habitats where environmental conditions and resources are consistent.
- There is little interaction among members of the population.
- Individuals are distributed randomly; occurs with dandelions and other plants that have wind-dispersed seeds.
Uniform: Space is maximized between individuals to minimize competition.
Biotic Potential
- Biotic potential: The maximum reproductive capacity of an organism under optimum environmental conditions.
- Environmental Resistance: Any factor that inhibits an increase in the number of organisms in the population.
Factors That Influence Biotic Potential
| Increase Biotic Potential | Decrease Biotic Potential |
|---|---|
| Able to adapt | Unable to adapt |
| Able to migrate | Unable to migrate |
| Adequate resistance to disease and parasites | Little or no suitable defense mechanisms against disease or parasites. |
| Favorable environmental conditions | Unfavorable environmental conditions |
| Few competitors | Too many competitors |
| Generalized niche | Specialized niche |
| High birth rate | Low birth rate |
| Satisfactory habitat | Unsatisfactory habitat |
| Sufficient food supply | Sufficient food supply |
| Suitable predatory defense mechanism(s) | Unsuitable predatory defense mechanism(s) |
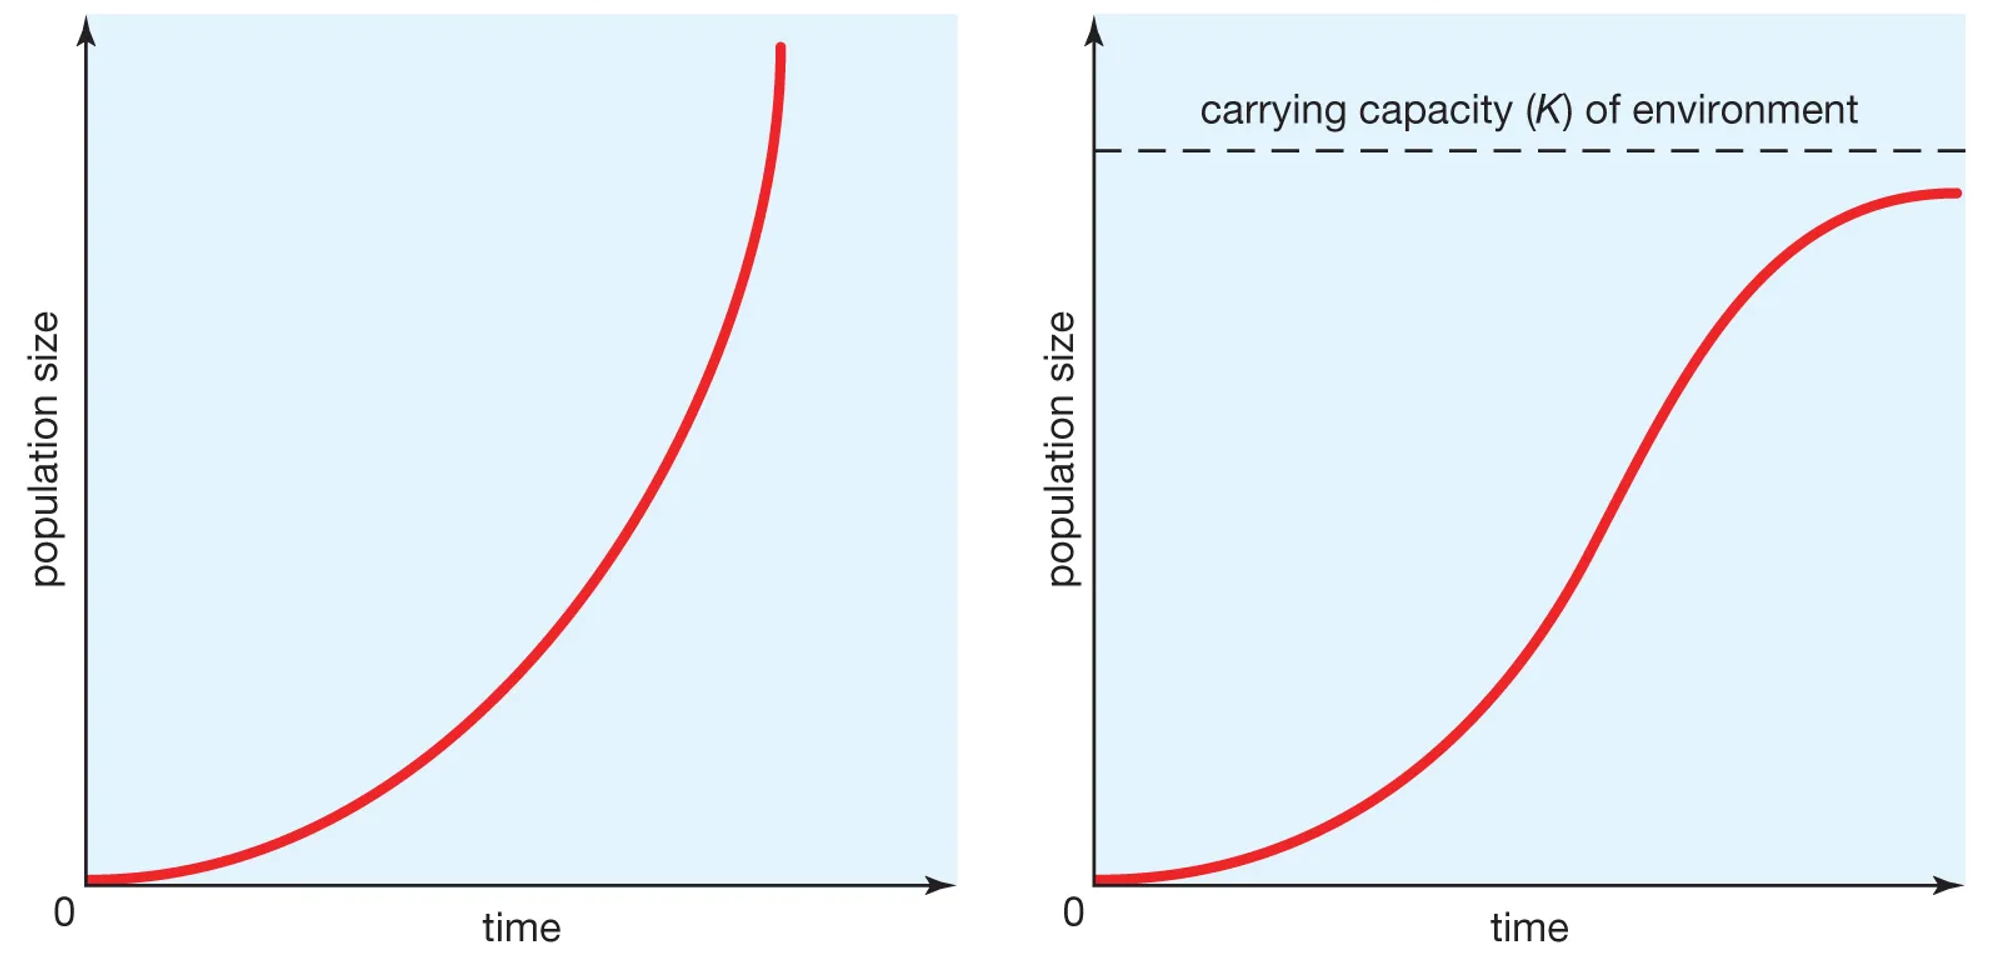
J-Curves and S-Curves
J-Curve: It represents a population growth occurs in a new environment when the population density of an organism increases rapidly in an exponential or logarithmic form, but then stops abruptly as environmental resistance or another factor suddenly impacts the population growth.
- This type of population growth rate is known as “density dependent,”a the regulation of the growth rate is not tied to the population density until the resources are exhausted and the population growth crashes.
S-Curve: It occurs when, in a new environment, the population density of an organism initially increases slowly but then stabilizes due to the finite amount of resources available.
- This slowing of the growth rate reflects the increasing environmental resistance, which becomes proportionately more significant at higher population densities.
- This type of population growth is termed “density dependent” since the growth rate depends on the number of organisms in the population.
- This point of stabilization is known as the carrying capacity of the environment, and it denotes the point at which the upward growth curve begins to level out
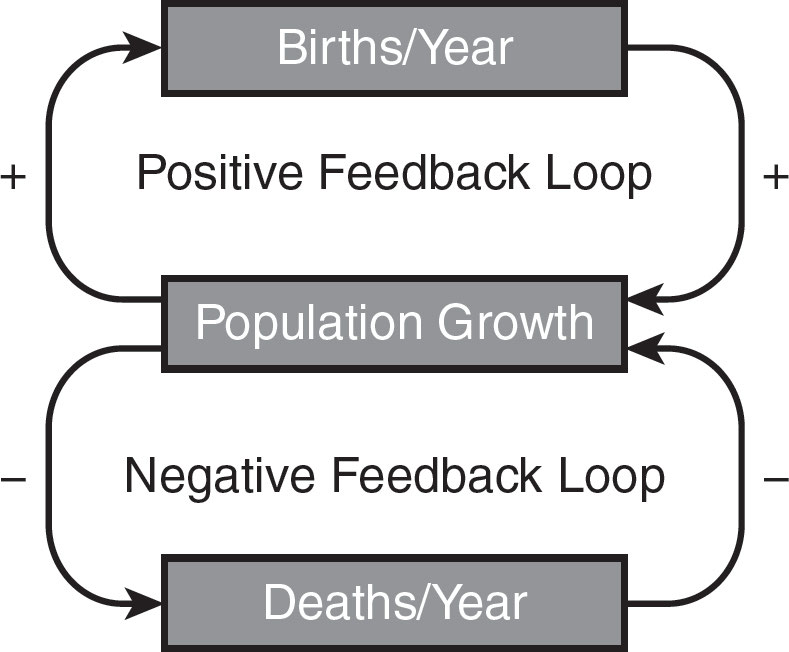
Feedback Loops
Positive feedback loops stimulate change and are responsible for sudden or rapid changes within ecosystems.
- When part of the system increases, another part of the system also changes in a way that makes the first part increase even more.
Negative feedback loops often provide stability.
- Limiting factors can cause a negative feedback loop because populations cannot exceed the ecosystem's carrying capacity.
- Predators and prey maintain population stability by keeping animal populations within the carrying capacity of their environment.
- More prey means more energy for predators, which leads to more predators and fewer prey.
Limiting Factors
- Limiting Factor: It can be any resource or environmental condition that limits the abundance, distribution, and/or growth of a population.
- Based on Liebig’s law of the minimum, even if all other factors are favorable, the one that is least favorable will dictate the growth, abundance, or distribution of the population of a species.
- Density-dependent limiting factors: These are factors whose effects on the size or growth of the population vary with the density of the population.
- Density-independent factors: These are factors that limit the size of a population, and their effects are not dependent on the number of individuals in the population.
Rule of 70
- Rule of 70: It helps to explain the time periods involved in exponential population growth occurring at a constant rate.
- Doubling time: It is the amount of time it takes for a population to double in size.
- To find how long it takes for a population to double in size we can use the following formula: dt= 70/r
- Key points to remember about population doubling times are as follows:
- Populations cannot double forever.
- The growth rate varies considerably among organisms.
- The larger the growth rate (r), the faster the doubling time.
Important Population Formulas
Birth Rate (%) = [(total births/total population)] × 100
Crude Birth Rate (CBR) = [(b ÷ p) × 1,000]
Death Rate (%) = [(total deaths/total population)]× 100
Crude Death Rate (CDR) = [(d ÷ p) × 1,000]
Doubling Time = 70/% growth rate
Emigration = number leaving a population
Global Population Growth Rate (%) = [(CBR – CDR)]/10
Immigration = number entering a population
National Population Growth Rate (%) = [(CBR + immigration) – (CDR + emigration)]/10
Percent Rate of Change = [(new # - old #)/old #] × 100
Population Density = total population size/total area
Population Growth Rate (%) =

Impacts of Population Growth
- Biodiversity
- Biodiversity sustains agriculture and medicine.
- Yet, two-thirds of the world's species are in decline due to human activity.
- Coastlines and Oceans
- High population densities and urban development stress half of coastal ecosystems.
- Ocean fisheries are overexploited, estuaries (sea nurseries) are being drained and filled in due to population growth, and fish catches are down.
- Forests
- Nearly half of the world's original forest cover has been lost, and 16 million hectares are cut, bulldozed, or burned annually.
- Forests sustain ecosystems and contribute $400 billion to the global economy.
- However, demand for forest products may exceed sustainable consumption by 25%.
- Food Supply and Malnutrition
- 25% of the world is malnourished.
- In 64 of 105 developing countries, especially in Africa, Asia, and parts of Latin America, population growth has outpaced food supply.
- Population pressures have degraded two billion hectares of arable land—the size of Canada and the US combined.
- Freshwater
- The supply of freshwater is finite.
- The demand is soaring as the population grows and per-capita use rises.
- Global Climate Change
- Earth’s surface is warming due to greenhouse gas emissions, largely from burning fossil fuels.
- If the global temperature rises as predicted, sea levels will rise by several meters, causing widespread flooding, droughts, and agricultural disruption.
- Public Health
- Over 12 million people die each year from dirty water and poor sanitation, mostly in developing nations.
- Air pollution kills nearly three million more.
- Heavy metals and other contaminants also cause widespread health problems.
- Tobacco-related diseases kill more people than AIDS, tuberculosis, road accidents, murder, and suicide combined.
- Unequal distribution of wealth and governmental priorities
- Due to government priorities, financial constraints, and special interest groups, rapid population growth can make it politically difficult for countries to raise living standards and protect the environment.
- As a country's population grows, wealth must be redistributed, lowering GDP per capita.
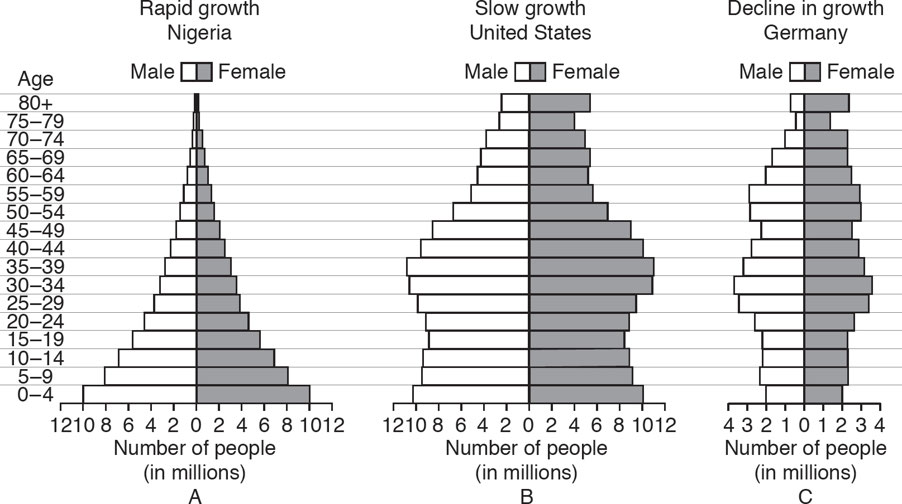
3.6: Age-Structure Diagrams
Age-structure diagrams: These are determined by birth rate, generation time, death rate, and sex ratios.
Pyramid-shaped age-structure diagram: It indicates that the population has %%high birth rates and the majority of the population is in the reproductive age group%%
Bell shape age-structure diagram: It indicates that %%pre-reproductive and reproductive age groups are more nearly equal%%, with the post-reproductive group being smallest due to mortality.
- This is characteristic of stable populations.
Urn-Shaped age-structure diagram: It indicates that the %%post-reproductive group is largest and the pre-reproductive group is smallest,%% a result of the birth rate’s falling below the death rate, and is characteristic of declining populations
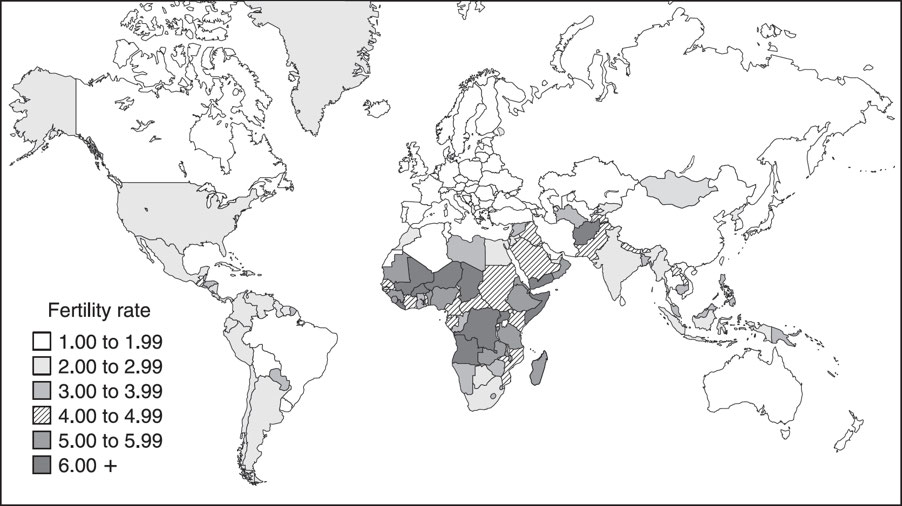
3.7: Total Fertility Rate
- Total fertility rate (TFR): The average number of children that each woman will have during her lifetime.
- Declines in fertility rates can be attributed to several factors, as follows:
- As developing countries transition to developed countries, there is greater access to primary healthcare and family-planning services.
- Female educational opportunities are increasing.
- Many “millennials” are postponing marriage until their careers are established.
- More individuals desire to increase their standard of living by having fewer children.
- The number of females in the workforce has increased.
- There is greater personal acceptance and government encouragement of contraception.
- Urbanization results in a higher cost of living and reduces the need for extra children to work on farms.
Worldwide Total Fertility Rate
| Country | TFR |
|---|---|
| Niger | 7.63 |
| India | 2.43 |
| Mexico | 2.24 |
| USA | 1.87 |
| Russia | 1.61 |
| China | 1.60 |
| Japan | 1.41 |
| World Average | 2.39 |
3.8: Human Population Dynamics
- Several factors have reduced human death rates, as follows:
- Increased food and more efficient distribution, resulting in better nutrition
- Improvements in medical and public health programs, resulting in better access to anesthetics, antibiotics, and vaccinations
- Improvements in sanitation and personal hygiene
- Improvements in the safety of water supplies
- The human population has had four surges in growth as a result of the following:
- The use of tools (3.5 million years ago)
- The discovery of fire (1.5 million years ago)
- The first agricultural revolution, which allowed the change from hunting and gathering to crop growing (~ 10,000 B.C.E.)
- The industrial and medical revolutions (within the last ~ 200 years).
Human Population Growth
- Before Agricultural Revolution
- ~ 1 million to 3 million humans.
- Hunter-gatherer lifestyle.
- Earth Wisdom: %%Natural cycles that can serve as a model for human behavior%%.
- 8000 B.C.E. to 5000 B.C.E.
- ~ 50 million humans.
- Increases due to advances in agriculture, domestication of animals, and the end of a nomadic lifestyle.
- Earth Wisdom
- 5000 B.C.E. to 1 B.C.E.
- ~ 200 million humans.
- Rate of population growth during this period was about 0.03 to 0.05%, compared with today’s growth rate of 1.3%.
- Frontier Worldview: Viewed %%undeveloped land as a hostile wilderness%% to be cleared and planted, then exploited for its resources as quickly as possible.
- 0 C.E. to 1300 C.E.
- ~ 500 million humans.
- Population rate increased during the Middle Ages because new habitats were discovered.
- Factors that reduced population growth rate during this time were famines, wars, and disease
- Frontier Worldview
- 1300 C.E. to 1650 C.E.
- ~ 600 million humans.
- Plagues reduced population growth rate.
- Up to 25% mortality rates are attributed to the plagues that reached their peak in the mid-1600s.
- 1650 C.E. to present
- Currently ~ 7.5 billion humans.
- In 1650 C.E., the growth rate was ~ 0.1%.
- Today it is ~ 1.2%.
- Healthcare, health insurance, vaccines, medical cures, preventative care, advanced drugs and antibiotics, hygiene and sanitation, agriculture and distribution, and education have increased growth.
- Planetary Management: Beliefs that as the planet’s most important species, %%we are in charge of Earth.%%
- We will not run out of resources because of our ability to develop and find new ones.
- The potential for economic growth is essentially unlimited.
- Our success depends on how well we manage Earth’s life-support systems mostly for our own benefit.
- Present to 2050 C.E.
- Estimates are as high as 9.8 billion.
- Earth Wisdom: %%Beliefs that nature exists for all Earth’s species%% and we are not in charge of Earth; resources are limited and should not be wasted.
- We should promote Earth-sustaining economic growth and learn from nature how Earth sustains itself.
3.9: Demographic Transition
- Demographic transition: It is the transition from high birth and death rates to lower birth and death rates as a country or region develops from a pre-industrial to an industrialized economic system.
- Stage 1: Pre-Industrial (High Stationary)
- Poor agricultural practices, pestilence, and living conditions make food scarce and medical care is poor.
- %%High birth rates replace high mortality%%, %%resulting in low population growth%%.
- Sub-Saharan Africa has 54% of the world's AIDS-HIV cases but only 6% of the population.
- Since 2010, drug therapy has reduced new infections by 28% and death rates by 44% in the region.
- Stage 2: Transitional (Early Expanding)
- This stage occurs after the %%start of industrialization%%.
- Hygiene, medical advances, sanitation, cleaner water, vaccinations, and higher education lower the death rate, resulting in a significant population increase.
- Population rises rapidly.
- Stage 3: Industrial (Late Expanding)
- %%Urbanization reduces economic incentives%% for large families.
- Urban families are increasingly discouraged from having large families as costs rise.
- Female education and employment lower birth rates.
- Leisure time and food are not priorities.
- Retirement safety nets reduce parents' need for more children.
- Economic pressures lower the birth rate until it approaches the death rate.
- Stage 4: Post-Industrial (Low Stationary)
- %%Population growth is zero when birth and death rates are equal%%.
- The standard of living is higher, and birth and death rates are low.
- In some countries, birth rates are lower than mortality rates, resulting in population losses.
- Stage 5: Sub-Replacement Fertility (Declining)
- Some theorists believe a fifth stage is needed to represent countries with sub-replacement fertility.
- %%Death rates exceed birth rates%% in most European and East Asian nations.
- Unless mass immigration continues, population aging and decline will occur in this stage.