4.1.5.5 - Oligopoly
1/11
There's no tags or description
Looks like no tags are added yet.
Name | Mastery | Learn | Test | Matching | Spaced | Call with Kai |
|---|
No analytics yet
Send a link to your students to track their progress
12 Terms
Characteristics of an Oligopoly
A few large firms
Somewhat high barriers to entry
Interdependent - actions of one firm provoke counter-action by others
Supernormal profit in the long run
Objectives of firms to profit-maximise
Collusive Oligopoly
Where firms agree to work together in order to improve their mutual objectives and profits - Maximise their “joint-profit'“
Tacit Collusion =
Where firms agree to work together but without any explicit or written agreement.
e.g. price leadership
Cartel =
A collusive agreement by firms usually to fix prices, regulate supply or restrict new entrants.
They are illegal
Collusive Diagram
When firms collude, we can treat the whole market as thought it is a monopoly.
Non-collusive/competitive Oligopoly
Where firms act independently of each other, act competitively by aiming to gain market share at other firms’ expense
Price wars, non-price competition
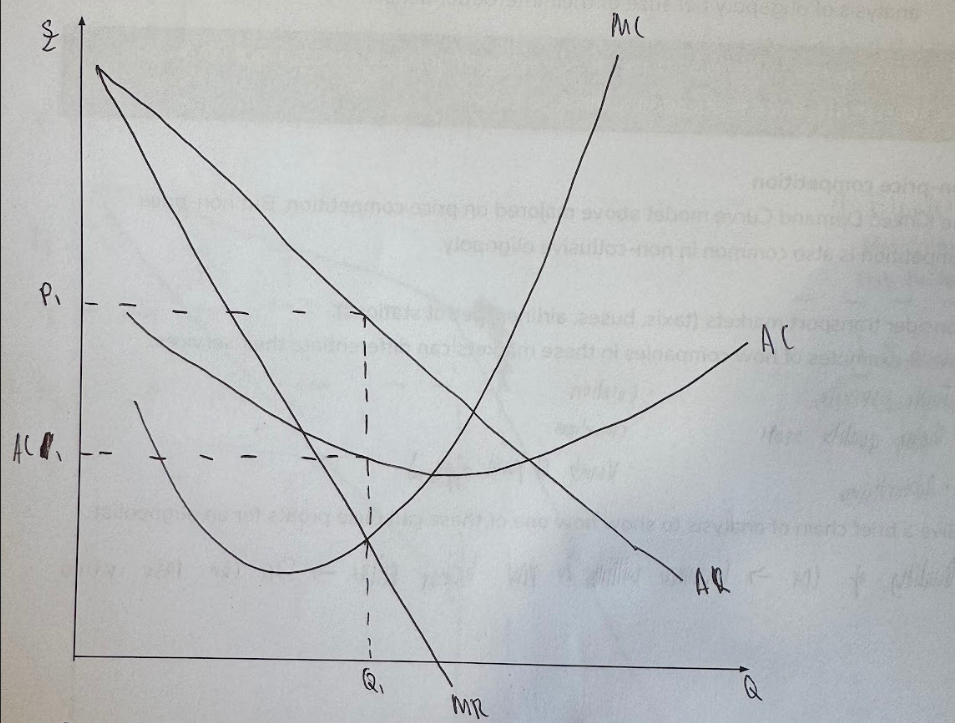
Non-Collusive Oligopoly Diagram
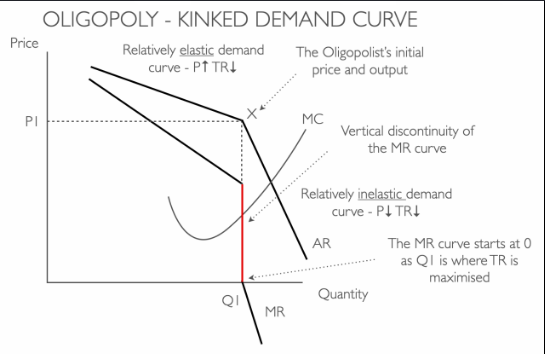
Kinked Demand Curve
If a firm lowers prices (P1 to P2), competitors will simply match this by reducing prices too → so demand is inelastic → Firms lose revenue so MR curve is negative
If a firm raises prices (P1 to P3), competitors will not follow but keep prices the same → so demand is elastic → Firms lose revenue as large fall in sales
Potential Advantages of Oligopolies
Greater price stability
More dynamically efficient
Cooperation on industrial standards or product features
Disadvantages of Oligopolies
Allocative inefficiency
Productive inefficiency
Higher prices & lower output
Higher concentration reduces consumer choice
Concentration Ratio
The percentage of market share taken up by the ‘n’ largest firms in an industry (e.g. 3 firm concentration ratio)
Non-Price Competition
Competition between firms in ways other than changing prices
Quality of product
Branding
Customer Service
Location
Advertising
Range of products
Real World Application of Oligopolies - Supermarket Industry
Supermarket Industry
5 firm concentration ratio: 66% (Tesco 28.5%)
Predatory Pricing: 1996 Supermarket price war resulted in 3p baked beans
Brand loyalty: Over 22mn households use a clubcard in the UK (non-price competition)
Environment: UK supermarkets produce 240,000 tonnes of food waste annually from their operations and 100,000 tonnes of this is deemed to be edible food.