RESEARCH METHODS 2026
1/106
Earn XP
Description and Tags
Added 3-4 terms OG
Name | Mastery | Learn | Test | Matching | Spaced | Call with Kai |
|---|
No analytics yet
Send a link to your students to track their progress
107 Terms
What is the aim?
A concise statement outlining the purpose of the investigation
Relates to the research question
What is a hypothesis?
A testable prediction about the relationship between two or more variables
How is a hypothesis reviewed?
Either supported or rejected, never proved!
What is a controlled experiment
An investigation to test the relationship between an IV and a DV whilst controlling all other variables.
What is a variable?
Something that can change (‘vary’) in amount or type & is measurable
What is a controlled variable?
Variables that are held constant to remove potential effects on the DV.
Independent variable (IV) (sometimes known as the treatment variable)
The variable that is systematically manipulated in order to test its effect on the D.V
dependent variable (DV) is
The variable that is measured to observe the effects of the IV.
Operationalising variables
Refers to specifying exactly how the variables will be manipulated or measured in a controlled experiment.
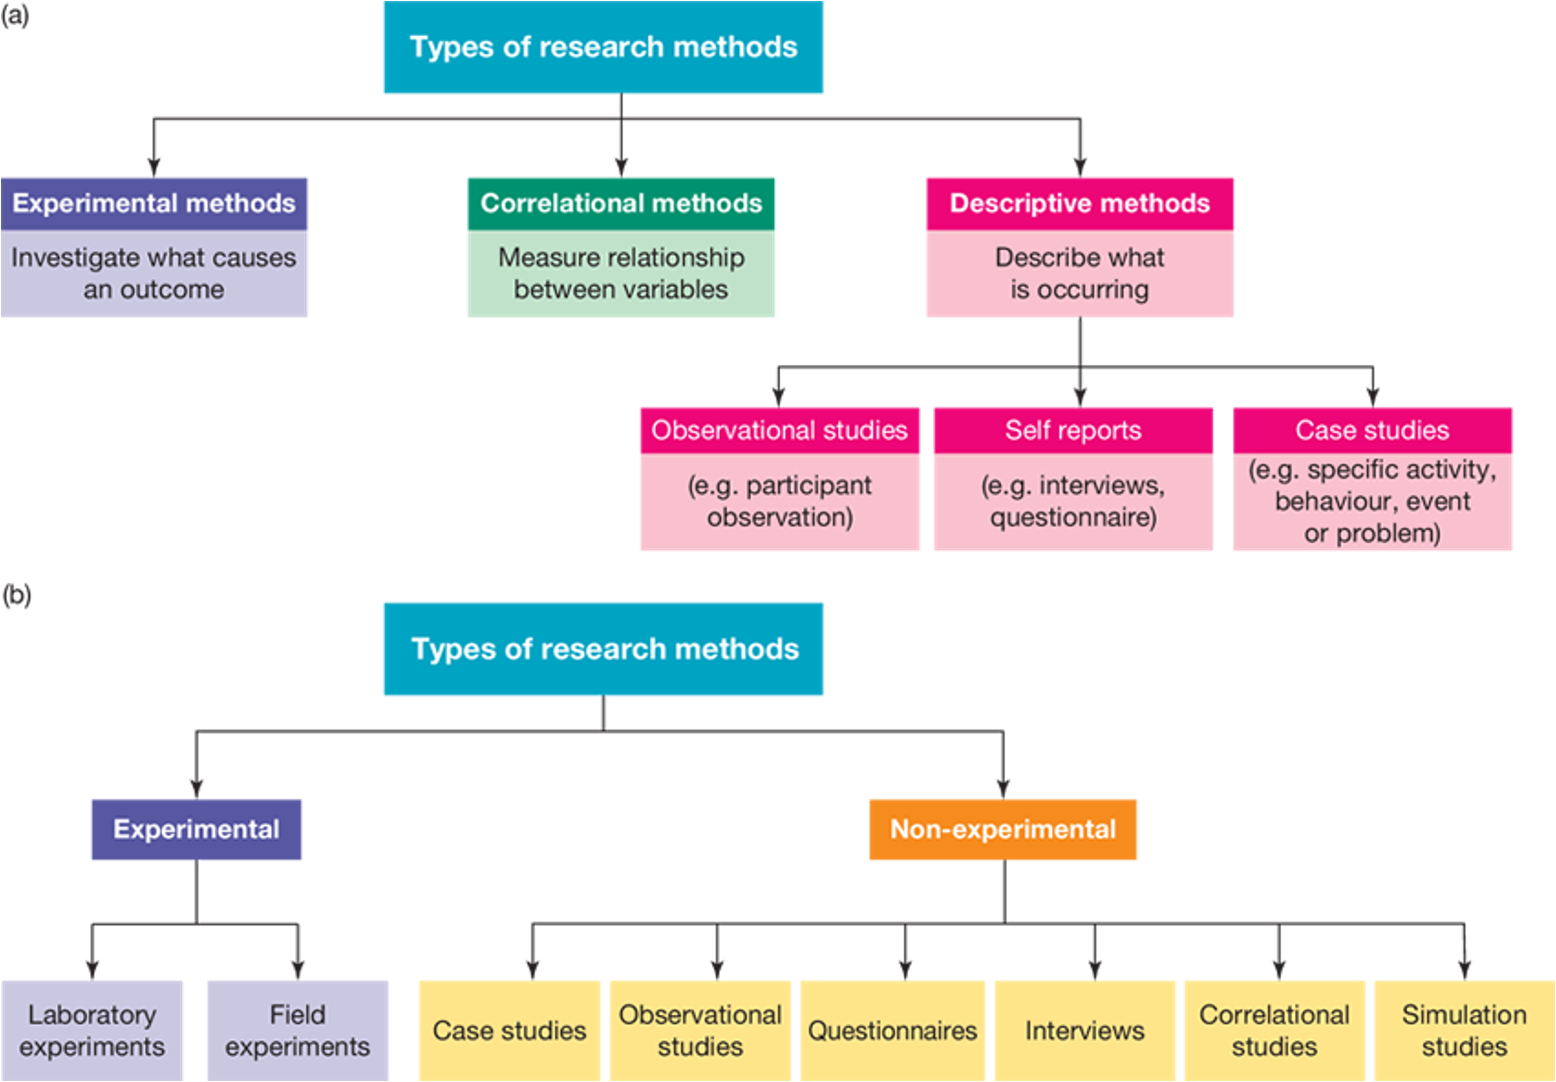
Lists the types of research methods
Correlational Methods
Experimental Methods
Descriptive Methods: observational studies, self reports, case studies
Experimental: laboratory experiments, field experiments
Non-experimental: questionnaires, interviews, simulation studies, case studies, observational studies, correlational studies
What is a correlational study?
Measures if there is a relationship between variables
no manipulation from the researcher including controlling the setting.
List the types of descriptive methods:
Self reports
Observational studies
Case studies
SOC
List the types of experimental methods
Laboratory experiments, field experiments
List the types of non-experimental research methods
Questionnaires
Interviews
Simulation studies.
Case studies
Observational studies
Correlational studies
QIS COC
(Quizz cook)
What is a self-report?
A participant’s answers to questions presented by the researcher.
What is an oberservational study?
+ves & -ves
Involves the collection of data by watching and recording behaviour without any intervention or manipulation of what is being observed.
Longitudinal study
Cross-sectional study
+’s:
Removes EV: artificiality (effect of unnatural environment)
-’s:
observer bias
What is a case study.
An intensive, in-depth investigation of behaviour, activity, event or problem of interest in an individual, group, organisation or situation.
What is cross-sectional method
Observational study
Involes analysing data from a population at one specific point in time.
Variables are not manipulated.
What is a longitudinal study?
Observational study
Involves repeated observations of the same individuals over a long period of time.
What is the population?
The entire group of people relevant to the research, that the sample is then drawn from.
What is the point of the population?
In order to generalise (apply) the results from an investigation to a wider relevant group.
What is the sample?
A subset or part of the population that is selected for research purposes
What is sampling
The process of selecting a part of the population for research.
What is random sampling? and examples
Sampling technique
Ensures every member of a population has an equal chance of being selected for the sample.
Pulling names out of a hat
Using wheel spinner
What is stratified sampling?
Dividing the research population into various subgroups (strata) based on relevant characteristics, then selecting participants in proportion to how they appear, so that each subgroup is represented.
what is convenience sampling?
Involves selecting the most readily available members of the population
Advantages of convenience sampling
Advantages: most time-effective and can be cost-effective
Disadvantages: The most likely sampling technique to create an unrepresentative sample (likely to share similar characteristic)
making generalisation harder
Stratified sampling advantages/disadvantage
Advantages:
Most likely to produce a representative sample.
Disadvantage:
Can be time consuming & expensive
May be demanding for researcher to select most appropriate sample
Random sampling advantages/disadvantages
Advantages:
Sample may be more representative than convenience sampling.
Reduces researcher bias
Can be representative if the sample is large
Disadvantages:
May be time consuming
If the sample is small may not be representative
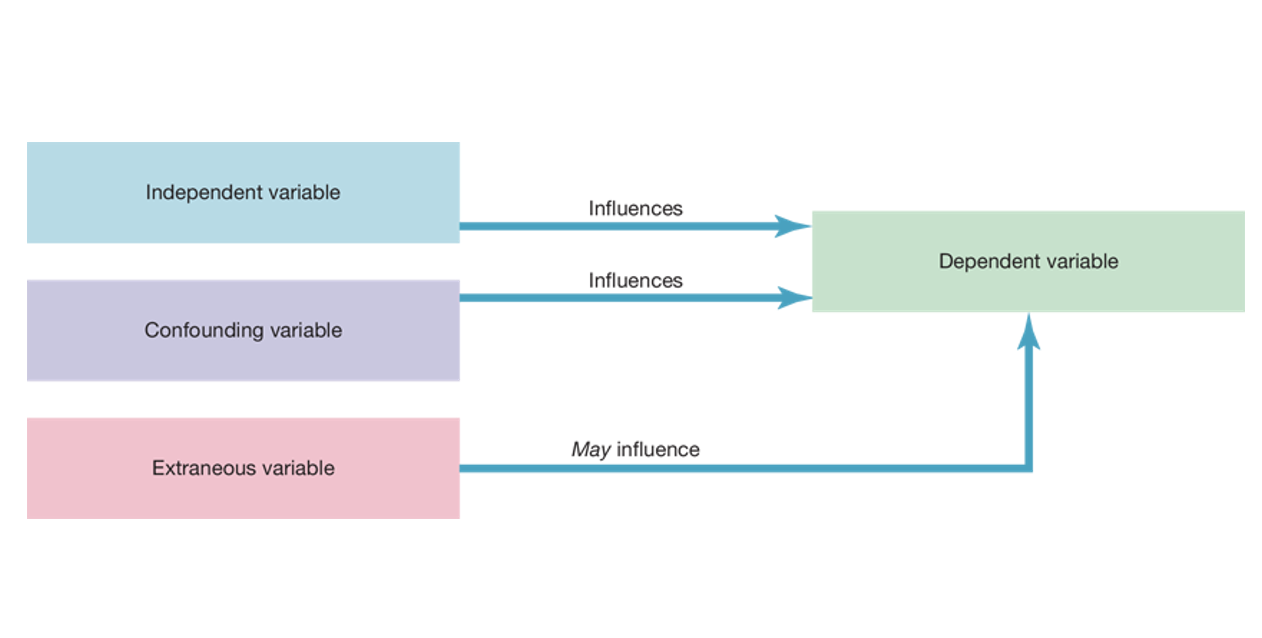
What is an extraneous variable?
A variable other than the IV that produces an unwanted effect, by potentially causing a change to the DV
What is a confounding variable?
A variable other than the IV that has had an effect on the DV and cannot be separated from the IV.
EVs may turn into confounding variables if they have a big impact on the interpretation of results.
Beneficence
ETHICAL CONCEPT
Trying to maximise benefits and minimise risks and harms
Integrity
ETHICAL CONCEPT
Commitment to add to public knowledge
Use honest reporting
Making study available to scrutiny
😱
Justice
ETHICAL CONCEPT:
Fair consideration of competing claims
No unfair burden on a certain group
Fair access to the benefits of the study
Non-maleficence
ETHICAL CONCEPT
Involves avoiding the causation of harm
Respect
ETHICAL CONCEPT:
Involves considering the rights of participants and that they are protected and empowered
List the ethical concepts
Beneficence
Respect
Integrity
Non-maleficence
Justice
BRINJ
Ethical guidelines
(Use of) Deception
Voluntary participation
Informed consent procedures
Debriefing
Withdrawal rights
Confidentiality
DVIDWC
Confidentiality
ETHICAL GUIDELINE:
All of a participant’s personal information and results are kept anonymous
Debriefing
ETHICAL GUIDELINE:
Ensures that at the end of an experiment, the participant leaves understanding the experimental aim, results and conclusions.
Informed consent procedures
ETHICAL GUIDELINE:
Before agreeing to be apart of a study participants should understand the nature and purpose of the experiment, including potential risks
Use of deception in research
ETHICAL GUIDELINE:
Deception can only be used if participants knowing the true purpose of the experiment may affect their behaviour whilst participating in the study, and the subsequent validity of the experiment.
Voluntary participiation
ETHICAL GUIDELINE:
Ensures that no coercion or pressure is put on the participant to partake in an experiment, and they freely choose to be involved.
Withdrawal rights
ETHICAL GUIDELINE:
Involves a participant being able to leave an experiment at any time during or after the conclusion of an experiment, without penalty.
What is reliability
Refers refers to the extent to which a measure
produces results that are consistent, dependable and stable.
REPEATABILITY:
Relates to the extent results are consistent under the same conditions
REPRODUCIBILITY: refers to how the consistent results are
under changed experimental conditions.
What is validity
Refers to the extent an investigation measured what it intended to.
Means the results represent the population the sample was drawn from.
Internal validity
Relates to how well the study was conducted
Additionally if the study investigated what it set out to/claims to have
External validity
Relates to the applicability of the results, to see if results can be applied beyond the study’s sample, to the wider population.
generalisation
When the research findings are applied to the the broader population.
Made when results:
Statistically significant
Sample is representative of population
Method of sampling is appropriate
Variables controlled
No know sources of error or biases
SS M V N
what is included in a good hypothesis
Variables that can be observed & measured
One sentence
Can be supported or refuted
States the existence and direction of a relationship
A good aim
Clear and concise
One sentence
Relates to research problem/question
Describes purpose of investigation
List the 7 steps of research
Identify research problem
Formulate hypothesis
Design the Method
collect the data
analyse the data
Interpret the results
Report the findings
What is Identify the research problem
Step 1 in research
Identify topic of interest
conduct a literature search- read relevant research articles
Develop research question
Step 2 in research
Formulate a hypothesis
Design the Method
Step 3 in research
Determine how the researcher will test the hypothesis.
WHO will participate
WHAT they will do
WHAT conditions
HOW to sample them
HOW many participants
Minimise any unwanted variables
Step 4 in research
Collect the data
To measure participants performance, opinions or results.
Analyse the data
Step 5 in research
Researcher must make sense of data by:
organising, representing,raw data, summarising,in a logical manner
ORS
Raw data
the actual data collected from a study.
Step 6 in research
Interpret the results
Involves forming conclusions about what the data shows
Inferential statistics
Stats that allow you to make inferences and conclusions about the data
Report the findings
Step 7 in research
Psychological research is conducted so it can shared.
Prepare a report, so the public can benefit from the findings.
Participant allocation
Once participants have been selected for a study, they must be allocated to groups within the study
Random Allocation
Ensures every member in the sample has equal chance of being assigned to groups in the experiment
Experimental group
group(s) exposed to the experimental conditions
Control group
THe groups that is exposed to the control condition, where the IV is absent.
3 Experimental design options
Between subjects
Within subjects
Mixed subjects
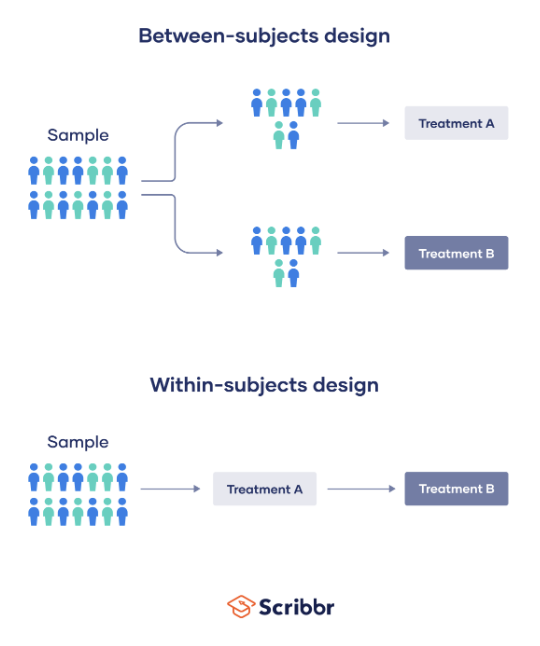
Between subjects
2 different groups of participants are compared

672 × 307
Types of between subjects experimental dsign
Independent-groups design (random allocation)
The matched-participant design (pairing and divide)
Independent-groups design
+ Advantages and Disadvantages
Experimental research design: Between subjects:
Involves randoming allocating members of the sample to either the control group or experimental group
+ves:
Quick and easy design
Enables large number of particiapnts
in a timely & cost-effective way
-ves:
may be participant differences across groups
The matched Participant design
Advantages and limitations
Experimental research design: Between subjects
Seeks to eradicate participant differences across groups.
Involves pairing each participant based on a characteristic they share
then randomly allocating one to the control group and one to the experimental group .
Advantages:
Minimise extraneous variables by spreading participant characteristics
limitation:
involves pre-test
time consuming
if one participant leaves so to does the other.
Participants are not identical.
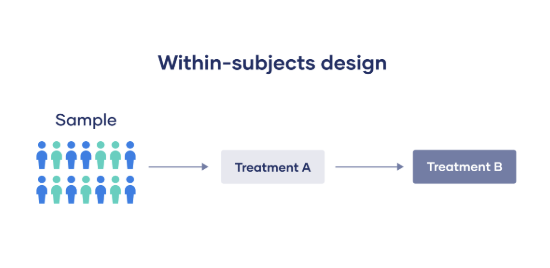
Within subjects design
Advantages and limitations
The same participants are used in both the control and experimental groups, or all the treatment conditions (if there is no control group)
Advantages:
Identical characteristics and abilities, no participant differences
Limitations:
Order effects
Order effects
When there is a change in results due to the sequence of tasks being completed.
Increased performance due to knowledge or experience
OR
Decrease due to boredom or fatigue.
How to minimise order effects?
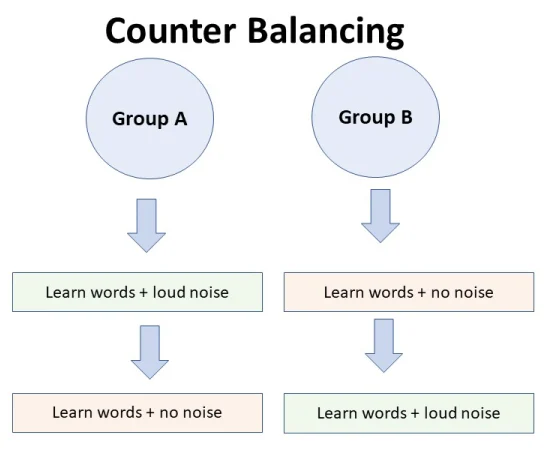
Counterbalancing!
Occurs in within subjects designs
Involve dividing the group of participants in half and arranging the order so it’s different for each group.
Half will experience control first then experimental and the opposite for the other group
Placebo
A fake or false treatment used so none of the participants know if they are exposed to the experimental condition.
+ves:
reduces impact of placebo effect
Placebo effect
Occurs when there is a change in a participant’s behaviour due to their expectations about the treatment.
Single-blind procedure
When the participants do not if they are in the control or experimental group(s)
-placebos used, reducing participant expectations on the results
-experimenter affect may still impact particiaptns
Experimenter effect
Occurs when there is an unintentional change in participants due to the experimenters influence
Body language, verbal cues, preferential (better) treatment
Also known as demand characteristics, where the experimenters behaviour inadvertently causes a demand for participants to perform as the experiment predicts.
Double blind procedure
Neither participants not the experimentor know which participants have been alocated to the control and experimental groups.
+ves:
reduce impact of experimenter effect on results
-ves:
involves another person knowing who’s in what group
Difference between a correlation and controlled experiment
Controlled: seeks to establish a cause-and-effect relationship exists
Correlational: seeks to show two or more variables are related
Primary Data
New research
Data a researcher gathers themselves during a current study
Secondary data and what can it be used for
When a researcher uses previous research or knowledge in their own study.
Basis for future predictions
Used for data modelling
What does data modelling allow?
Predicted pattern to be considered, so a change can be prevented or mitigated.
Subjective vs Objective Data
Subjective data: based on opinions
Objective data: observable and measurable
What is subjective data
+ve & -ve
Based on opinion, from observations or self reprots.
Comprises: personal information
+’s
can provide great insight into a person’s opinions or beliefs
-’s
Difficult to compare and analyse
Objective Data
data that can be observed and measured
+’s
easily analysed and compared
Minimise biases from subjectivity
-’s
Doesn’t provide reasoning behind the data
Qualitative Data, limitations and benifts
Describes changes in the quality of behaviour, often expressed in words
Opinion based
+’s
participants can provide great insight
-’s
Difficult to categorise os statistically analyse or compare
open to personal, observer, researcher biases
Quantitative data
Collected through systematic and controlled procedures
Typically presented in numerical or categorical form
+’s
can be statistically analysed and readily measured (Similar to objective data)
-’s
restrict participants answers
provides no insight to reasoning behind data
Mixed Methods Research
incorporates both quantitative and qualitative into research
Results strengthened because quantitative data is paired with explanations using qualitative data.
The Different Types of Data
Primary: data collected in the present study
Secondary: previous research or knowledge
Subjective: data based on opinion from self reports & observations
Objective: observable and measurable data
Qualitative: describes changes in behaviour, often expressed in words
Quantitative: collected systematically, and presented numerically
Continuous: real values exist between each data point
Discrete: categories have no relationship to each other
Descriptive Statistics list
Percentages
Measures of Central Tendency:
mean
median
mode
Variability
Percentages illustrate: +’s
the proportion of the sample that displays a particular behaviour.
(number / total) x 100
+’s
Quick and effective way to compare group results
Central tendency
Involves calculations that show how typical scores fall in the data set.
3 measures of Central Tendency:
Mean: all scores are + then ÷ by total
-’s greatly influenced by outliers, skewing data
Median: middle number in ordered data.
+’s not affected by outliers
Mode: most commonly occurring number in data set.
+’s useful for visualising most often score
-’s unreliable for small samples
Variability
How data is spread
E.g:
Range: lowest score - highest score
Standard deviation: Looks at how far each piece of data deviates/differs from the mean
Low SD = scores are clustered around the mean = low variability
High SD = scores are spread from the mean = high variability
Why use descriptive statistics +’s & -’s
+’s
Organisation
-”s
Do not account for errors
Do not establish cause and effect relationship
Need more data to draw conclusions
Frequency distribution table
Simple way of organising data if there is a large amount of data.
Categories being compared place in one column, in class intervals
Count how many times data fits into each category referred to as frequency
A graph enables,
large amounts of information to be neatly organised and summarised
can show how one variable relates to another
Types of graphs
Histogram:
class intervals on x axis, frequency on y axis,
Bars touch as data is continuous
can be made from frequency distribution table
Frequency polygon:
adapted histogram
type of line graph that joins midpoints of histogram
begins and ends on x-axis.
Line graph:
Single line that connect points that relate to one another
Continuous data
Real values exist between each data point
data is on a continuum
Discrete data
the data is unrelated, not on a continuum