Deep Ocean Currents & Marine Ecology
1/40
Earn XP
Description and Tags
Name | Mastery | Learn | Test | Matching | Spaced | Call with Kai |
|---|
No study sessions yet.
41 Terms
The amount of dissolved salt in water
Salinity
A unit used to measure salinity, showing how many parts of salt are in 1,000 parts of water
Parts per thousand (ppt)
The global movement of ocean water driven by differences in temperature and salinity
Thermohaline circulation
The amount of mass in a given volume
Density
Explain how temperature impacts the density of ocean water.
As temperature increases, density decreases
As temperature decreases, density increases
Explain how salinity impacts the density of ocean water.
As Salinity increases, density increases
As Salinity decreases, density decreases
How do freezing, melting, precipitation, and evaporation impact salinity?
Freezing and evaporation increase salinity
Melting and precipitation decreases salinity
What is the approximate Salinity for the equator?
35 ppt
What is the approximate Salinity for 30 N/S?
36-37 ppt
What is the approximate Salinity for 60 N/S?
33-34 ppt
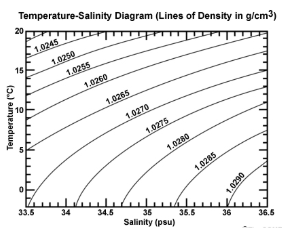
Use the diagram below, to answer: If ocean water has a salinity of 36 PSU and a temperature of 10 ०C, what is its density?
1.0277 g/cm3
Explain why thermohaline circulation begins in the North & South Atlantic.
The North and South of the Atlantic Ocean has the densest water. It sinks, pushing the water below it. This water travels along the ocean floor until it is pushed upwards
All organisims
Biosphere
A large grouping of plants and animals that occupy areas of similar climate
Biome
A small grouping of interacting plants, animals, and their environment.
Ecosystem
All living organisms in the ecosystem
Community
A single species of organism
Population
A single organism within a species
Individual
An organism that makes its own food using sunlight or chemicals
Producer
The nonliving parts of an environment, such as temperature, water, and sunlight
Abiotic
The study of how living things interact with each other and their environment
Ecology
An organism that eats other organisms for energy
Consumer
The feeding levels in a food chain or food web
Trophic levels
A simple path that shows how energy moves from one organism to another
Food Chain
An increase in the number of individuals in a population over time
Population growth
A group of interconnected food chains
Food web
The living parts of an environment
Biotic

Name an abiotic factor (pictured) in this ecosystem:
Plastic debris

Name a biotic factor (pictured) in this ecosystem:
Fishes
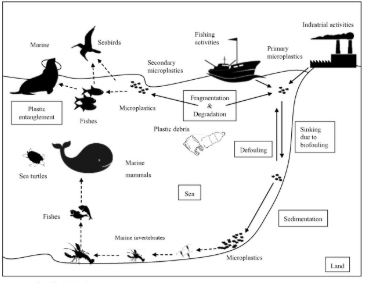
List the community of this ecosystem
Seabirds, fishes, sea turtles, marine mammals, marine invertebrates

Name a population in this ecosystem
Sea turtles
Mutualism: 🙂 ☹ 😐 (emojis are search+shift+space) no spaces
🙂🙂
Commensalism: 🙂 ☹ 😐 (emojis are search+shift+space) no spaces
🙂😐
Parasitism: 🙂 ☹ 😐 (emojis are search+shift+space) no spaces
🙂☹
Example of mutualism
Sea anemones and clownfish
Example of commensalism
Remoras and sharks
Example of parasitism
Whales and whale louses
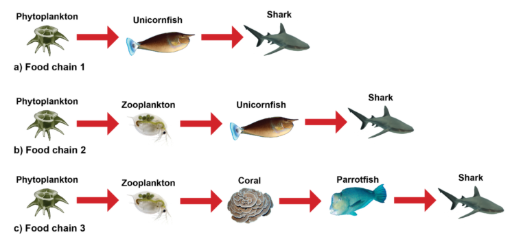
The diagram below shows three food chains in a coral reef biome. Use it to draw a food web for the biome. (answer = hi)
hi
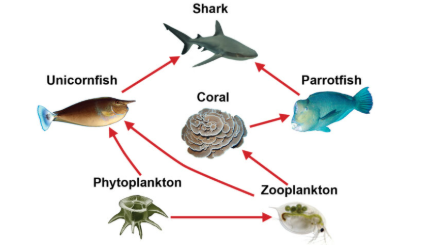
What could be a keystone species in the food web above? Explain why.
The phytoplankton because if they die out, then everyone will eventually die.
What is the 10% rule?
Only 10% of the energy available at one trophic level is passed on and stored as biomass in the next level.
If the primary producer receives 5,000 units of energy from the sun, how much energy would be available in the secondary consumer?
50 units