AP Statistics All Units
1/79
Earn XP
Description and Tags
Name | Mastery | Learn | Test | Matching | Spaced |
|---|
No study sessions yet.
80 Terms
Conditions for regression inference
L-Linear relationship
I- Independent observations
N- Normality of Residuals
E- Equal variance of Residuals
R- Random sample/eperiment
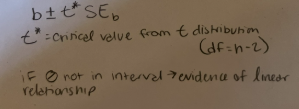
Confidence interval for slope
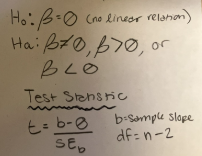
Hypothesis test for slope
Confidence intervals for mean
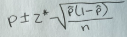
Should be t star not z star

Confidence intervals for proportion
Hypothesis testing for means

Hypothesis testing for proportions
Normality conditions of means
n is greater than or equal to 30
Normality conditions of proportions
np is greater than or equal to 10
n(1-p) is greater than or equal to 10
Z-Tests
Use:
Parameter
Hypothesis
Assumptions and conditions
Name the test
T/o- Run the tests
M/s- Conclude
normal CDF
One sample
two sample
Matched Pairs
proportions
T-tests
Use:
Parameter
Hypothesis
Assumptions and conditions
Name the test
T/o- Run the tests
M/s- Conclude
tcdf
one sample
two sample
means
Z- Intervals
Use:
Parameter of interest
Assumptions and conditions
Name the test
I- find the interval
Conclude
proportions
one sample
two sample
t-intervals
Use:
Parameter of interest
Assumptions and conditions
Name the test
I- find the interval
Conclude
mean
one sample
two sample
Chi Squared Goodness of fit
correct or incorrect
Chi Squared test
Homogeneity- Different or not different
Independence- Association or no association
Central limit theorem CLT
if samples are large enough the sample mean/proportion distribution is approximately normal

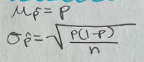
Sample means mean and standard deviation

Sample proportion mean and standard deviation
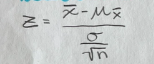
Z Score for sample means
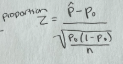
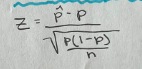
Z score for sample proportion
Confidence intervals
use sampling distributions to estimate population parameters PANIC
Hypothesis tests
use sampling distributions for calculating test statistics and p-values PHANTOMS
Random variable
a value outcome from a random process
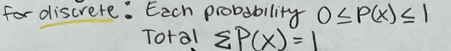
discrete
finite/countable number of values
continuous
all values in an interval
Probabilitiy distributions
lists values of a random variable and their probabilities
Standard deviation
spread
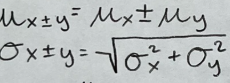
combining random variables
for independent x and y
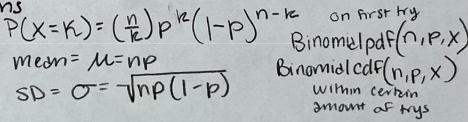
Binomial distributions
Binary
Independent
Number- fixed number of trials n
Success(same p)
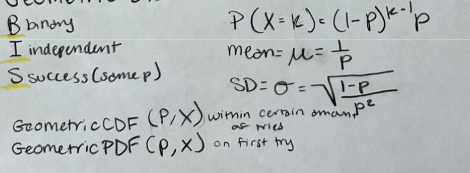
Geometric Distributions
trials until first success
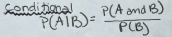
Conditional probability
Independence with probability
Two-way tables and venn diagrams
useful for calculation joint, marginal and conditional probabilities
helpful visuals for understanding overlap and independence
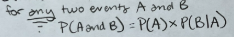
General multiplication rule for probability
Tree diagrams
useful to model multi stage processes
helps visualize and compute compound probabilities
using probability to make a decision
expected value and risk assessment
Probability
long run frequency of an event
0=impossible
1=certain
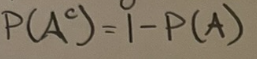
Complement rule
probability that event A doesn’t happen
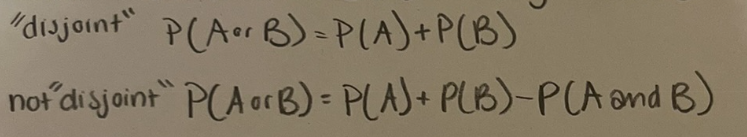
Addition rule
OR- if A and B are mutually exclusive
Multiplication rule
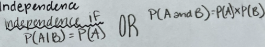
AND- if A and B are indepedent
P(AandB)=P(A)xP(B)
Independence
one event doesn’t affect the other
ex. flipping a coin
Disjoint
mutually exclusive
can’t happen at the same time
ex. rolling a die and getting a 2 and a 3
Simulation steps
describe a process, assign digits to outcomes, preform trials, record outcomes, repeat enough trials for accurarcy, use results to estimate probability
Observational study
no treatment applied;observed objects as they are
Experiments
imposes treatment to measure cause and effect
population
entire group you want to study
sample
subgroup of population
census
data from every member of population
sampling frame
list of individuals where a sample is drawn
Simple random sample
every individual has an equal chance of getting selected
Stratified random sample
divide into strata, then randomly select within each
cluster sample
divide into clusters, randomly select whole clusters
systematic sampling
every #th individual
convinence sample
easy reach but strong likeihood of bias
voluntary sample
people choose to respond often biased
Undercoverage bias
some groups are not represented
nonresponse bias
people don’t respond
response bias
influenced by wording, interviewer, or lying
sampling bias
favors certain outcomes
Principals of designing a study
control
replication
random assignment
comparison
Completely randomized experimental design
subjects randomly assigned to treatments
randomized block experimental design
subjects break into groups, then randomly assigned
matched pairs experimental design
each subject gets both treatments, or paired with similar individuals
Confounding variable
influences both dependent and independent variables
lurking variable
not included in study but affects interpretation
Percentiles
value below which a given percentage of data falls
z-score
how many standard deviations a value is from the mean
positive z score, greater than mean
negative z score, less than mean
Adding and subtracting a constant
impacts center(mean and median)
DOESN’T impact shape or spread(IQR and SD)
Multiplying and dividing by a constant
impacts center and spread
DOESN’T impact shape
Using Normal distributions
normalcdf(lower value, upper value, mean, standard deviation)
invnorm(area, mean, standard deviation)
Quantitative
measureable numbers
qualitative
categorical and groups
Bar graph
categorical data, bars don’t touch
Histograms
quantitative data, bars touch
Dot plots
small data sets
box plots
summarize data using min, max, Q1, Q3, and median
Outlier rule for box plots
Q3+IQR(1.5)
Q1-IQR(1.5)
Symmetrical
both sides are equal
Uniform
even distribution
Empurical Rule
68% of data is within 1 standard deviation of the mean
95% of the data is within 2 standard deviations of the mean
99% of the data is within 3 standard deviations of the mean