Cost Curves
1/3
Earn XP
Description and Tags
Microeconomics 3.3.2
Name | Mastery | Learn | Test | Matching | Spaced | Call with Kai |
|---|
No analytics yet
Send a link to your students to track their progress
4 Terms
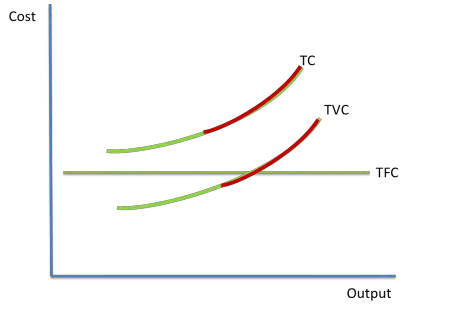
How are costs affected by diminishing returns?
On the diagram, the red parts show diminishing returns, where the cost of production starts to rise with increased output. Marginal costs rise with increasing diminishing returns

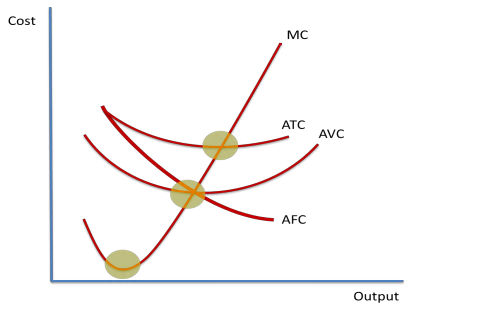
How is MTC then linked to diminishing returns
The diagram above shows cost curves. MC, ATC and AVC rise with diminishing returns. AFC falls with increasing output. The lowest points on the curves, as shown by the yellow highlighted circles, are the points where diminishing marginal productivity sets in. Before this, average costs are falling. After this, average costs are rising. The MC curve cuts through the lowest points on the ATC and AVC curves

Relationship between SRAS and LRAS average cost curves
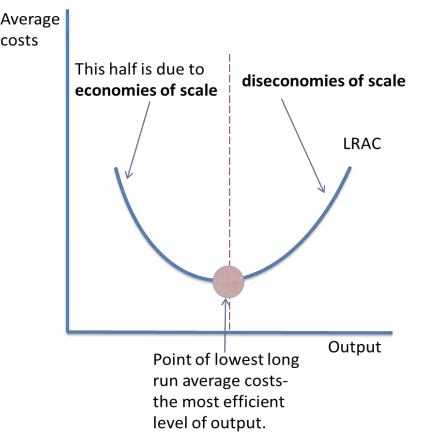
The point of lowest LRAC is the minimum efficient scale. This is where the optimum level of output is since costs are lowest.If fixed costs are high, average costs are lowered as output increases. When diseconomies of scale set in, average costs increase. This is shown on the long run average cost curve because economies of scale are only applicable in the long run.

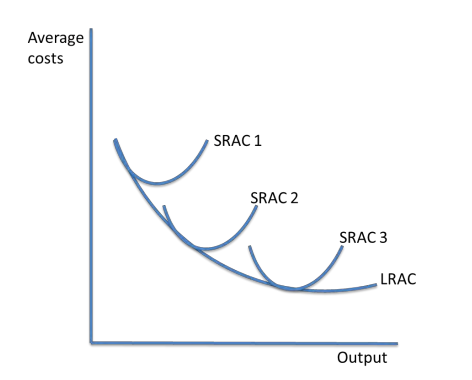
Using multiple SRAS lines show how diseconomies of scale compare to LRAS
shows the relationship between the SRAC curve and the LRAC curve. The LRAC curve envelopes the SRAC curve, and it is always equal to or below the SRAC curve. The LRAC curve shifts when there are external economies of scale, i.e. when an industry grows. SRAC falls at first, and then rises, due to diminishing returns. In the long run, costs change due to economies and diseconomies of scale. If SRAC = LRAC, the firm operates where it can vary all factor inputs.
