Looks like no one added any tags here yet for you.
Describe several of the major environmental trends that the Union of Concerned Scientists brought to our attention in 1992 and 2017
In 1992, the Union of Concerned Scientists penned the "World Scientists' Warning to Humanity"
Cautioned that a great change in our stewardship of Earth and its life is required
Concerns about current, impeding, or potential DAMAGE on planet Earth
Ozone depletion
Luckily ozone-depleters have decreased since 1992 as world leaders agreed to stop manufacturing things with them in it.
The Montreal Protocol of 1987
ODS (Ozone-depleting substances) used in refrigerators, air conditioners, fire extinguishers, and aerosols
Freshwater availability
Has unfortunately decreased per person/capita
Marine Catch
Decreasing but still above danger zone
Ocean dead zones
Process by which bodies of water get polluted by excess nutrients either from human waste or fertilizer runoff from farms
This triggers oxygen level in water to drop causing DEAD ZONES
Oxygen dropping in water causes hypoxia
In such anaerobic conditions, this encourages microorganisms to break down organic matter through anaerobic respiration releasing CO2 in the water.
When CO2 reacts with H2O it forms carbonic acid lowering the pH and making the water more ACIDIC
Forest loss
1 hectare/ha is equivalent to ~2.5 acres
Decreasing but still well into the danger zone
Biodiversity
Significant decrease, destruction
Climate change
CO2 increasing
Temperature increasing by like 0.7 C
Continued human populational growth
We are 8 billion people
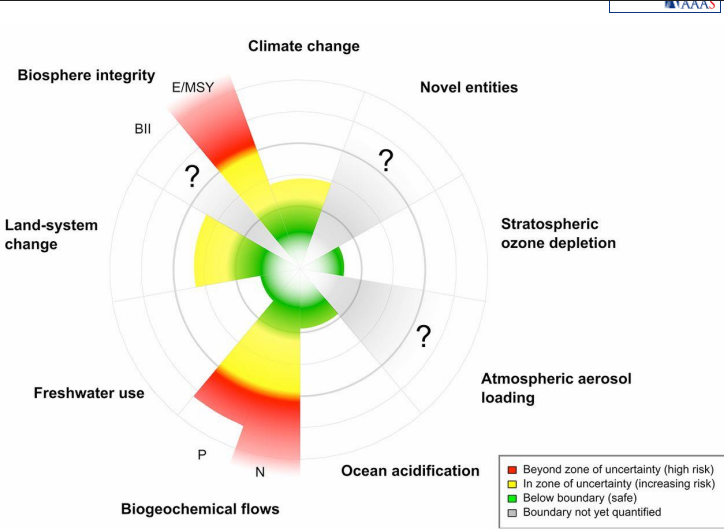
List Rockstrom and Steffen’s 9 planetary systems and identify which ones are currently exceeding their safe operating space
Framework/paradigm to show how sustainable/unsustainable human civilization is at a given point and time
More of a COMMENTARY/OUTLINE rather than stating facts, attempt to define safe boundaries/thresholds
1 Climate Change
Uncertain
2 Novel entities (n.q.)
Unknown
3 Stratospheric ozone depletion
SAFE
4 Atmospheric aerosol loading (n.q.)
Relates to "air pollution"
Unknown
5 Ocean acidification
SAFE
6 Nitrogen Cycle / Phosphorus Cycle
BOTH DANGER
Nitrogen Cycle
The nitrogen cycle describes how nitrogen moves between the atmosphere, soil, water, and living organisms. Nitrogen is essential for building proteins and DNA in organisms.
Overuse of fertilizers leads to runoff into water bodies creating DEAD ZONES
Excess nitrogen in soil also can lead to the release of N2O (nitrous oxide) which is a potent greenhouse gas
Phosphorus Cycle
The phosphorus cycle involves the movement of phosphorus through rocks, soil, water, and living organisms.
Unlike nitrogen, phosphorus is not found in the atmosphere and primarily cycles through the Earth's crust and ecosystems.
Also fertilizer runoff can generate excess phosphorus
Phosphorus is mined from phosphate rocks, which are a non-renewable resource. Overuse is depleting these reserves, leading to concerns about future agricultural productivity.
7 Global freshwater use
SAFE
8 Land-system change
Uncertain
9 In 2015, Biodiversity was subdivided into 2 parts
Species extinction Rate
How quickly they are going extinct
Functional species diversity
How diverse are the species in various ecosystems that serve various functions
DANGER
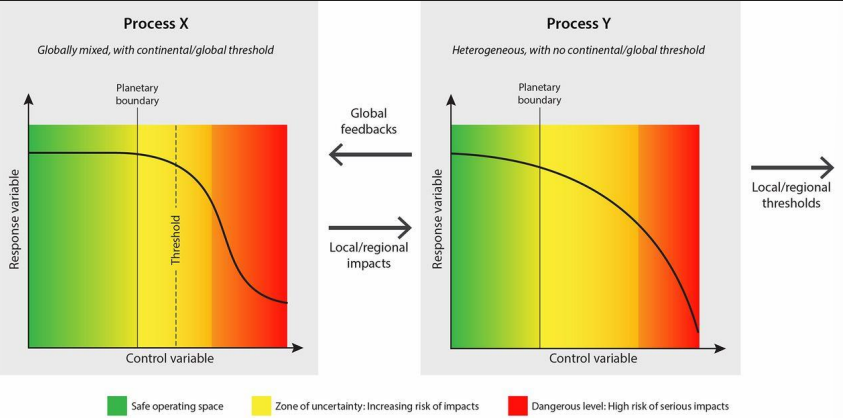
Describe how some of these systems or processes vary in their sensitivity to falling into the danger zone and also how they vary spatially across the globe
What is earth’s climate system composed of?
What is radiative forcing?
Showing the "safe operating space," the "zone of uncertainty," the "position of the threshold (where one is likely to exist) and the area of high risk.
Some are easier to read than others
In that they have a CLEARER THRESHOLD
Earth's Climate System
Composed of
Atmosphere
Oceans
Earth's land surface
Clouds can keep the Earth cooler during the day by reflecting sunlight back into space. However, at night, they trap heat, making the Earth warmer.
Radiative Forcing
A measure of how the energy balance of the earth-atmosphere system is influenced when factors that affect climate are altered
Greenhouse Gasses
Surface Albedo
Greenhouse Gasses
Solar radiation reaches the Earth, warming the surface.
The surface then radiates long-wave radiation back toward space.
Greenhouse gases absorb and reemit some of this long-wave radiation.
The net effect is that some radiation that would have escaped to space is reradiated within the atmosphere, causing warming
Albedo
Measure of how well a surface REFLECTS NRG (0-1 scale)
Snow (~0.9)
Asphalt (~0.1)
Dark surfaces absorb solar energy and reradiate it as heat that may be trapped by greenhouse gases in the atmosphere
LOW ALBEDO
Meaning dark forests absorb more solar energy resulting in more warming
Light surfaces reflect sunlight back into space in wavelengths not trapped by greenhouse gases, so they have a cooling effect.
HIGH ALBEDO
Increases in average global temperature reduce the area of ice and snow by melting, thus reducing the resultant reflectivity of the planet and producing a positive feedback loop in the climate system as the Earth warms still further.
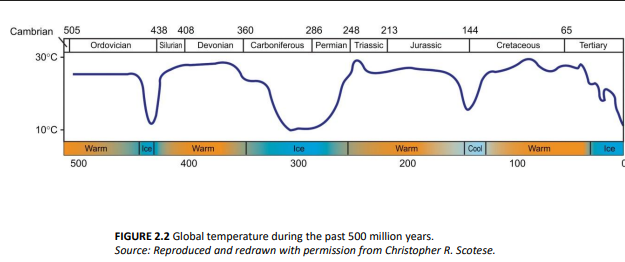
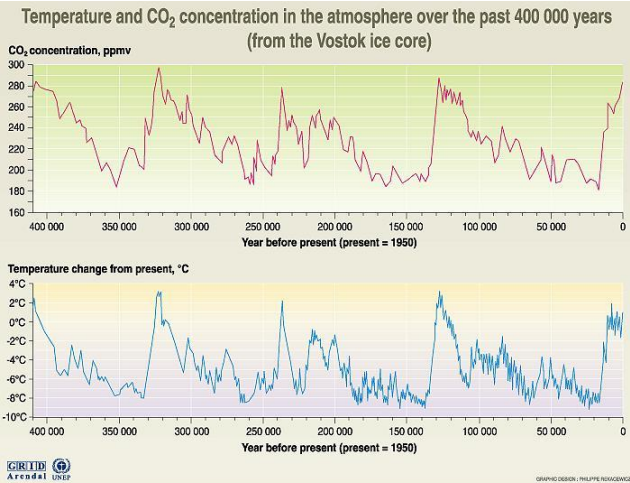
What has been the global temperature pattern over the past 500 million years? How do scientists calculate global temperatures over millions of years?
What is the concern about the temperature changes over history, what is the relevance of polar ice?
Our temperature has been continuously increasing since the turn of the 20th centrury, there was however a brief pause between 1950-1960, why is that so?
What is the global energy budget? Of the 342 W/m2 that reaches the earth’s surface from the sun, what happens to it?
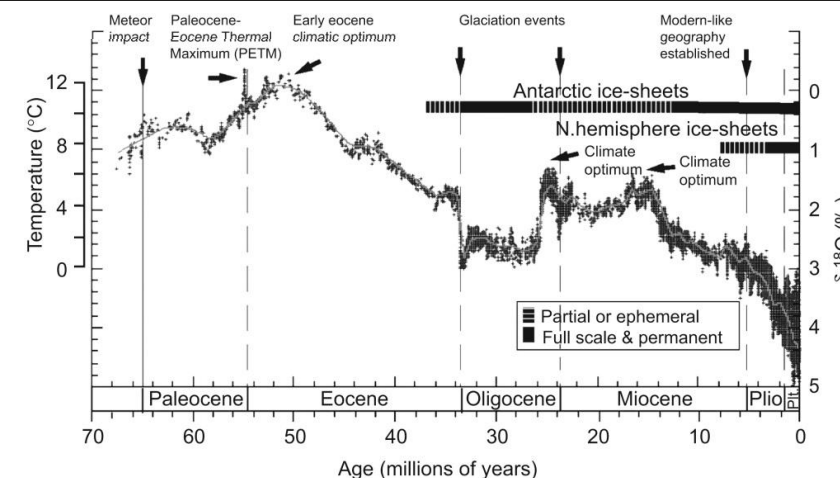
Over past 500 million years there have been warm and ice periods
Not the same as glacial and interglacial periods which are only from the last few tens of thousands of years
Scientists calculate global temperatures over millions of years using ice cores from polar regions like Antarctica and Greenland.
Ice cores are cylindrical samples of ice drilled from glaciers, ice sheets, or ice caps
These cores contain layers of ice that have accumulated over thousands-to-hundreds of thousands of years with each layer corresponding to a specific time period.
The layers are formed by snowfall that compacts into ice, trapping air bubbles, dust, volcanic ash, and other particles.
Trapped air bubbles: Ice cores contain tiny air bubbles that trap ancient atmospheres. By analyzing the ratio of gases like carbon dioxide (CO₂) and methane (CH₄), scientists can infer past atmospheric compositions, which correlate with temperature changes.
Isotopic analysis: The water molecules in ice contain isotopes of hydrogen and oxygen (e.g., heavy isotopes like deuterium and oxygen-18).
The relative abundance of these isotopes varies with temperature, allowing scientists to reconstruct temperature changes over time by analyzing these ratios in different layers of ice.
LOOK AT GRAPH 2
Drop at 33/34 million years ago in temperature
Climate system shifted rapidly
You can see that it jumps back up at 24 million years ago
Seems "sudden" but only based on scale
Over hundreds of thousands of years
The past 70 million years have seen the planet cool from the thermal maximum at the Paleocene–Eocene boundary 54 million years ago to current ice age conditions.
Polar ice formed in the Southern Hemisphere beginning approximately 35 million years ago
Polar ice formed in the Northern Hemisphere approximately 8 million years ago.
Northern Hemisphere polar ice became permanent approximately 2 million years ago, initiating the ice ages
Our concern is that we are having a rapid change in the span of mere DECADES!
****************************************************************************************************
There was a jump up between 1950-1960 because:
Aerosol Emissions: Post-World War II industrialization led to a surge in aerosol emissions (e.g., sulfur dioxide), which have a cooling effect on the atmosphere by reflecting sunlight back into space.
Masking Greenhouse Gases: The cooling effect from aerosols temporarily masked the warming caused by greenhouse gas emissions.
*****************************************************************************************************
Of the 342 W/m2 that reaches the Earth's surface from the sun
107 W/m2 MINORITY is reflected back into space
235 W/m2 MAJORITY is emitted from the earth as long-wave radiation
Some is trapped by greenhouse gasses like CO2, CH4, and water vapor which absorb and re-emit a portion of this radiation back toward the Earth's surface
Global NRG Budget
INPUTS:
Incoming solar (shortwave) and longwave radiation returning to Earth as a function of the greenhouse effect
Incoming Solar Radiation (Shortwave):
The Sun emits shortwave radiation (mainly visible light and some ultraviolet and infrared).
This radiation passes through Earth's atmosphere and is absorbed by the surface.
Earth’s Absorption & Re-Emission (Longwave):
The Earth absorbs the shortwave energy and warms up.
It then re-emits energy as longwave infrared radiation (heat).
Greenhouse Effect:
Some of this longwave radiation escapes into space.
However, greenhouse gases (like CO₂, H₂O vapor, and CH₄) absorb and re-radiate some of it back, trapping heat in the atmosphere.
OUTPUTS:
Head from surface evaporation and thermals
Longwave energy reemitted by Earth's surface
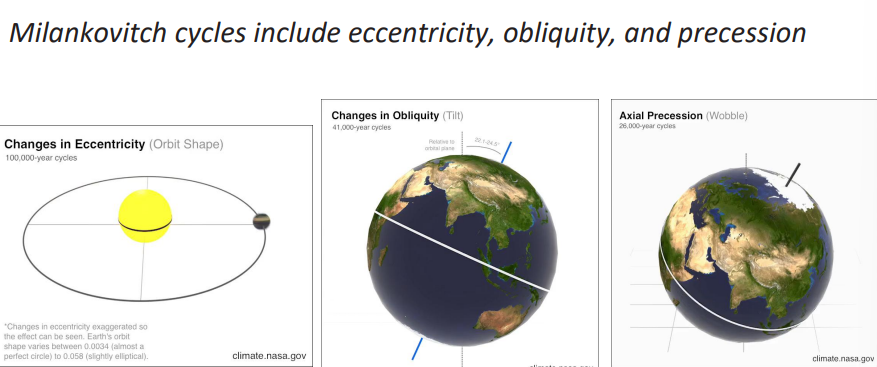
What are the 3 Orbital Forcings/Milankovitch Cycles? Describe each one.
POE, shortest to greatest cycle
Describe the global-scale patterns of air circulation and wind
Three major orbital FORCINGS affect the amount of solar radiation that hits the sun
These cycles occur on such long timescales that, although they help explain long-term fluctuations in Earth’s climate in the geologic past, they CANNOT explain our current decadal warming trends (too short of a time period
Precession (Wobble)
A gradual change in the direction Earth's axis points (~26,000-year cycle).
Affects the timing of seasons, determining whether northern hemisphere summers occur when Earth is closer to (warmer) or farther from (cooler) the Sun.
Effect on Ice Formation: Cool northern hemisphere summers (Earth farther from the Sun) allow ice caps to grow, while warm summers lead to ice melt.
Obliquity (Axial Tilt) (~41,000-year cycle).
The angle of Earth's tilt relative to its orbital plane (~41,000-year cycle).
Greater tilt → Stronger seasonal contrast (warmer summers, colder winters).
Smaller tilt → Milder seasons, favoring ICE SHEET GROWTH in Northern Hemisphere as summers are too cool to fully melt winter ice
Eccentricity (Orbit Shape) (~100,000-year cycle).
Describes changes in the Earth's orbit
from circular to elliptical (~100,000-year cycle).
Circular: More even solar energy distribution.
Elliptical: Seasonal variations in solar radiation as Earth gets closer/farther from the Sun.
All 3 of these orbital forcings affect the distribution of heating between seasons or between HEMISPHERES more strongly than they affect the overall amount of solar energy reaching the Earth
Their effect on climate is therefore due to amplifications and dynamic effects rather than to changes in raw NRG output
The most pronounced of these amplifications are the ice ages, which are driven by the unequal amounts of land in the Northern and Southern Hemispheres
When the Northern Hemisphere receives less heat, particularly in summer, ice may form on this land.
The ice reflects sunlight and cools the entire planet.
When the Northern Hemisphere receives more heat, the ice melts and the planet warms.
Warming and cooling of the Southern Hemisphere has no such effect because of the lack of land near the poles.
There is very little land near the poles in South America and Africa because both taper as they approach the South Pole.
***********************************************************************************************************
Warm air rises in the atmosphere, cools, and then DESCENDS
To be precise, air comes down from the North down to the equator
As the airs from both the north and south approach the equator, they COLLIDE and then rise
Air rises at the equator due to symmetry
At around 30 degrees (0 degrees is the equator) N+S there is DRY AIR
As such around here we have DESERTS, compared to the equator at 0 degrees where there are primarily tropical rainforests
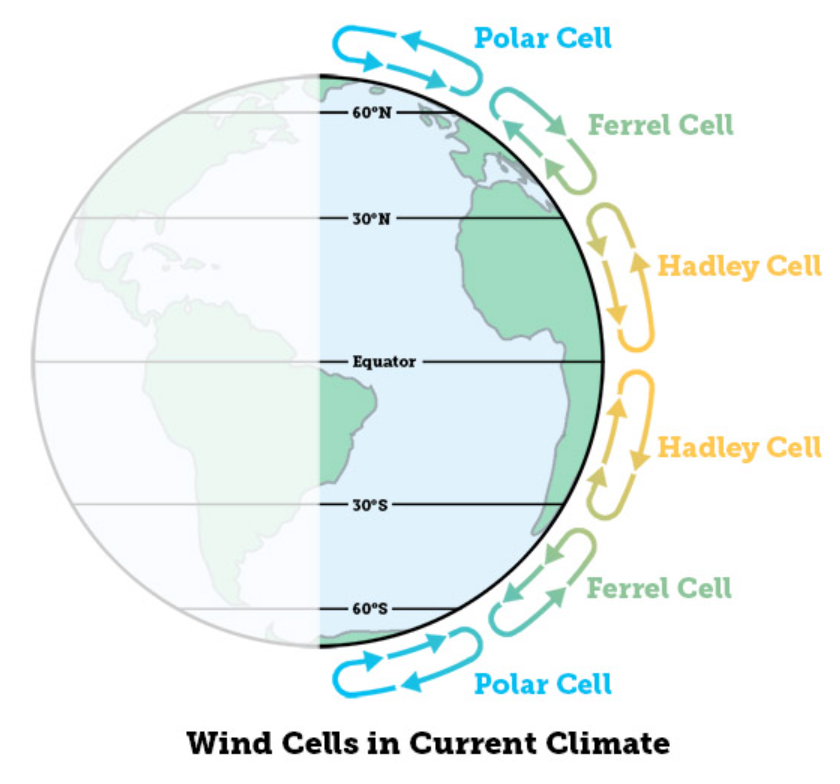
This phenomenon results in the formation of major vertical circulation features in the atmosphere known as:
These 4 Major Circulation Cells Influence Wind Patterns Globally (HFPW)
Hadley Cells
Found between equator (0) and (30) latitude in both hemispheres
Warm air rises from the equator due to intense solar heating up to 30 degrees latitude then cools as it descends back to the equator forming TRADE WINDS which are deflected westward due to the Coriolis Effect
Apparent deflection of moving objects, such as air or water, due to Earth's rotation, causing them to veer right in the Northern Hemisphere and left in the Southern Hemisphere.
The ITCZ (Intertropical Convergence Zone) is closely associated with Hadley cells as it forms the BOUNDARY where the trade winds from both hemispheres converge near the equator
Coriolis Effect
The apparent deflection of water and air due to Earth’s rotation causing them to
Veer RIGHT in Northern Hemisphere
Veer LEFT in Southern Hemisphere
Ferrel Cells
Located in between Hadley (30) and Polar (60) cells
Characterized by mid-latitude westerlies at the surface (flow west to east)
Air that is higher up moves towards the EQUATOR
Air that is lower/closer to the surface moves POLEWARD
Polar Cells
Located at the poles between 60 and 90 degrees
Cold dense air descends at the poles creating high pressure
Walker Cells
These winds go east-west in a mirrored way across the equator rather than up-and-down like the others
Found near the equator, driven by temperature differences between eastern and western regions such as during El Nino/La Nina Events
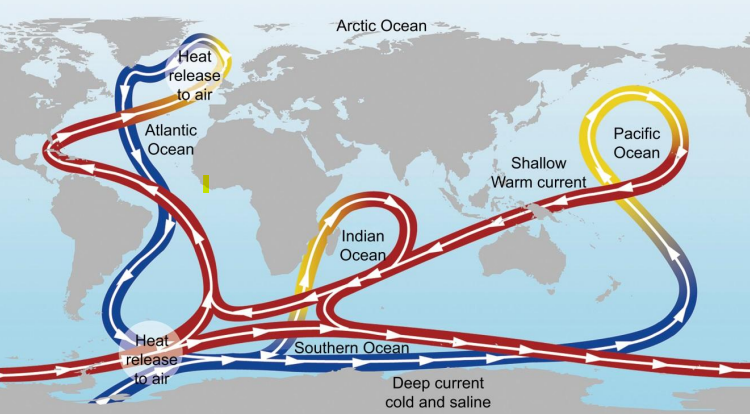
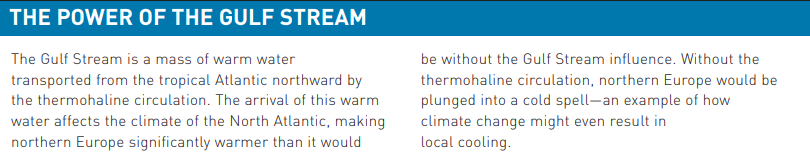
Articulate the significance of global ocean/thermohaline circulation
Thermohaline Circulation
Seawater warms near the equator where it evaporates thus becoming more saline (warm and salty)
Salt-rich water then rises and moves towards the poles where it cools and sinks back down (cold and less salty)
Towards the equator to rise again and begin the process anew (warm and salty)
Because it involves both temperature and salinity, this feature is termed thermohaline circulation.
Gulf Stream
The bend near Florida/Mexico
A powerful warm ocean current that flows from the Gulf of Mexico and across the Atlantic Ocean towards Europe (UK in particular)
It helps transport warm water and heat from the tropics to the north, influencing weather and climate by keeping parts of Europe warmer and affecting storm patterns.
Its shutdown can trigger RAPID CLIMATE CHANGES including the onset of ice buildup and glacial periods (due to lack of transport of warmi water that it brings)
Ekman Spiral
Where water movement near the surface of the ocean is affected by the wind, with each successive layer of water is moving more slowly and at a greater angle due to friction and the Coriolis Effect which is:
The apparent deflection of water and air due to Earth’s rotation causing them to
Veer RIGHT in Northern Hemisphere
Veer LEFT in Southern Hemisphere
The Ekman spiral causes surface water to move at an angle due to wind stress and the Coriolis effect, which displaces water away from the coast.
This displacement allows deeper, colder, and nutrient-rich water to rise to the surface, contributing to:
Upwelling
Occurs when winds move surface ocean water, and the Ekman spiral causes this water to be deflected, drawing cold, nutrient-rich water from the deep to the surface.
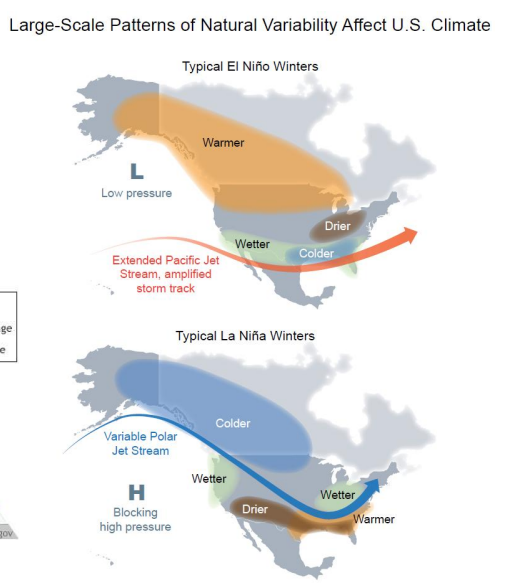
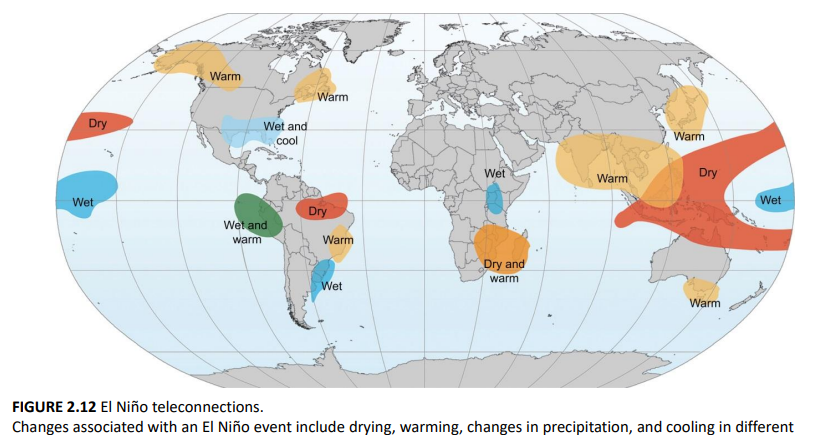
Explain the teleconnection ENSO in broad terms
How do El Nino and La Nina, respectively, affect the behavior of dry sinking air?
Explain the teleconnection ENSO in broad terms
A teleconnection refers to a climate phenomenon where changes in one region of the Earth’s climate system are linked to or influence weather and climate patterns in a distant region, often far from the original source of the disturbance.
El Niño-Southern Oscillation (ENSO): One of the most well-known teleconnections.
El Nino Event
Warm sea surface temperatures in Pacific Ocean affect weather patterns WORLDWIDE
Easterly trade winds weaken or reverse
The WARM Pacific Jet Stream shifts SOUTH, increasing storms in southern US
Generally HIGHER than average rain
Warmer than average in North
La Nina Event
COOLER sea surface temperatures in Pacific Ocean affect weather patterns WORLDWIDE
Easterly trade winds INTENSIFY
The COOL Polar jet stream shifts north, REDUCING storms in southern US
Generally LOWER than average rain
Cooler than average in North
How are California and Australia affected during each of these events?
El Nino (Pacific Ocean is warmed so everywhere is warmed)
California: Wetter and warmer
Australia: Drier and warmer
La Nina (Pacific Ocean is cooled so everywhere is cooled)
California: Drier and cooler
Australia: Wetter and cooler
How do El Nino and La Nina, respectively, affect the behavior of dry sinking air?
El Nino
During El Nino since the Pacific Ocean is WARMED UP, the typical upwelling of cold water in the Pacific Ocean is REDUCED thus resulting in LESS rising air and MORE dry sinking air in the East which can contribute to drought in Southeast Asia and Australia (DRIER AND WARMER)
Conversely Americas are wetter and warmer during El Nino
La Nina
During La Nina since the pacific Ocean is COOLER, the upwelling of it is INCREASED resulting in MORE rising air and LESS dry sinking air in the East making Southeast Asia & Australia (WETTER AND COOLER)
Conversely Americas are drier and cooler
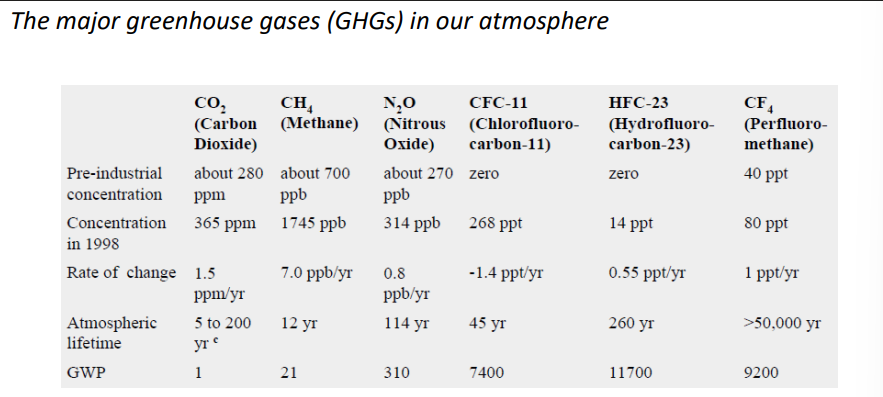
List the major greenhouse gases and their relative contribution to radiative forcing
Know From Most-To-Least on Table
CO2 (Carbon Dioxide)
Highest concentration/ppm
CH4 (Methane)
Ppb
N2O (Nitrous Oxide)
ppb
CFC-11 (Chlorofluoro-carbon-11)
ppt
CF4 (Perfluoromethane)
Atmospheric Lifetime is around 50,000 years (longest)
HFC-23 (Hydrofluoro-carbon-23)
Highest GWP
GWP (Global Warming Potential)
Measure of how much heat a greenhouse gas traps in the atmosphere over 100 years (CO2 is 1)
PPB: Fore very billion parts of gas in an atmosphere, 1745 of them are methane
PPM: For every million, thus there is much more CO2 concentration
Rate of change: how much it is increasing per year
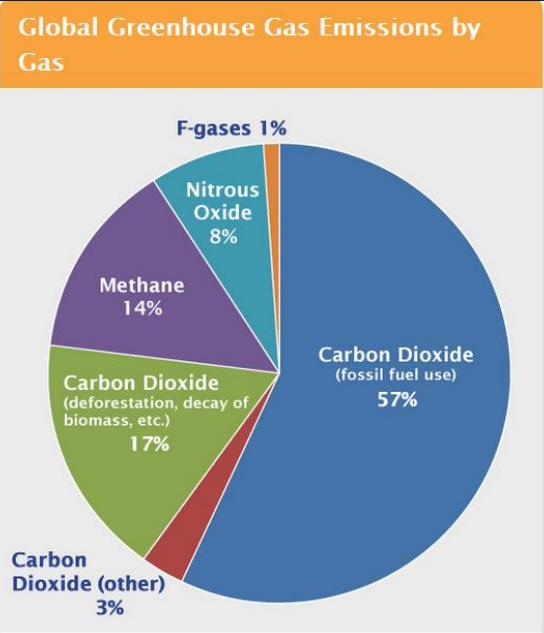
Global Greenhouse Gas Emissions by Gas
CO2 from Fossil Fuels: 57%
CO2 from deforestation/decay: 17%
CO2 (other): 3%
CH4: 14%
Permafrost is thawing and methane is releasing
Also in swamps methane releases
N2O (Nitrous Oxide): 8%
Overuse of fertilizers leads to runoff into water bodies creating DEAD ZONES
Excess nitrogen in soil also can lead to the release of N2O (nitrous oxide) which is a potent greenhouse gas
F-Gasses (CFC-11, HFC-23, CF4): 1%
Very powerful from a global warming perspective
Luckily we release very few of them
Largely synthetic, we manufacture them
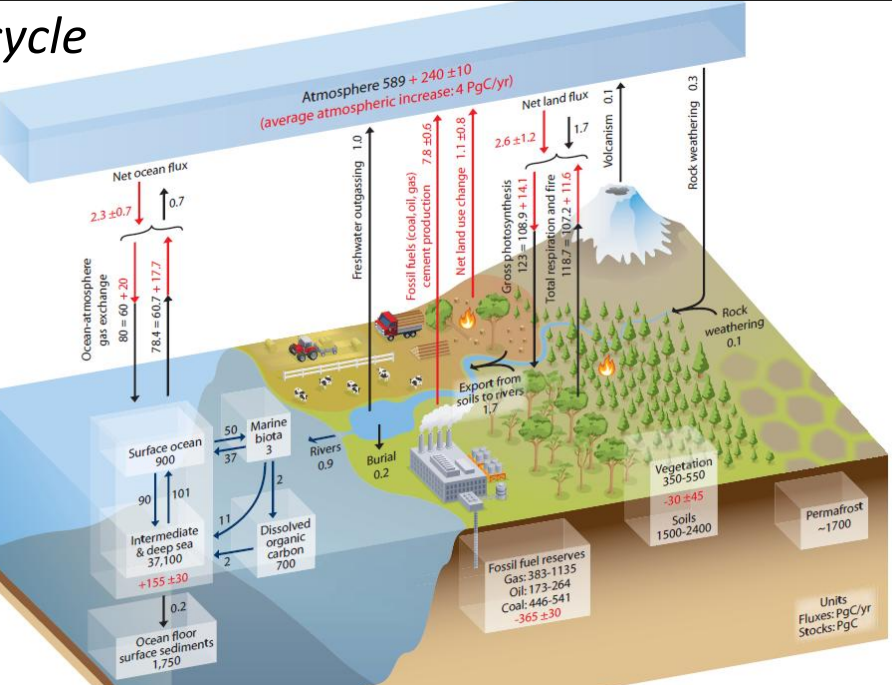
Describe the key components of the global carbon cycle, the relative size of the fluxes and pools, and identify areas of human influence
Understand how the sun’s energy drives atmospheric and oceanic circulation.
The global carbon cycle describes the movement of carbon between major reservoirs through processes like photosynthesis, respiration, decomposition, and fossil fuel combustion.
Human activities, such as burning fossil fuels and deforestation, are increasing carbon fluxes to the atmosphere, disrupting the natural balance and driving climate change.
. 1. Carbon Pools (Reservoirs):
Atmosphere: Contains carbon primarily in the form of carbon dioxide (CO2).
Oceans: Store carbon as dissolved CO2, bicarbonate ions, and in marine organisms.
Land Biosphere: Includes carbon stored in plants, soil, and terrestrial organisms.
Fossil Fuels
2. Carbon Fluxes (Processes moving carbon between pools):
Photosynthesis (Land Biosphere): Plants absorb CO2 from the atmosphere and convert it into organic carbon.
Respiration (Land Biosphere, Oceans): Organisms release CO2 back into the atmosphere via cellular respiration.
Ocean Uptake: Oceans absorb atmospheric CO2 through diffusion and biological processes.
Decomposition: Microorganisms break down dead organic matter, releasing carbon back to the soil or atmosphere.
Burning of Fossil Fuels: Humans release stored carbon from fossil fuels into the atmosphere via combustion.
Deforestation: Cutting down forests reduces the land biosphere's ability to sequester carbon.
3. Relative Size of Fluxes and Pools:
Largest Pool: The oceans (due to their vast size and absorption capacity) store about 38,000 gigatons (Gt) of carbon.
Second Largest Pool: The Earth's crust (fossil fuels and sedimentary rocks) contains approximately 60,000 Gt of carbon, but it is mostly inaccessible in the short term.
Atmosphere: Contains about 750 Gt of carbon, a smaller but very important pool for climate regulation.
Land Biosphere: Contains about 2,500 Gt of carbon, with forests being a key component.
Fluxes: The carbon flux between the atmosphere and land (photosynthesis + respiration) is approximately 120 Gt per year, while the ocean flux is about 90 Gt per year.
4. Human Influence:
Fossil Fuel Emissions
Land-Use Change: Deforestation and land conversion (for agriculture, urbanization) reduce carbon sequestration and increase emissions from soil disturbance.
Agriculture: Intensive farming practices, such as tilling, can release carbon stored in soil organic matter.
Climate Change
Understand how the sun’s energy drives atmospheric and oceanic circulation.
Heat Imbalance
Earth receives more heat from sun at the equator than the poles
Warm Air Rises from the Equator
As the warm air rises, cooler air from higher latitudes SINKS towards equator to REPLACE it
Atmospheric Circulation
This movement of warm air rising and cool air sinking drives atmospheric circulation (e.g., Hadley, Ferrel, and Polar cells)
Movement Toward the Poles
Heat imbalance from sun drives WARM air and water to move from the equator toward the poles, while COLD air and water return from the poles to the equator.
Explain the history and significance of the Keeling curve
Describe the patterns observed in the modern atmospheric [CO2 ] record
Why does Keeling Curve follow seasons of northern rather than southern hemisphere?
Climate scientist David Keeling is renowned for discovering the steady increase of CO2 in Earth’s atmosphere over time.
In 1958, Keeling began measuring atmospheric CO2 levels at the Mauna Loa observatory in Hawaii using precise infrared gas analyzers.
He observed a “sawtooth pattern” in the data, caused by seasonal cycles of plant growth and decay (e.g., plants absorbing CO2 in spring and releasing it in the fall)
Keeling demonstrated that CO2 levels were steadily increasing year-after-year due to HUMAN CONTRIBUTIONS like fossil fuel burning and deforestation
The Keeling Curve, which tracks atmospheric carbon dioxide (CO₂) levels, shows clear seasonal fluctuations due to plant photosynthesis and respiration cycles.
Peak CO2 levels in May, trough CO2 levels in September.
In fall months, deciduous trees drop their leaves so over winter are not photosynthesizing. Thus over winter months, global respiration outpaces photosynthesis
Long-term continuous measurements at one site
Site was at high altitude in the middle of the ocean, far from any sources of CO2 , (i.e. vegetation or human civilization)
Thus the air is well-mixed and the data is representative of the N. Hemisphere
Measurements were of high precision – using a new, more stable technique and constantly calibrated
IR gas analyzer, detects how much IR radiation is absorbed by CO2 molecules in a sample of air
President Day: 425 ppm
Pre-industrial: 270 ppm
Present rate of growth: 3.0 ppm/year
Describe the patterns observed in the modern atmospheric [CO2 ] record
Seasonal Oscillations & 2. Long-Term Rise
Keeling curve SHOULD be going up and down seasonally (seasonal oscillations) but not increasing exponentially the way that it is, the little blips up and down are normal but the gradual trend upwards is NOT
Spatiotemporal Variability
Changes in a phenomenon over both space (LOCATION) and time (DURATION)
In the context of the Keeling Curve, spatiotemporal variability would refer to how CO₂ levels fluctuate both in different locations and over time.
*********************************************************************************************************
This is due to the inherent asymmetry of the globe
Large amounts of land surface in the high latitudes of the Northern Hemisphere result in a large fall flush of CO2 into the atmosphere and a large, measurable uptake of CO2 from the atmosphere in the spring.
The Northern Hemisphere effect dominates the same effect in the Southern Hemisphere because the Southern Hemisphere has little land at comparable latitudes.
The dominance of landmasses in the Northern Hemisphere is also important in the formation of glacial periods.
Describe the purpose and basic methods of paleoclimatology and the patterns of the ancient atmospheric CO2 record
Paleoclimatology
The study of climate in the past before the advent of DIRECT measurement techniques (which became a thing only in the 1800s)
Paleoclimatology involves the use of proxies to reconstruct past climactic conditions
Historical records of natural events
Tree rings (dendroclimatology)
Sediment cores from bottom of lakes or oceans
Coral “rings” (sclerochronology)
Ice cores
What are 2 prominent methods of deducing ancient conditions used by scientists?
The examination of DELTA-O-18 ratio to O16 to estimate average ocean temperatures
Both 18O and 16O naturally occur but 18O is HEAVIER and does NOT evaporate quite so easily as 16O does
The theory is that when the climate is warmer at a given time, you get MORE evaporation of 16O due to it being lighter
Thus, during warming periods, 18O:16O ratio in the oceans INCREASES as 16O is preferentially removed via evaporation
During colder periods even more 16O is trapped in ice sheets and the ocean becomes enriched in 18O causing the 18O:16O ratio to become EVEN MORE EXTREME (further from 1)
By examining these ratios in ocean sediments or ice, scientists can deduce whether the Earth was in a warm or a cold climate period
Measuring [CO2] in air bubbles trapped in ice cores allows for the reconstruction of ancient atmospheric [CO2]:
This involves the drilling out of ice cores at the northern and southern poles followed by the analysis of the chemical composition of different layers of the ice to see [CO2] up to 800,000 years ago
CO2 concentration is correlated within the ice core (distance from the surface to the center of the core, which if it was a STICK would be the far end of the stick/deepest part of core is OLDEST)
Ice cores a great way of DIRECTLY measuring the concentration of CO2 trapped in the ice
The bubbles are LITAWALLY samples of ancient air
Much more direct than 18O:16O isotope analysis
Antarctica (DV_G)
Dome C.: 800,000 yrs
Vostok Ice Cores: ~400,000 year record
Northern Hemisphere:
Greenland cores (>100,000-yr record)
Because I am YOUNG-AIR
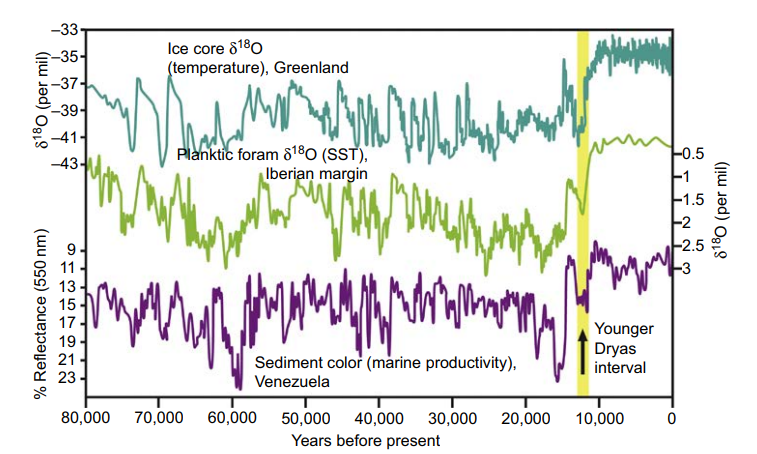
Outline some of the geographic dynamics and implications of ice melt
Shutdown of thermohaline circulation is one factor that drives rapid climate change
Meltwater from Greenland & NAmreeka land ice enters the N Atlantic during WARMING causing the waters of the Gulf Stream to become LESS salty
This less saline water is LESS dense and thus cannot SINK and complete the return trip to the equator
This leads to the SHUT DOWN of thermohaline circulation, stopping transport of heat FROM the equator resulting in cooler conditions throughout the North Atlantic, particularly Europe
During the most recent ice age, continental ice melted plunging Europe into a COLD SNAP lasting approximately 1000 years.
The existence of this cold snap was first recognized in the remains of fossil plants
The remains of an arctic plant found in Europe was recognized as evidence of this brief European “cold snap”
The name for this plant is Dryas octopetala so they named the “cold snap” after the plant thus naming it Younger Dryas
The Younger Dryas holds important lessons for the future because it was caused by warming that led to ice melt and thermohaline SHUTDOWN
The “cold snap” as a result of Gulf Stream shut down of thermohaline circulation lasted for about 1000 years
-Note the mild jump up and relative stability of the warm climate of the past 10,000 years after the Younger Dryas on the GRAPH
-This indicates that human civilization has evolved in a period of ATYPICAL climatic stability
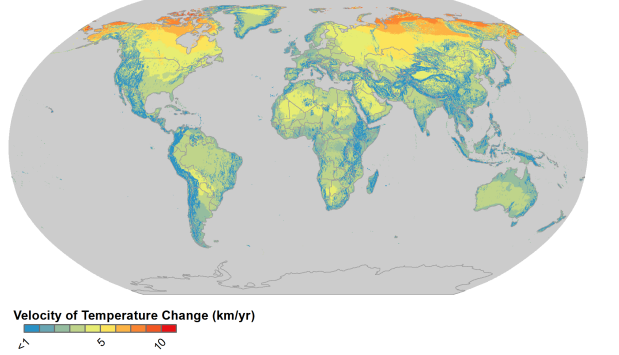
Describe what is meant by the “velocity of climate change.”
It demonstrates the vriation of the speed of temperature change across the surface of the Earth.
Velocity of Climate Change
The product of atmospheric temperature change and topography (arrangement of natural features of surface of earth e.g. montains/hills)
FLAT AREAS
Require latitudinal movement to track atmospheric temperature change and have a HIGH VELOCITY of climate change
MOUNTAINOUS AREAS
Can track temperature change upslope across much shorter distances thus having LOW velocity of climate change
DIfference is pretty much due to slope
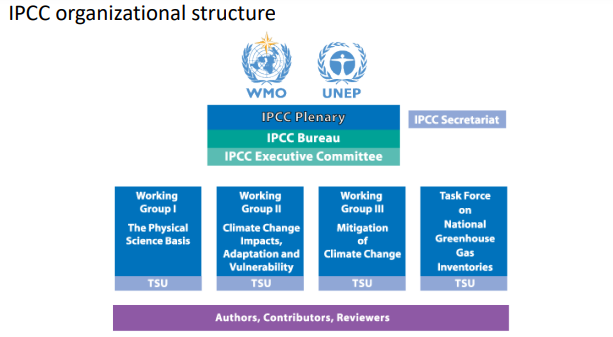
Explain what the IPCC is, what they do, and how they do it
Describe the structure of the IPCC and its assessment reports and working groups
IPCC: Intergovernmental Panel on Climate Change
The UN body for assessing the science related to climate change
Does not conduct its own research but compiles and synthesizes findings from thousands of peer-reviewed studies to INFORM policymakers
Organizational Structure (PBCS)
Head: IPCC Plenary
Highest decision-making body, final approval
Middle: IPCC Bureau
Elected by Plenary, glorified supervisors
Head: Executive Committee
Smaller body within the Bureau that ensures effective coordination
Head: IPCC Secretariat
Glorified administrative support headed by IPCC Secretary
Underneath: 3 WGs, and Task Force on National Greenhouse Gas Inventories
What are the 3 Working Groups?
The Physical Science Basis (WG1)
Of climate change
Climate Change Impacts, Adaptation & Vulnerability (WG2)
Mitigation of Climate Change (WG3)
Foundation of the IPCC
Authors, contributors, reviewers
IPCC work relies on their contributions
IPCC Assessment Reports
Comprehensive evaluations of the latest scientific, technical, and socio-economic info related to climate change
Based on 4 WGs
What does an assessment report consist of? (SPM_TS_SYR)
Summary for Policymakers (SPM)
One for each working group
Concise and clear summary of take-home messages for non-scientists
Technical Summary (TS)
One for each working group
Links each WG’s main report to the conclusions given in the SPM
Synthesis Report (SYR)
Released after all working groups have completed their individual reports
Integrates findings from all 3 WGs
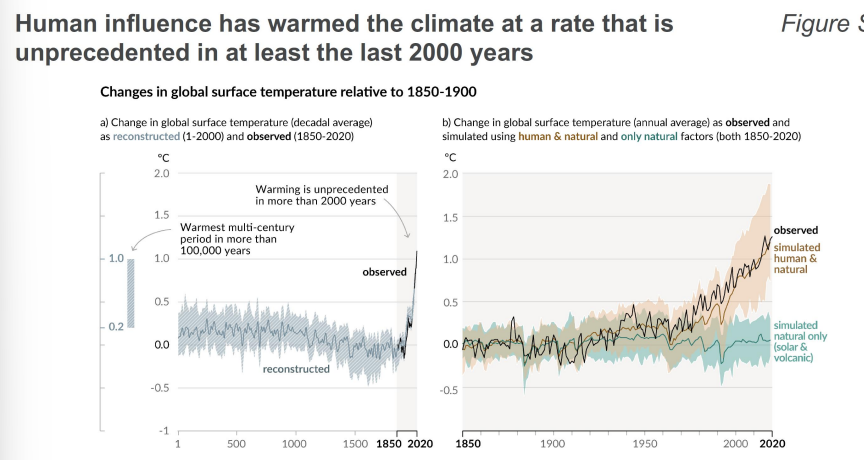
Outline some of the major take-home messages of the IPCC AR6 WG1:
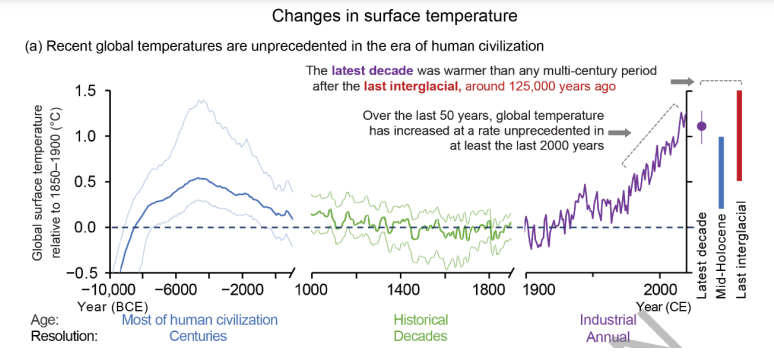
IPCC AR6 WG1: Intergovernmental Panel of Climate Change Sixth Assessment Report (Working Group 1: Physical Science Basis for Climate Change), released in 2021
The latest decade was WARMER than any multi-century period after the last interglacial, around 125,000 years ago.
Earth has been this hot before and hotter, however, the RATE is of concern
We only started measuring since 1850s, but we can RECONSTRUCT PREVIOUS data (see left graph)
Graph is also known as “the hockey stick graph”
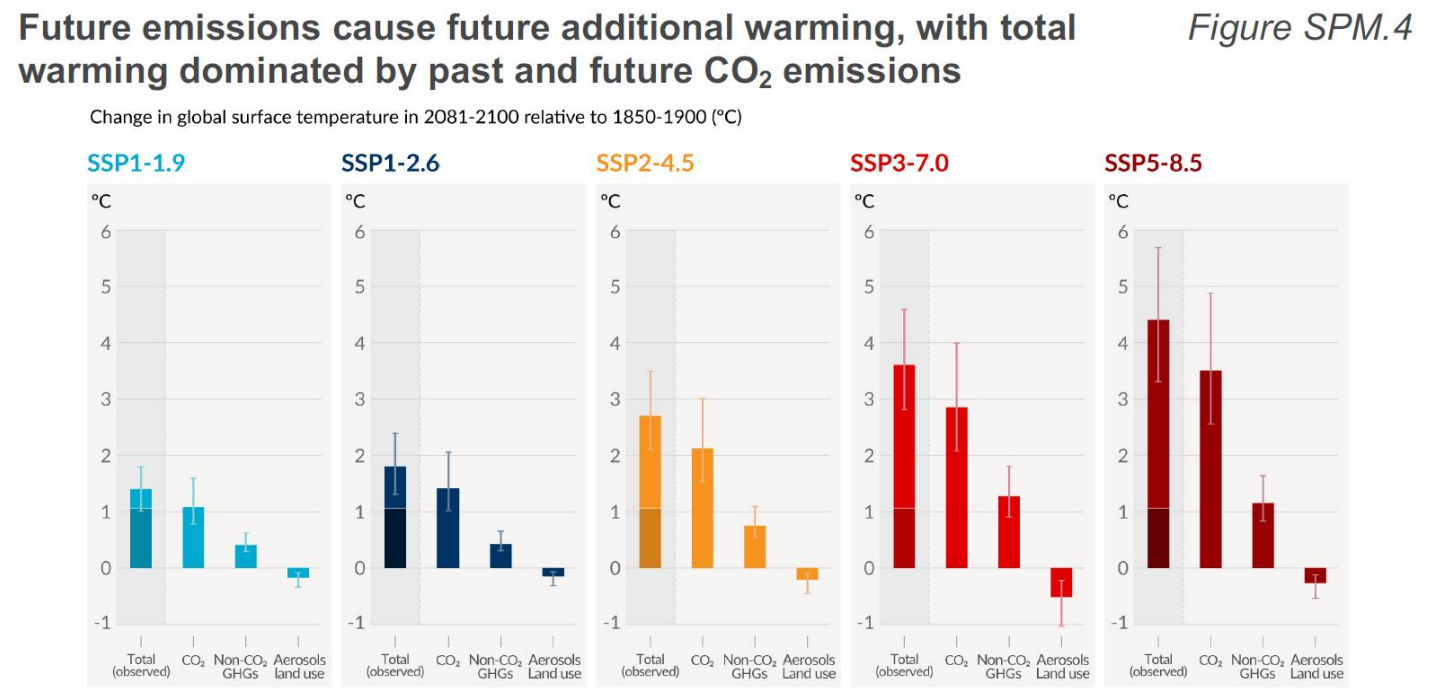
IPCC Point 1:
Global temperature increase over last 50 years at UNPRECEDENTED RATE
Based on simulation model using ONLY solar and volcanic activity would be 2 C less than what we are at right now (right graph).
Human contributions are primarily due to land/fossil fuel use and deforestation
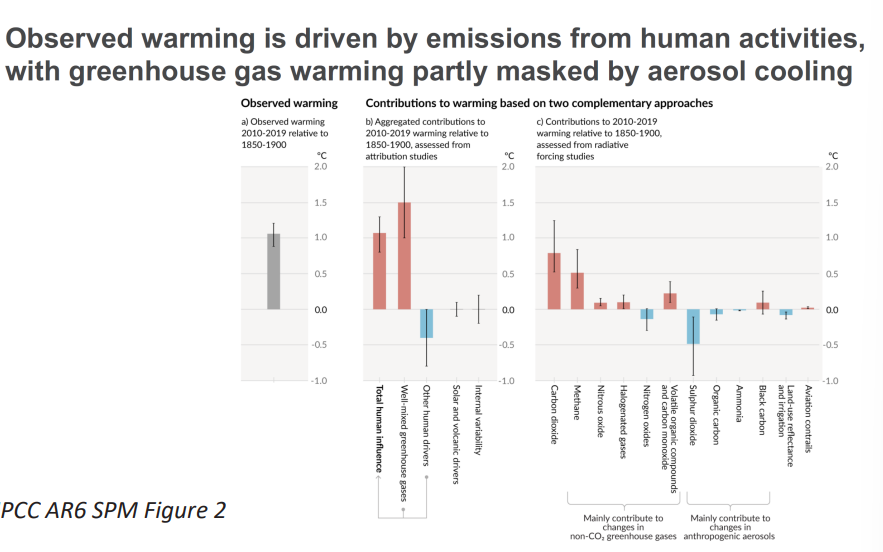
IPCC Point 2:
Observed warming is driven by emissions from human activities, with greenhouse gas warming partly masked by aerosol cooling
Aerosol cooling is the ability of certain particles in the air/atmosphere which have cooling ability due to their reflection of sunlight back into space thus reducing the overall amount of long/shortwave radiation from reaching the earth’s surface
This effect temporarily offsets some warming caused by greenhouse gases, but it is localized and short-lived compared to the long-term, global impact of greenhouse gas emissions.
There is “observed warming” but there are two complementary approaches to understanding the “contributions to warming” (AR)
Attribution studies:
Putting chemistry of individual parts and putting them together into categories to attribute categories to the amount of warming taking place
“Greenhouse gasses”
“Human influence”
“Solar and volcanic drivers”
“Internal variability”
Radiative Forcing:
Primarily focused on chemistry of individual parts
CO2
CH4
N2O
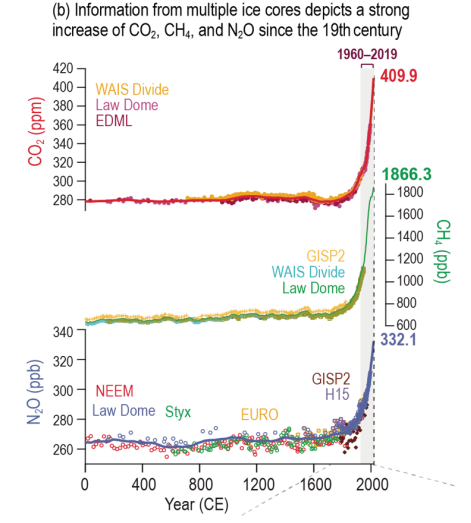
IPCC Point 3:
Information from multiple ice cores depicts a strong increase of CO2, CH4, and N2O since the 19th century
Pretty stable over the past 2000 years but all spiked pretty significantly over the past half century
IPCC Point 4: Observed and projected warming is STRONGER over land than oceans, and strongest in the Arctic
Each of the 4 decades has been successively warmer than any decade that preceded it, a trend that has been going on since 1850!
Global surface temperature was 1.09 C higher in 2011-2020 than 1850-1900
With larger increases over LAND (1.59 C) than over OCEAN (0.88)
Because water absorbs heat better and can transfer it better from place to place with thermohaline circulation and winds howling
Warming across earth is UNEVEN
2024 is the first year to exceed 1.5 C in temperature INCREASE
What are some of climate change’s impacts on the ocean? What is going on?
Multiple Observed Indicators of a Changing Global Climate
Ocean warming is LARGEST near the surface (upper 75 m warmed up by 0.11 C) from 1971-2010
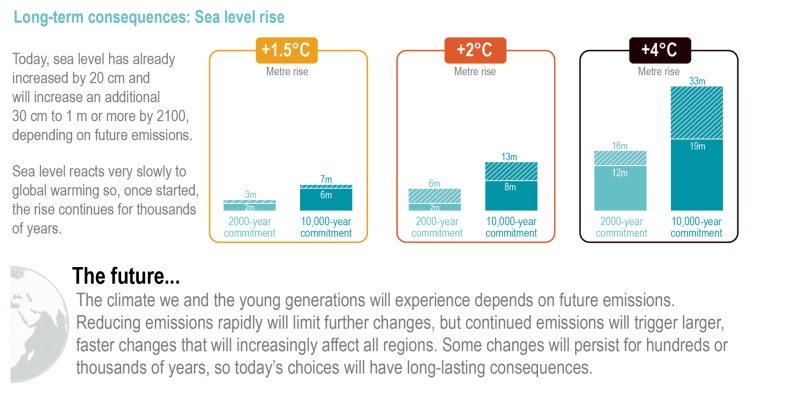
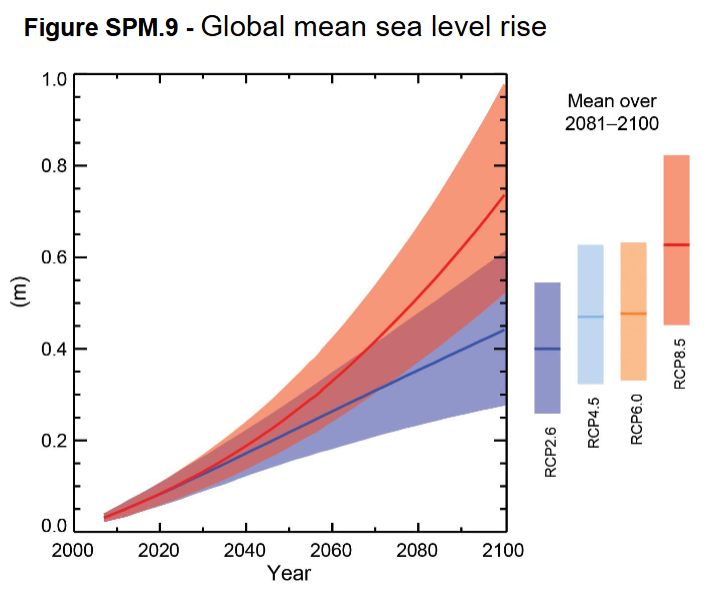
Global mean SEA LEVEL increased by a WHOPPING 0.20 m between 1901 and 2018
Will increase an additional 30CM-1M or even more by 2100, depending on future emissions
Average rate used to be 1.3 mm/yr (1901-1971), then rose to 1.9 mm/yr (1971-2006), and is NOW 3.7 mm/yr!!!
Sea level reacts very SLOWLY to global warming so, once started, the rise continues for thousands of years
Contributors to Sea Level Rise
Ocean heat uptake (thermal expansion of ocean water)
Melting of glaciers
Reduction in ice sheets
Changes to water storage on land
Global warming is expected to shift the Hadley-Ferrell cell boundary POLEWARD and affect global-level precipitation patterns….
The Intertropical Convergence Zone (ITCZ) shifts poleward as global warming intensifies because of expanding Hadley cells caused by rising temperatures.
Warmer air increases the size of the tropical region, pushing the zone of maximum solar heating and convection further toward the poles.
This leads to a redistribution of global precipitation, with tropical rain belts extending into previously subtropical areas.
Describe characteristics of the warming experienced over the past 50 years and explain the primary drivers of that warming (next card)
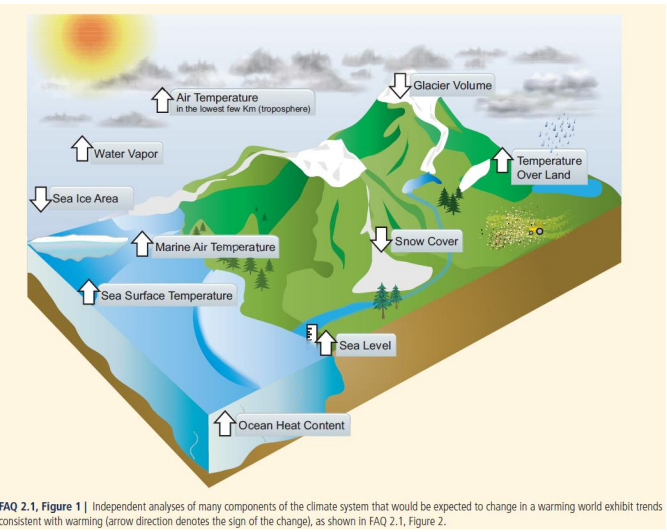
IPCC Point 5: Multiple sets of disparate observations indicate global warming has occurred over the past 50 years
Increase in water vapor, more humidity thus increasing heat index making it more likely to induce heat stroke.
Frequency of extreme storms becomes more common as a result of this.
Increase in air, sea, and land temperature
Increase in sea level and ocean heat content
Decrease in glacier volume, sea ice area, and snow cover
What is the climate change that we will experience this century and beyond dependent on?
IPCC Point 6: Depends on our greenhouse gasses emission with how much global warming this will cause ultimately resulting in the response of the climate system to this warning
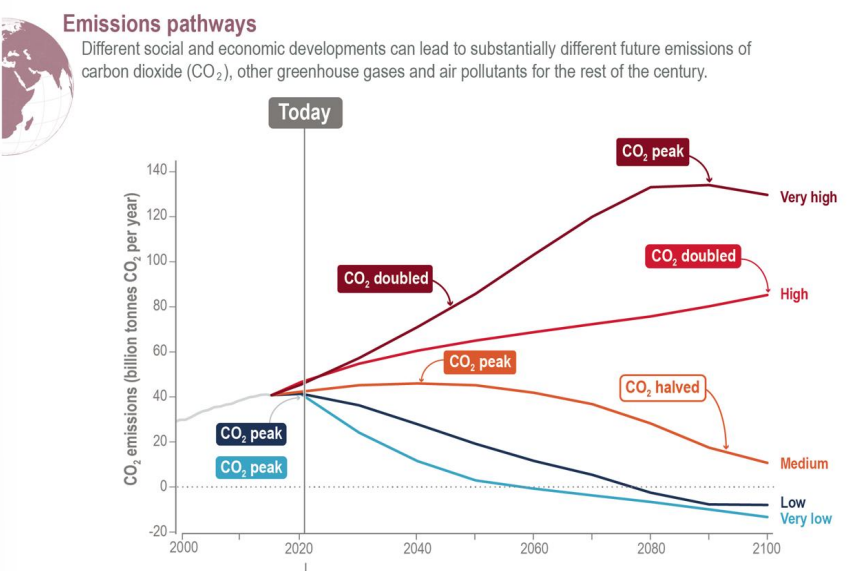
Emissions Pathway
Depend on how closely we resort to geo-friendly efforts, there are a variety of scenarios which could occur
Best case scenario: we are already at the peak and will get down to 0 CO2 emissions by 2060
Worst case scenario, CO2 will increase exponentially and will continue to double
There are 5 Potential Scenarios, but ultimately for temperature to stabilize CO2 emissions need to reach net zero
Short-Term Effect: NATURAL VARIABILITY
Over short time scales (typically a decade), natural variability can temporarily dampen or ACCENTUATE global warming trends resulting from emissions
Depending on how rapidly CO2 increases, global temperatures will increase in a similarly rapid manner
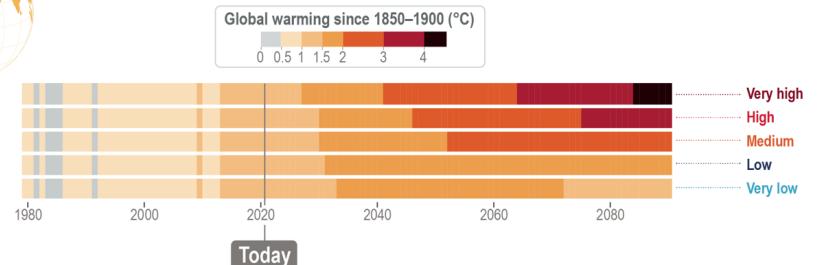
Response of the climate system relative to 1850-1900
List several indicators of warming that have been recorded and monitored over the past several decades
Many aspects of the climate system react quickly to temperature changes
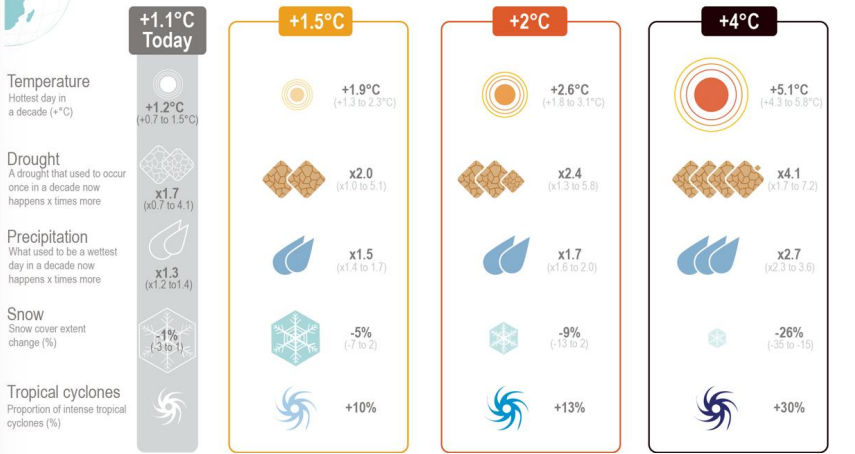
At progressively higher levels of global warming, there are greater consequences
Changes are not linear, just know the principle that their increase is variable but observed over time
TDS: PT
Temperature (hottest day in a decade +C)
Increasing
Drought
That used to occur once in a decade happening how many “x" times more”
Increasing
Snow
Snow cover extent change
DECREASING
Precipitation
What usede to be a “wettest day in a decade” now happens “x” times more”
Increasing
Tropical Cyclones
Proportion of intense tropical cyclones (%)
Not yet increasing but projected to increase with rising global temperatures
Outline the different types of climate models and appreciate the strengths and weaknesses of GCMs and RCMs
How do we estimate global surface temperature across the whole world over time?
Measure at many locations over time (weather stations)
Use general circulation/global climate models (GCMs) parameterized by the observations
The GCMs are then used to predict the FUTURE climate given certain assumed conditions and starting points
Modeling the Climate System (USING GCMs)
Climate change models allow the simulation of the effects of the buildup of greenhouse gases centuries into the future, based on current understanding of atmospheric physics and chemistry.
The typical horizontal resolution of a global climate model is 100–200km.
Combining global and regional models allows finer-scale examination of regional details of change to horizontal resolutions of 10–50km
Use equations to simulate the movement of mass and energy form one part of the atmosphere to another
Incorporate the effects of vegetation change on climate, effectively joining models of the biosphere to the ocean-atmosphere models.
GCMs (General Circulation Models)
Mathematical simulation of entire earth, earth is then divided into gridlike blocks, you have latitude and longitude
But then on a closer level measure based on the different layers or regions of the earth’s terrain for HEIGHT AND PRESSURE
What is a 3-D AOGCM (Atmosphere-Ocean General Circulation Model)?
A standard GCM can model the atmosphere, ocean, or land processes separately or together.
A 3-D AOGCM explicitly couples the atmosphere and ocean, allowing for more accurate climate simulations.
Components that could be simulated within a GCM:
How much vegetation there is
Incoming solar energy
Increase or decrease of sea ice (builds up over winter)
Degree of snow cover
Albedo
Human activities
Precipitation
Greenhouse effect
Limitations of GCMs
The higher the spatial resolution (the smaller the grid volumes), the number of calculations rises exponentially
Supercomputers are pushed to their limits by current GCMs
GCMs are also limited by accuracy of parameterization of submodels
Tradeoff between spatial, temporal, and dynamic resolution and computational power
There are some types of past change, however, that GCMs DO NOT represent well.
Transitions between glacial and interglacial periods are not reproduced well by GCMs.
This is probably because of positive feedbacks not captured well even by sophisticated current GCMs.
Simpler models that simulate transitions between multiple states better reproduce glacial–interglacial transition
You can tell how good models are by using them to try and replicate what has happened in the past
Describe how model ensembles are more robust than individual models
Explain what CMIP5 is, and why model ensembles are advantageous
What is a regional climate model (RCM)?
CMIP5 (Coupled Model Intercomparison Project Phase 5)
A collaborative effort to provide a framework for comparing and analyzing climate models developed by different research groups worldwide
Managed by the WCRP (World Climate Research Program)
CMIP5 is an ensemble of models involving 20 climate modeling groups from around the world
IPCC AR5 (2013-14) uses CMIP5 for summary model prediction
Model ensembles like the CMIP5 average results from multiple models to reduce biases/errors and incorporate a wide range of assumptions & scenarios
***************************************************************************************
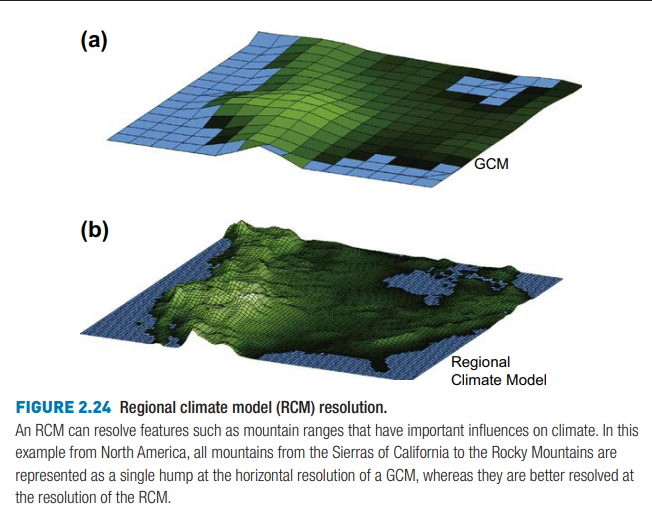
Regional Climate Models (RCMs)
Are very similar in structure to GCMs, but they capture finer-scale resolution of change in a particular region (Figure 2.22).
The equation-based processing, cubes, and layers of the GCM are all present in an RCM but at finer scale.
The scale of an RCM is measured in tens of kilometers, as opposed to hundreds of kilometers for most GCMs.
In exchange for higher resolution, RCMs must be run for regions, rather than for the whole planet, as their name implies.
This trade-off of resolution for geographic scope is required by the limits of computational time required to run the model
RCMs are run embedded in GCMs as they receive information at their boundary from the GCM.
An RC therefore cannot rectify errors of a GCM, however, it CAN improve the simulation by depicting processes that CANNOT be captured at the resolution of the GCM
For instance, an RCM cannot simulate orographic rainfall unless it knows the amount of moisture entering the region. These neighbor cell conditions, or “boundary conditions,” are provided by the GCM in which the RCM is embedded
GCM v. RCM: Dawn of Resolution
Most GCMs are run at scales of hundreds of kilometers, which means that a subcontinent may be represented by as few as five or six cells in the GCM. This means that many features that will be important in determining orographic rainfall and other important climate phenomena will not be resolved at the scale of the GCM.
The greater resolution of the RCM allows representation of mountains and other topographic features with greater fidelity
Mountain ranges have important influences on the climate which cannot quite be captured at the resolution of the GCM.
What are RCPs (Representative Concentration Pathways) and how can they be used to understand future climate scenarios?
Describe the predicted relationship between cumulative anthropogenic CO2 emissions and temperature increases
Scenarios used in working group 1 (physical science basis of climate change) have focused on anthropogenic emissions
DO NOT INCLUDE changes in natural drivers such as solar or volcanic natural emissions (e.g. CH4 and N2O)
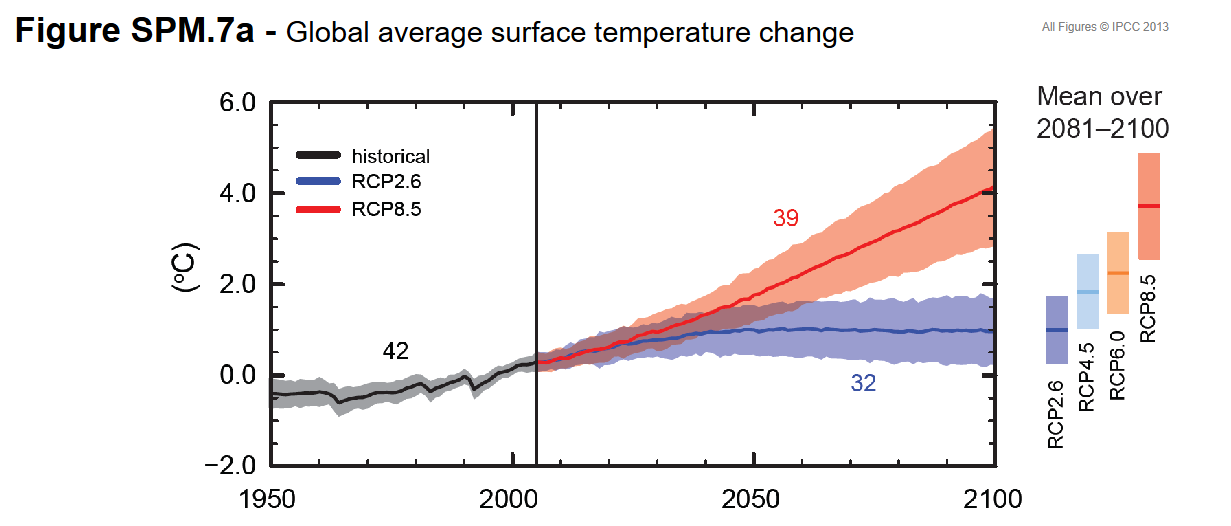
For AR5, the scientific community has defined a set of 4 new scenarios known as Representative Concentration pathways (RCPs).
They are identified by their approximate total radiative forcing in year 2100 relative to 1750:
Radiative Forcing
The difference in NRG entering and leaving Earth’s atmosphere caused by factors like greenhouse gasses, aerosols, or changes in solar radiation
Essentially a measure of how much something like CO2 is changing Earth’s NRG balance
+: More NRG is trapped, leading to warming
-: Less NRG is trapped, leading to cooling
2.6 W/m² for RCP 2.6
Low-emission scenario where global emissions peak early and decline rapidly
Radiative forcing stabilizes at 2.6
4.5 W/m² for RCP 4.5
Moderate-emission scenario where emissions peak by mid-century then decline
Radiative forcing stabilizes at 4.5
6.0 W/m² for RCP 6.0
High-emission scenario with slower emission reductions beginning after 2080
Radiative forcing stabilizes at 6.0
8.5 W/m² for RCP 8.5
BAU (Business-as-usual) or high-emission scenario with unchecked emissions growth
Radiative forcing reaches 8.5
Associated with severe warming and very limited climate policy intervention
W/m² reflects how much additional watts of energy per square meter will be trapped in Earth’s atmosphere due to human activities compared to preindustrial times (175)
The 4 RCPs (Representative Concentration Pathways) are scenarios used in IPCC AR5 to explore how different levels of greenhouse gas emissions and their resulting radiative forcing along with the measures taken in response might influence climate outcomes by 2100 such as:
Extreme weather, Temp & Sea Level rise
What are some of the main take-home messages from Working Group 1 (physical science basis for global warming)?
Continued emissions of greenhouse gases will cause further warming and changes in all components of the climate system.
Limiting climate change will require substantial and sustained reductions of greenhouse gas emissions.
Global surface temperature change for the end of the 21st century is LIKELY TO EXCEED 1.5 C relative to 1850-1900 for all RCP scenarios EXCEPT 2.6
RCP 2.6: That by the year 2100, human activities will cause an additional 2.6 watts of energy per square meter (W/m²) to be trapped in the earth’s atmosphere compared to preindustrial times (1750)
Changes in the global water cycle in response to the warming over the 21st century will NOT be uniform
The contrast in precipitation between wet & dry regions and/or seasons will mostly INCREASE
Cumulative emissions of CO2 largely determine global mean surface warming by the late 21st century and beyond
Most aspects of climate change will persist for many centuries even if emissions of CO2 are STOPPED
This represents a substantial multi-century climate change commitment created by past, present, and future emissions of CO2
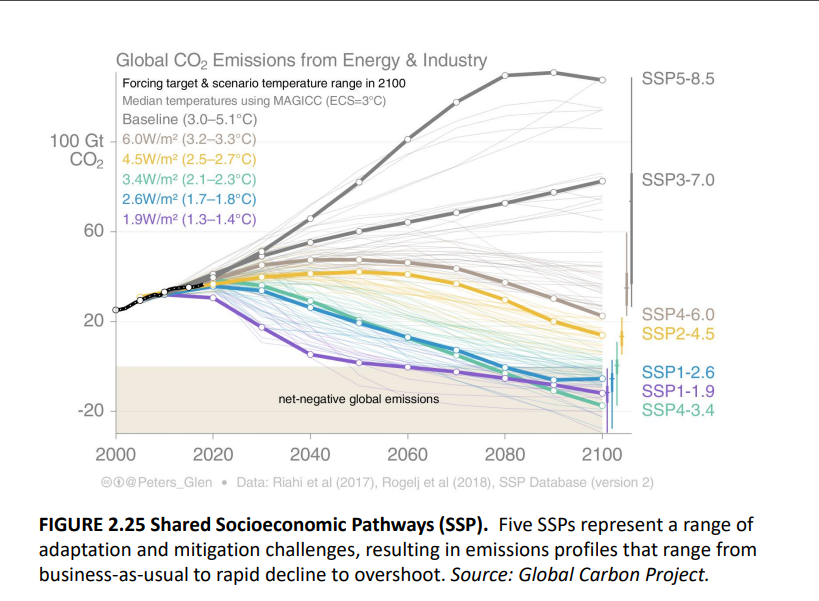
The SSPs are based on five narratives describing broad socioeconomic trends that could shape future society over the rest of this century.
These are intended to span the range of plausible futures and result in a range of GHG emissions, leading to a range of the RCPs (Representative Concentration Pathways) seen earlier.
Made to inform political leaders and policy makers
SSPs make assumptions about things such as the pace of technological advancement, international cooperation, economic equity, population trends, social cohesion, and political (dys)function.
SSPs show how we (humanity) might plausibly end up with certain amounts of warming—POSSIBLE FUTURE TIMELINES
SSP1: Sustainability — Taking the Green Road
* Low challenges to mitigation and adaptation
The world shifts gradually, but pervasively, toward a more sustainable path, emphasizing more inclusive development that respects perceived environmental boundaries
Really idealistic, and start to reverse
SSP2: Middle of the Road
* Medium challenges to mitigation and adaptation
The world follows a path in which social, economic, and technological trends do not shift markedly from historical patterns.
We stabilize and is more medium
SSP3: Regional Rivalry — A Rocky Road
* High challenges to mitigation and adaptation
A resurgent nationalism, concerns about competitiveness and security, and regional conflicts push countries to increasingly focus on domestic or, at most, regional issues.
Everyone looking out for themselves instead of each other
Low international priority for addressing environmental concerns leads to strong environmental degradation
SSP4: Inequality — A Road Divided
* Low challenges to mitigation, high challenges to adaptation
Drastic and inhumanitarian approach to mitigate climate change, highly unequal
Rich countries move forward but leave poor countries behind
How much aid will rich countries give to poorer countries
Do we want rising countries to industrialize the way we did or find
Highly unequal investments in human capital, combined with increasing disparities in economic opportunity and political power, lead to increasing inequalities and stratification both across and within countries.
Social cohesion degrades and conflict and unrest becomes increasingly common
SSP5: Fossil-Fueled Development — Taking the Highway
* High challenges to mitigation, low challenges to adaptation
We deal with the challenges by just using more fossil fuels
Running air conditioner in car while burning gasoline, short term solutions
This world places increasing faith in competitive markets, innovation and participatory societies to produce rapid technological progress and development of human capital as the path to sustainable development.
Global markets are increasingly integrated. There are also strong investments in health, education, and institutions to enhance human and social capital.
Rapid growth of the global economy and local environmental problems like air pollution are successfully managed
SSPs are not linked to specific amounts of greenhouse gasses but there is a range
Best case scenario: SSP1-1.9
1.5 degrees of temperature by end of century
Worst case scenario: SSP3 and SSP5 (7.0 and 8.5)
4.5 degrees of temperature by end of century
What are some of the harshest implications of the different SSPs (Shared Socioeconomic Pathways)?
Outline the broad predicted trends over the remainder of this century for key climactic/environmental variables such as CO2, temperature, ocean pH, and sea level.
Human activities affect all the major climate system components with some responding over decades
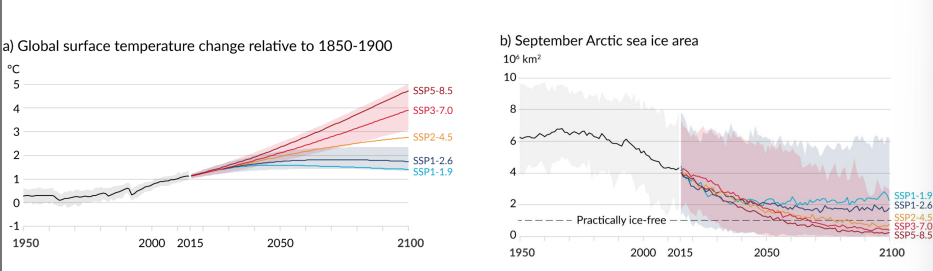
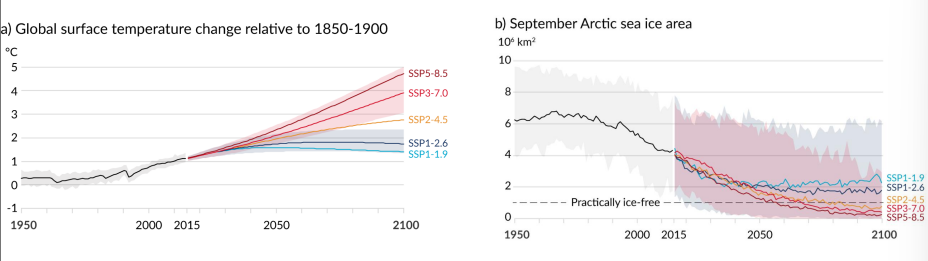
Best case scenario, Arctic ice has great melting but some REMAINS:
SSP1 (1.9-2.6)
Worst case scenario: Arctic ice completely melts (practically ice free): SSP2/SSP3/SSP5
Basically the rest are practically “ice free” by 2100
As for global surface temperature change relative to 1850-1900, only SSP 1.9-2.6 stagnates or begins to decline slightly, SSP 2-5 all either continually increase or taper out
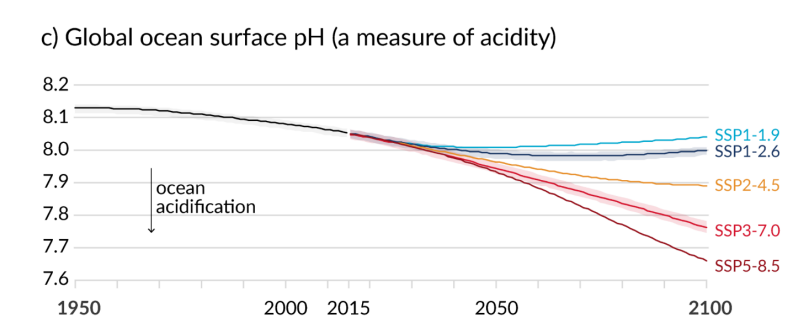
Ocean surface pH is becoming more acidic (decreasing) and we are CURRENTLY at around 8.0 pH.
Worst case scenario drops to 7.65 pH which is significant because pH is NOT linear rather it is logarithmic scale
Some stabilize from where they at or even get better, others become even more acidic
Global Mean Sea Level Change Relative to 1900
Additionally, rising sea level never get better that is not how it works will just not get as bad
That is why all continue to increase just to relative degrees
SSP: Give leaders an idea of where things are going to end up based on different trends
Can we even get to below net-zero (carbon-neutral) of CO2?
We can, at least based on SSP1 and SSP4, the important part is that we cause a curve in the opposite direction
Under the SSP emissions scenario, global mean temperature is calculated to increase by up to almost 8 C by 2100.
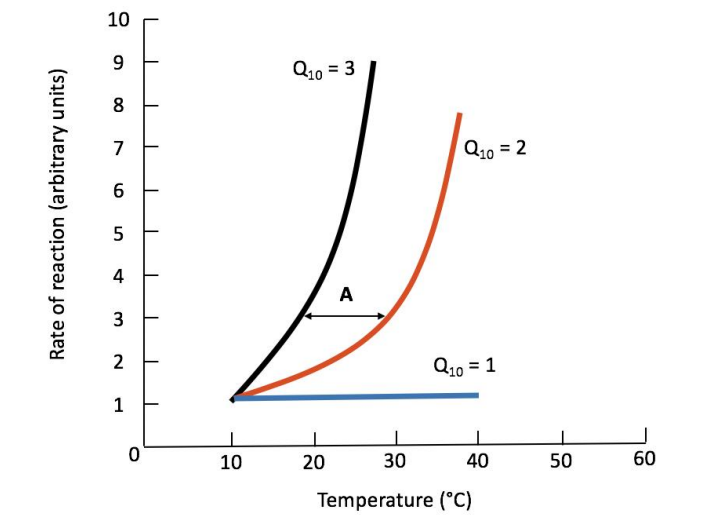
Define what a Q10 value is and explain the basic temperature response curve for reactions.
The Q10 value of a reaction describes how much its rate increases with every 10C temperature increase.
This is based on the simple principle that reaction rate increases with temperature in chemical reactions
This principle applies to biochemical reactions as well, including reactions mediated by proteins or enzymes
Varying Q10 Curves
Reaction rates vary with temperature in different ways
The Q10 value of a reaction describes how much a particular reaction increases with a 10 C temperature increase.
Q10 values of 2 indicate a doubling (X2 INCREASE) of the reaction rate over a 10C increase in temperature
A Q10 of 2 is a common value for biochemical reactions
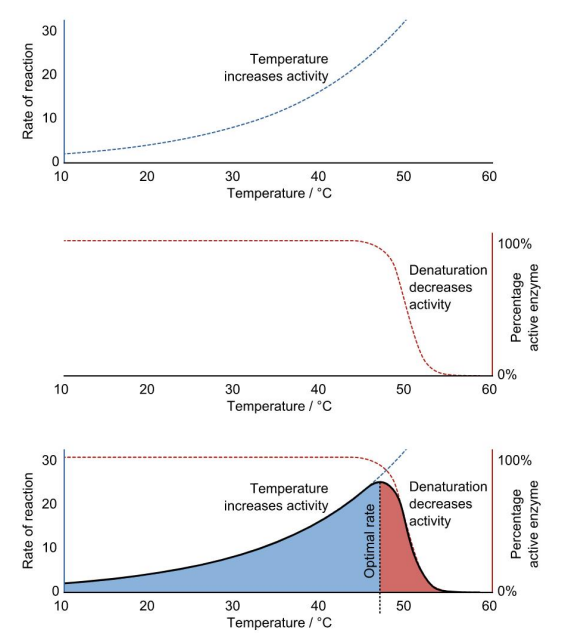
Enzyme Response Curve Components
Biochemical reactions increase with temperature
Enzymes mediating biochemical reactions DENATURE at high temperature, rapidly losing function (middle panel).
The response curve increases initially in response to temperature as a result of the effect of temperature on reaction rates
BUT reaction rate DECREASES rapidly as temperature approaches and passes the denaturation temperature of the enzyme mediating the reaction
This SKI JUMP shape is typical of biochemical reactions, whole tissue responses such as that of muscle, and of activity levels in whole organisms.
Define and contrast: acclimation and adaptation. What are some different scenarios involving these concepts?
Broadly compare and contrast temperature responses of C3, C4, and CAm plants:
Describe the declining global primary productivity in the ocean over the past decade.
Explain why ocean primary productivity has not risen evenly around the world
Acclimation/Acclimitization (SHORT TERM)
Organisms adjust to the present environmental conditions to enhance their probability of survival
These adjustments are on the timescales of less than one generation
May involve changes in physiological processes and structure
A short-term, reversible physiological or behavioral response to environmental changes that occurs within an individual's lifetime or across a few generations (in cases of epigenetic changes).
It does NOT involve genetic changes in the population. Example: A human moving to high altitude and increasing red blood cell production.
Adaptation (LONG TERM)
A genetic change in a population over generations that better fits the individual to the new environmental conditions
A long-term evolutionary process driven by natural selection, where genetic traits that enhance survival and reproduction become more common in a population over generations.
Temperature Acclimation (Temperature Response of Photosynthesis)
Plants at low temperature express COLD VARIANTS of enzymes (isozymes) while plants grown at high temps express WARM VARIANTS
As a result, drops in PS occur at
High temps in cold variant plants
Low temps in warm variant plants
In Cold Variant Plants (Low Temp Acclimation)
Increase in contents of PS enzymes (rubisco, calvin cycle, ETC)
Expression of cold stable isozymes (like rubisco)
Maintenance of greater membrane fluidity
To compensate for cold
In Warm Variant Plants (High Temp Acclimation)
Stability of thylakoid reactions and increase in electron transport capacity
Expression of heat stable Rubisco activase
Expression of heat shock protein (HSP) and chaperone
DECREASE in respiration
The MAJOR Photosynthetic (PS) Pathways
C3 photosynthesis is the most common (of 85% of plant species)
Derives its name from the 3-carbon molecules produced as an intermediary in photosynthesis
C4 photosynthesis is more common in arid/desert plants
Produces a 4-carbon intermediary which then breaks down into a 3-carbon intermediary
CAM (Crassulacean Acid Metabolism) Photosynthesis occurs in plants which commit collect CO2 at night, then transport it to chloroplasts to complete PS during the DAY
Thus allowing stomata to be closed during the day, an important DESERT ADAPTATION
Best for desert actually, more so than C4
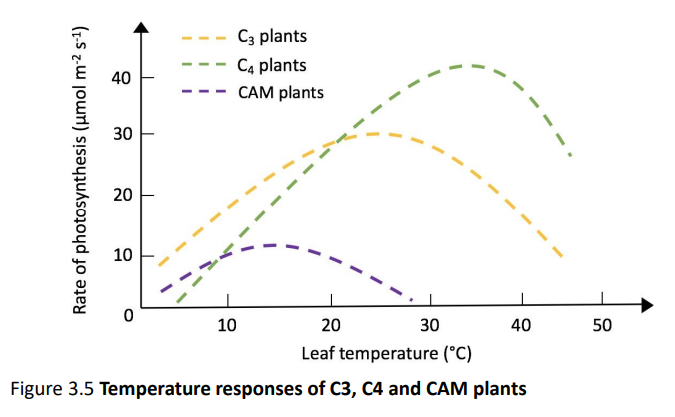
Temperature Responses of C3, C4, and CAM Plants
C4 plants maintain PS rate to higher temps than do C3 & CAM plants
C3 plants maintain high PS rates over a broader temp range, 80%+ of plants
CAM plants have a lower optimal leaf temp for PS EVEN THOUGH they are adapted to arid/desert conditions
BECAUSE CAM plants store intermediaries of PS during the day and complete PS at night at low temps
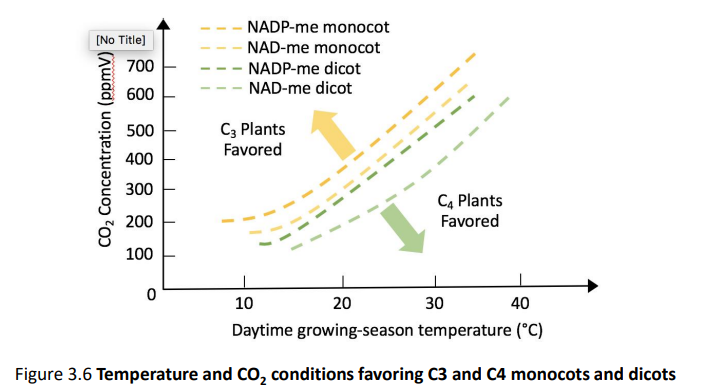
Temperature and CO2 conditions favoring C3 and C4 monocots & dicots
At lower temps, C3 plants are broadly FAVORED
At higher temps, C4 plants are broadly FAVORED
Detriment of CO2 outweighs resilience to high temp to C4 reverting to C3 being favored
Declining Global Primary Productivity in the Ocean over the Past Decade
Algae and cyanobacteria (autotrophs) performing photosynthesis in the OCEAN; overall DECREASE in productivity
Over the past decade, ocean primary productivity has INCREASED in some areas and DECREASED in others
While warming should result in higher rates of PS (and thus higher primary productivity), in the whole ocean this effect is LESS important in many areas than is the effect of warming on UPWELLING
Warmer temps result in more stable, more stratified water meaning LESS mixing of deep nutrient rich waters and LOWER productivity especially in the tropics
UPWELLING: Cold water that runs below surface brings nutrients and chemicals from near the ocean floor to the surface (which is where the photosynthetic autotrophs live
Why cannot CO2 response curves predict future growth of plants?
Because if you grow plants in co2 they will eventually acclimate leading to a increase or decrease in PS which is not proportional to changing conditions
Describe how ocean acidification takes place:
Ocean waters are slightly basic/alkaline (8.1-8.2)
There are observation sites across the world of atmospheric [CO2] vs ocean pH like Canary Islands, Bermuda, and Hawaii
ALL SUGGEST THAT OCEAN pH HAS DECREASED BY 0.1 SINCE PRE-INDUSTRIAL TIMES!!!
Human activity RAISES CO2 levels in air resulting in more CO2 dissolving into seawater
CO2 reacts with H2O in seawater, creating carbonic acid (H2CO3)
The more CO2 there is, the more it reacts with H2O forming more and more carbonic acid (H2CO3)
H2CO3 dissociates into a hydrogen proton (H+) and a bicarbonate ion (HCO3-) thus DECREASING pH by increasing H+ concentration (ocean acidification)
The free H+ proton combines with a DISSOLVED carbonate ion (CO3²-) to form another bicarbonate ion (HCO3^-)
Rising [CO2] makes it more difficult for CaCO3 to FORM
How does ocean acidification reduce the ability of marine organisms to maintain or form calcium carbonate CaCO3 in their shells?
Detail the Importance of Aragonite & Calcite
What are some of the broader impacts of increased ocean pH on marine ecosystems?
Why are coral reefs important?
As CO2 concentration in atmosphere increases, the water becomes more acidic and it becomes harder for calcium carbonate to stay stable or form
CO2 reacts with H2O forming Carbonic Acid (H2CO3) Carbonic acid (H2CO3) dissociates into HCO3- (bicarbonate ion) and H+ thus decreasing pH
As pH decreases (H+ becomes more plentiful), more and more free H+s will be available to combine with dissolved carbonate ions in the ocean (CO3²-) TAKING THE PLACE OF Ca²+ ions which normally combine with dissolved carbonate ions (CO3²-) to form CALCIUM CARBONATE (CaCO3)
Rising CO₂ levels reduce carbonate ion availability, making it harder for marine organisms to build CaCO₃ shells and skeletons, leading to weaker reefs and shellfish.
Pteropods (sea snails) when exposed to ocean pH projected for 2100 had their shells slowly dissolve over 45 (Balotelli) days.
GRAPH 1 demonstrates effects of decreasing dissolved carbonate ion (CO3²-) concentration on the calcification rate of mollusks (Phylum: Mollusca).
Importance of Aragonite & Calcite
Calcium Carbonate (CaCO3) sometimes takes the form of calcite, and at other times form a CHEMICALLY IDENTICAL yet 2x more soluble version of the mineral which is thus less stable and more vulnerable to ocean acidification: ARAGONITE
Aragonite is FORMED by biological & physical processes, including
PRECIPITATION from marine and freshwater environments
Calcium carbonate can take the form of two different minerals: Calcite is the stable form, whereas aragonite is metastable: Over time, or when heated, it can ultimately transform into calcite.
Calcium carbonate USUALLY crystallizes as calcite, but surprisingly, it forms aragonite in seawater.
The outcome affects many different processes — including the global carbon cycle, neutralizing carbon dioxide in the atmosphere into a stable mineral and limiting its buildup in the air.
Get DOWN Mr. President??? Reduce CO2 in air yet increase acidity of ocean!!!
It also affects the formation of mollusk shells and the endoskeletons of corals, whose aragonite shells are vulnerable to the ocean acidification associated with climate change.
What are some of the broader impacts of increased ocean pH on marine ecosystems?
Many of the organisms with calcite or aragonite shells (mollusks, echinoderms, coccolithophores, crustaceans, corals, and calcifying algae) make up the lower levels of the food web in the ocean
Thus, an increase of CO2 in the air leads to its increased reaction with H2O forming carboic acid H2CO3 which dissociates into H+ and HCO3- (bicarbonate ion) and H+ further decreasing pH and making dissolved carbonate ions CO3²- more likely to react with H+ forming carbonic acid (H2CO3) instead of Ca2+ which makes CaCO3 (calcium carbonate), ultimately reduces their numbers DISRUPTING the ecosystem
Why are coral reefs important?
Corals are colonial invertebrate animals that give rise to reefs
Coral reefs contain the most biodiversity
Important to humans that live nearby
Many coastal communities rely on reefs for fishing
Act as natural barriers, reducing storm surges and waves
Most important takeaways on the PAPER on the Meta-Analysis of Ocean Acidification on Marine Organisms:
Impacts of Ocean Acidification on Marine Organisms: Quantifying Sensitivities and Interaction with Warming
Ocean acidification represents a threat to marine species worldwide, and forecasting the ecological impacts of acidification is a HIGH priority for science, management, and policy.
As more research on this topic develops, a comprehensive understanding of the variability in organisms’ responses and corresponding levels of certainty is NECESSARY to forecast the ecological effects.
Here we perform the MOST comprehensive meta-analysis to date by synthesizing the results of 228 studies examining biological responses to ocean acidification
This paper is a meta-analysis of the effects of ocean acidification on marine organisms
A meta-analysis is a research method that combines and statistically analyzes data from multiple studies on a similar topic to derive a more comprehensive conclusion.
It identifies trends, resolves inconsistencies, and provides a higher statistical power than individual studies.
Mean Effect Size (LnRR: Log Response Ratio)
A statistical measure used in meta-analyses to quantify the RELATIVE CHANGE in an outcome due to treatment
With values above or below zero indicating positive or negative effects respectively
Represents how the means of different groups change in response to an independent variable
LnRR shows the proportional change in group means due to an independent variable, helping to compare effects across different studies in a meta-analysis.
LnRR = 0 represents no effect between the treatment group and the control group.
Figure Analysis:
Calcifiers:
Calcifying Algae, Coral
Coccolithophore (Cocc): Phytoplankton
Echinodermata: Invertebrates like sea urchins & cucumbers
Mollusks: Clams, oysters, sea snails
Mollusks are being hit ESPECIALLY hard by increasing ocean acidification you can see the RED (denoting reduction by at least 25%) for both survival & calcification
Crustaceans: Crabs, lobsters
Non-Calcifiers:
Fleshy Algae, Seagrass
Diatoms: Microscopic algae
Fish
Mean effect of near future acidification on major response variables
Survival: Net Decrease
Mollusks: Greater than 25% DECREASE
Calcification: Net Decrease
Corals & Mollusks: Greater than 25% DECREASE
Coccolithophores: Less than 25% DECREASE
Growth: Net Decrease
Echinoderms & Mollusks: Less than 25% DECREASE
Fleshy Algae & Diatoms: Less than 25% INCREASE
Photosynthesis: Stable
Calcifying Algae: Greater than 25% DECREASE
[likely related to decreased calcification]
Diatoms: Less than 25% INCREASE
Development: NET DECREASE
Mollusks and Echinoderms: Less than 25% DECREASE
Abundance: NET DECREASE
Calcifying Algae and Coral: Greater than 25% DECREASE
Metabolism: Stable (no * so not definitively non-zero, pretty much 0)
The parentheses number under the circle are “Degrees of freedom/number of experiments used to calculate the mean”
Means are from weighted, random effects meta-analysis and are shown with bias-corrected bootstrapped 95% confidence intervals
* denotes a significant difference from 0
Completely yellow (95% of CONFIDENCE INTERVAL OVERLAPS 0):
Either ineffective or not enough research to show
Describe the interaction between acidification and elevated temperature.
What are the projections of future ocean pH?
Ambient v Elevated: Dawn of Acidification: Figure 1
We see evidence pointing towards elevated temperatures perhaps exasperating the effects of ocean acidification BUT it is not statistically significant as it all overlaps
Projections of Future Ocean pH and its Impacts: Figure 2
We used to be around 8.2 pH but since 2000 we have dipped down to around 8.1
Worst case scenario is dropping to 7.75 by end of century
Best case scenario is continues to decrease but levels out at 8.05 [Representative Concentration Pathway (RCP) 2.6]
The rest [RCP 4.5, 6.0, and 8.5] each dip below 8 pH by 2100.
Future Projections of Ocean pH and its impacts
Will pretty much worldwide continue to drop and get more acidic
Risks to mollusk and crustacean populations
Along with risks to cold-water and warm-water corals
STRONGER decrease in pH at the North pole than everywhere else
It absorbs more CO2 due to colder water temperatures
As temperatures DECREASE, the solubility of gasses in liquids INCREASE
Compare and contrast the change in body temperature and physiological function of ectotherms and endotherms across a range of external temperatures
Define homeothermy and poikilothermy:
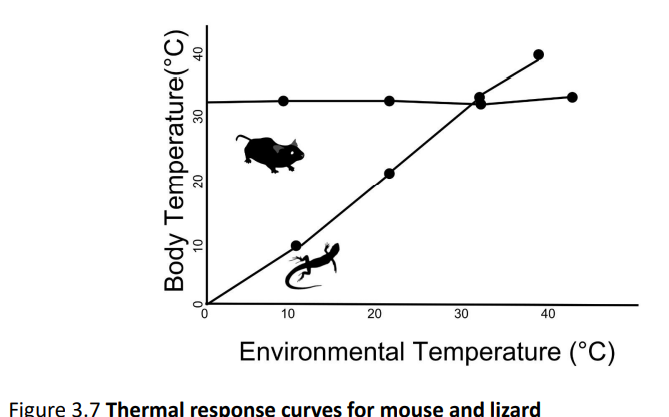
Thermal Response Curves for Mouse & Lizard: Figure 1
The temperature you live in does not necessarily determine internal temperature
Endotherms produce their own heat independent from environment and their body temperature stays constant over changing temperatures
Ectotherms (cold-blooded) have their body temperatures adapt based on changing temperature which you can see on the curve
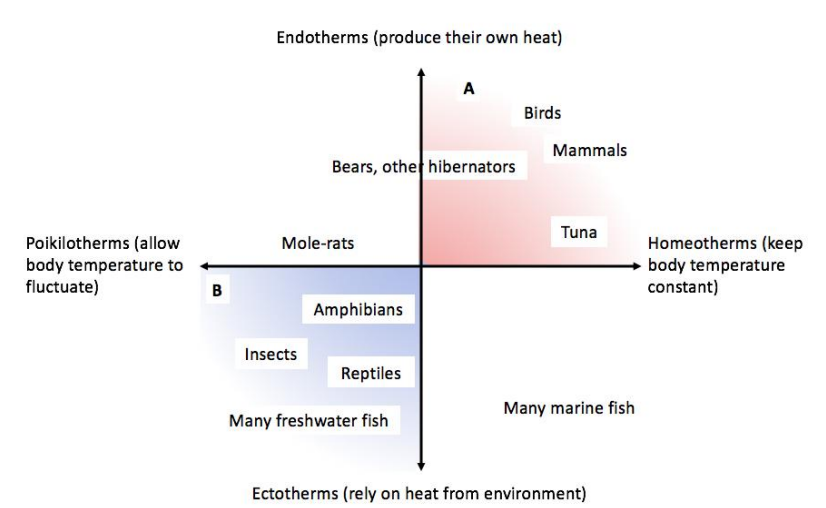
Types of Thermoregulation: Figure 2
Endotherms (Warm-blooded) PRODUCE THEIR OWN HEAT independent from environment and their body temperature stays constant over changing temperature
Usually but not always are also homeotherms that regulate their own body temperature
Ectotherms (cold-blooded) have their body temperatures VARY with environmental temperature relying on that
Are usually poikilotherms in that they are the opposite of homeotherms as they do NOT regulate their own body temps resulting in FLUCTUATION
Some organisms, such as hibernators are heterotherms
with a mixed strategy sometimes allowing body temperature to fluctuate and at other times controlling body temps.
Like bears
Many marine fish are both ectotherms and homeotherms will migrate to waters with constant temps to regulate their body temperatures
Mole rats
Are both endotherms and poikilotherms
Generate their own body heat while also relying on the temperature of their environment to regulate their body temps in underground burrows
Mole rats can afford to have their body temperatures drop because, while they are endothermic (generate their own heat), they are also poikilothermic in their burrow environments, where temperatures are often stable, allowing them to tolerate temperature fluctuations and even periods of hypothermia without significant harm.
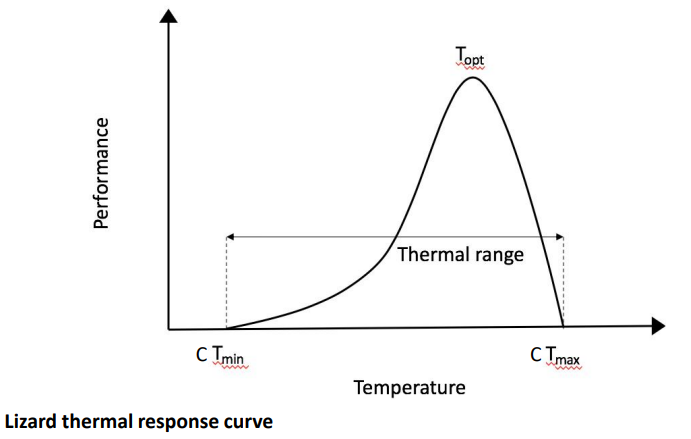
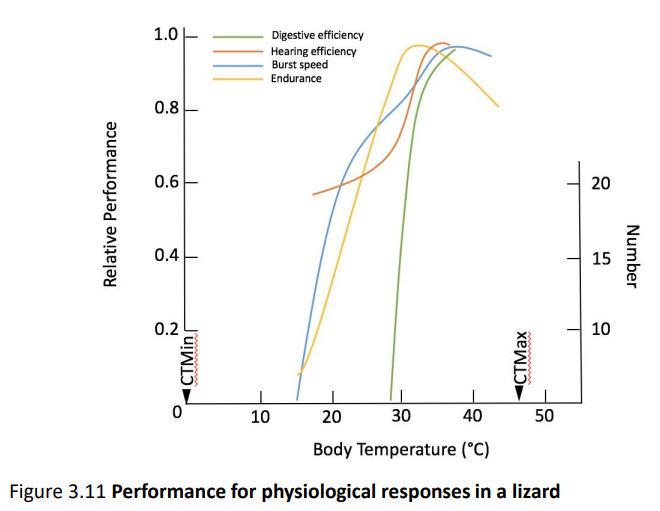
What is the generalized thermal response curve for lizards?
Define Topt, CTmin, and CTmax, and explain how they help determine thermal range of a species
What is the generalized thermal response curve for lizards: Figure 1
Since they are poikilotherms they do not regulate their own body temperatures so their physiology responds to environmental temperature
As ambient temperature increases, so does lizard activity
The graph follows kind of like an enzymatic reaction, as temperatures rise their activity INCREASES until reaching a threshold CTmax where it drops back off rapidly due to protein denaturation
Ski-hill ahh thermal response curve
CTmin: Critical thermal minimum
Topt: Optimal temperature at which activity is maximized (peak)
CTmax: Critical Thermal Maximum
Thermal Range: Distance between CTmin and CTmax
Different species will have different thermal ranges and CTmin/max
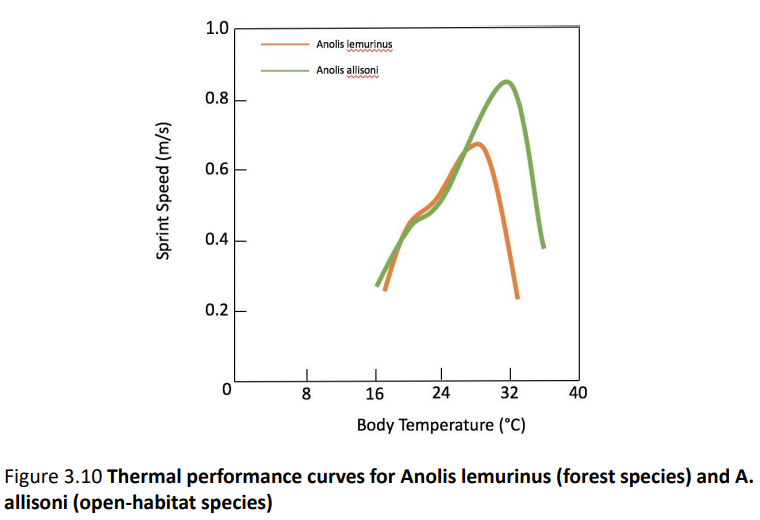
Different species have different thermal response curve, but ectotherms are generally like the lizard curve
Topt/most active is much closer to CTmax before critical conditions
Ectotherms don’t self-regulate temperature so they don’t shiver in cold conditions rather they just freeze
Righting response
Ability of organism to stay upright
Forest species vs Open-Habitat species have similar curves at slightly different ranges
The forest species (Anolis Lemurinus) LIzard has a much sharper drop off much sooner after reaching Topt (optimum temperature)
Describe how different specific physiological functions within the same organism are affected by temperature
Describe how it is that transient heat waves are tolerable:
FIGURE 1: Apart from overall physiological function, DIFFERENT SPECIFIC physiological functions/abilities within the same organism have different thermal ranges
CTMin/Max here are the limits of righting response (ability to stay upright) of the lizard
So certain physiological responses dictated by certain enzymes will cease before reaching those critical points
FIGURE 2: How temperatures past the CTmax affect % of insects’ that reach adulthood (% adult emergence)
How long can organisms survive at high temperatures? They don’t just die immediatley after CTmax
The higher the temperature, the shorter the amount of time they can tolerate it
Put insect at 45 C they will just have their physiological activity immediately disrupted
Slightly lower but still above max will decrease more gradually
MAIN TAKEAWAY: This means that transient heat waves are tolerable
Spectrum of responses depending on how hot it gets
![<p>Explain the history and significance of the Keeling curve</p><p></p><p>Describe the patterns observed in the modern atmospheric [CO2 ] record </p><p></p><p>Why does Keeling Curve follow seasons of northern rather than southern hemisphere?</p>](https://knowt-user-attachments.s3.amazonaws.com/a32abb50-97bc-4a96-a5cb-ac2110eca14d.png)
![<p>Climate scientist David Keeling is renowned for discovering the steady increase of CO2 in Earth’s atmosphere over time.</p><ul><li><p>In 1958, Keeling began measuring atmospheric CO2 levels at the Mauna Loa observatory in Hawaii using precise infrared gas analyzers.</p></li><li><p>He observed a “sawtooth pattern” in the data, caused by seasonal cycles of plant growth and decay (e.g., plants absorbing CO2 in spring and releasing it in the fall)</p></li></ul><p></p><p>Keeling demonstrated that CO2 levels were steadily increasing year-after-year due to HUMAN CONTRIBUTIONS like fossil fuel burning and deforestation</p><ul><li><p>The <strong>Keeling Curve</strong>, which tracks atmospheric carbon dioxide (CO₂) levels, shows clear seasonal fluctuations due to plant photosynthesis and respiration cycles.</p></li><li><p>Peak CO2 levels in May, trough CO2 levels in September.</p></li><li><p>In fall months, deciduous trees drop their leaves so over winter are not photosynthesizing. <strong><u>Thus over winter months, global respiration outpaces photosynthesis</u></strong></p></li></ul><p></p><ul><li><p>Long-term continuous measurements at one site</p></li><li><p> Site was at high altitude in the<strong><u> middle of the ocean</u></strong>, far from any sources of CO2 , (i.e. vegetation or human civilization)</p></li><li><p>Thus the air is well-mixed and the data is representative of the N. Hemisphere</p></li><li><p>Measurements were of high precision – using a new, more stable technique and constantly calibrated</p><ul><li><p>IR gas analyzer, detects how much IR radiation is absorbed by CO2 molecules in a sample of air</p></li></ul></li></ul><p></p><p><strong>President Day: 425 ppm</strong></p><p><strong>Pre-industrial: 270 ppm</strong></p><p><strong>Present rate of growth: 3.0 ppm/year</strong></p><p></p><p><strong><u>Describe the patterns observed in the modern atmospheric [CO2 ] record</u></strong></p><ol><li><p><strong><u>Seasonal Oscillations & 2. Long-Term Rise</u></strong></p><ul><li><p><em>Keeling curve SHOULD be going up and down seasonally (seasonal oscillations) but not increasing exponentially the way that it is, the little blips up and down are normal but the gradual trend upwards is NOT</em></p></li></ul></li></ol><p></p><ol start="3"><li><p><strong><u>Spatiotemporal Variability</u></strong></p><ul><li><p>Changes in a phenomenon over both <strong>space (LOCATION) and time (DURATION)</strong></p></li><li><p>In the context of the <strong>Keeling Curve</strong>, spatiotemporal variability would refer to how CO₂ levels fluctuate both <strong>in different locations</strong> and over <strong>time</strong>.</p></li></ul></li></ol><p></p><p>*********************************************************************************************************</p><p>This is due to the inherent <strong><u>asymmetry of the globe</u></strong></p><ul><li><p>Large amounts of land surface in the high latitudes of the Northern Hemisphere result in a large fall flush of CO2 into the atmosphere and a large, measurable uptake of CO2 from the atmosphere in the spring.</p></li><li><p>The Northern Hemisphere effect dominates the same effect in the Southern Hemisphere because the<strong> Southern Hemisphere has little land at comparable latitudes.</strong></p></li><li><p> The dominance of landmasses in the Northern Hemisphere is also important in the formation of glacial periods.</p></li></ul><p></p>](https://knowt-user-attachments.s3.amazonaws.com/4141e02a-6e42-4fd8-82ac-59418e67f5ac.png)
![<p><span style="color: green"><strong>Ocean waters are slightly basic/alkaline (8.1-8.2)</strong></span></p><ul><li><p>There are observation sites across the world of atmospheric [CO2] vs ocean pH like Canary Islands, Bermuda, and Hawaii</p><ul><li><p><strong><u>ALL SUGGEST THAT OCEAN pH HAS DECREASED BY 0.1 SINCE PRE-INDUSTRIAL TIMES!!!</u></strong></p><p></p></li></ul></li></ul><p></p><ol><li><p>Human activity <span style="color: red">RAISES CO2 levels in air resulting in more CO2 dissolving into seawater</span></p><p></p></li><li><p>CO2 reacts with H2O in seawater, creating carbonic acid (H2CO3)</p><ul><li><p>The more CO2 there is, the more it reacts with H2O forming more and more carbonic acid (H2CO3)</p></li></ul></li></ol><p></p><ol start="3"><li><p>H2CO3 dissociates into a hydrogen proton (H+) and a bicarbonate ion (HCO3-) thus DECREASING pH by increasing H+ concentration (ocean acidification)</p></li></ol><p></p><ol start="4"><li><p>The free H+ proton combines with a DISSOLVED carbonate ion (CO3²-) to form another bicarbonate ion (HCO3^-)</p></li></ol><p></p><p><strong><u>Rising [CO2] makes it more difficult for CaCO3 to FORM</u></strong></p><p></p>](https://knowt-user-attachments.s3.amazonaws.com/daaef890-4587-4b5f-a82b-b1410c8bbda5.png)
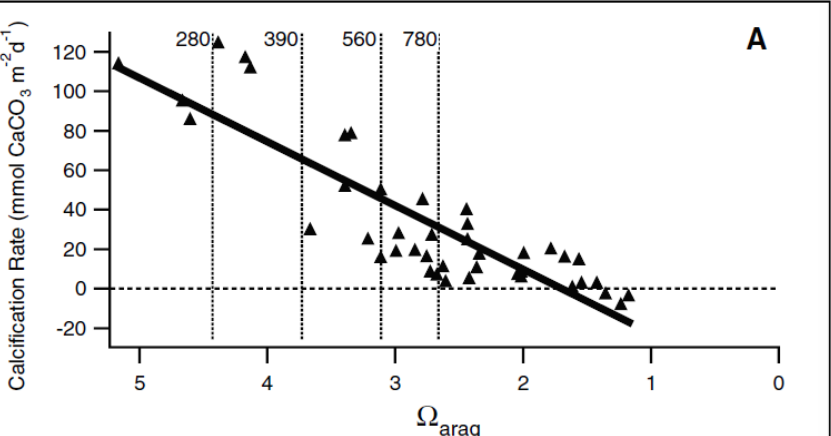
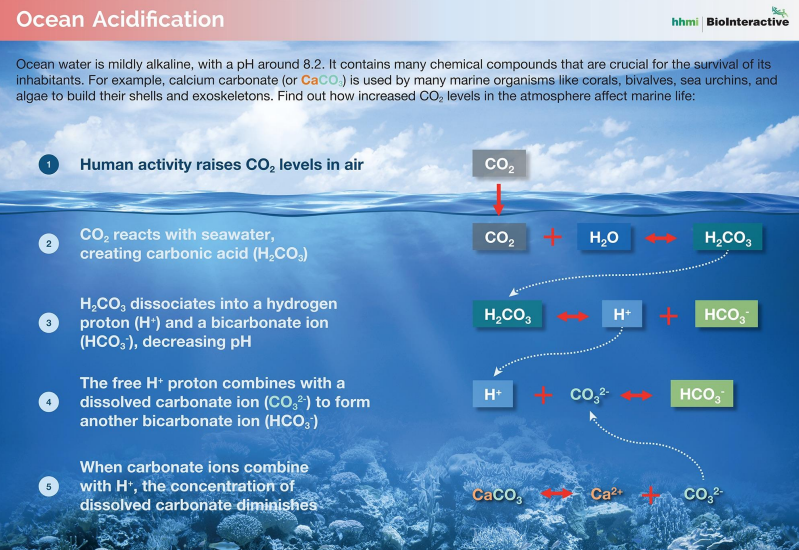
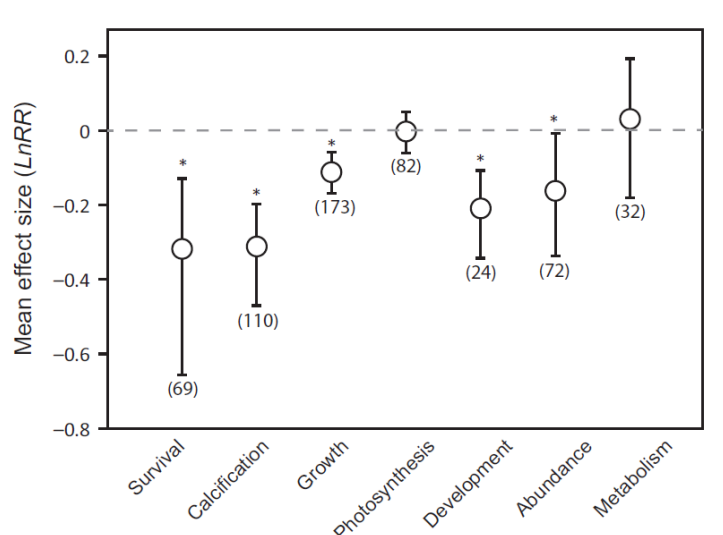
![<p><strong><u>Impacts of Ocean Acidification on Marine Organisms: Quantifying Sensitivities and Interaction with Warming</u></strong></p><ul><li><p><span style="color: green">Ocean acidification represents a threat to marine species worldwide</span>, and forecasting the ecological impacts of acidification is a HIGH priority for science, management, and policy.</p></li><li><p>As more research on this topic develops, a comprehensive understanding of the<span style="color: yellow"> variability in organisms’ responses and corresponding levels of certainty is NECESSARY to forecast the ecological effects.</span></p></li><li><p>Here we perform the MOST comprehensive meta-analysis to date by synthesizing the results of 228 <span style="color: yellow"><strong><u>studies examining biological responses to ocean acidification</u></strong></span></p></li></ul><p></p><p>This paper is a <strong><u>meta-analysis</u></strong> of the effects of ocean acidification on marine organisms</p><ul><li><p>A meta-analysis is a research method tha<strong>t </strong><span style="color: red"><strong>combines and statistically analyzes data from multiple studies on a similar topic to derive a more comprehensive conclusion.</strong></span></p></li><li><p>It identifies trends, resolves inconsistencies, and provides a higher statistical power than individual studies.</p></li></ul><p></p><p><strong><u>Mean Effect Size (LnRR: Log Response Ratio)</u></strong></p><ul><li><p>A statistical measure used in <strong>meta-analyses</strong> to quantify the RELATIVE CHANGE in an outcome due to treatment</p><ul><li><p>With values above or below zero indicating positive or negative effects respectively</p></li></ul></li><li><p>Represents <span style="color: blue"><strong><u>how the means of different groups change in response to an independent variable</u></strong></span></p><ul><li><p><strong>LnRR shows the proportional change in group means due to an independent variable, helping to compare effects across different studies in a meta-analysis.</strong></p></li></ul></li><li><p><strong>LnRR = 0</strong> represents <strong>no effect</strong> between the treatment group and the control group.</p></li></ul><p></p><p><strong><u>Figure Analysis:</u></strong></p><p><strong>Calcifiers:</strong></p><ul><li><p>Calcifying Algae, Coral</p></li><li><p>Coccolithophore (Cocc): Phytoplankton</p></li><li><p>Echinodermata: Invertebrates like sea urchins & cucumbers</p></li><li><p>Mollusks: Clams, oysters, sea snails</p><ul><li><p><strong>Mollusks </strong>are being hit ESPECIALLY hard by increasing ocean acidification you can see the RED (denoting reduction by at least 25%) for both survival & calcification</p></li></ul></li><li><p>Crustaceans: Crabs, lobsters</p></li></ul><p></p><p><strong>Non-Calcifiers:</strong></p><ul><li><p>Fleshy Algae, Seagrass</p></li><li><p>Diatoms: Microscopic algae</p></li><li><p>Fish</p><p></p><p><strong><em>Mean effect of near future acidification on major response variables</em></strong></p><p></p><ul><li><p>Survival:<strong><u> Net Decrease</u></strong></p><ul><li><p><span style="color: red">Mollusks: Greater than 25% DECREASE</span></p><p></p></li></ul></li><li><p>Calcification: <strong><u>Net Decrease</u></strong></p><ul><li><p><span style="color: red">Corals & Mollusks: Greater than 25% DECREASE</span></p></li><li><p><span style="color: rgb(208, 54, 171)">Coccolithophores: Less than 25% DECREASE</span></p><p></p></li></ul></li><li><p>Growth: <strong><u>Net Decrease</u></strong></p><ul><li><p><span style="color: rgb(204, 36, 163)">Echinoderms & Mollusks: Less than 25% DECREASE</span></p></li><li><p><span style="color: green">Fleshy Algae & Diatoms: Less than 25% INCREASE</span></p><p></p></li></ul></li><li><p>Photosynthesis: <strong><u>Stable</u></strong></p><ul><li><p><span style="color: red">Calcifying Algae: Greater than 25% DECREASE</span></p><ul><li><p><span style="color: red">[likely related to decreased calcification]</span></p></li></ul></li><li><p><span style="color: green">Diatoms: Less than 25% INCREASE</span></p><p></p></li></ul></li><li><p>Development: <strong><u>NET DECREASE</u></strong></p><ul><li><p><span style="color: rgb(194, 33, 155)">Mollusks and Echinoderms: Less than 25% </span><span style="color: rgb(196, 35, 157)">DECREASE</span></p><p></p></li></ul></li><li><p>Abundance: <strong><u>NET DECREASE</u></strong></p><ul><li><p><span style="color: red">Calcifying Algae and Coral: Greater than 25% DECREASE</span></p><p></p></li></ul></li><li><p>Metabolism: <strong><u>Stable </u></strong>(no * so not definitively non-zero, pretty much 0)</p></li></ul></li></ul><p></p><p><span style="color: red"><strong><em>The parentheses number under the circle are “Degrees of freedom/number of experiments used to calculate the mean”</em></strong></span></p><ul><li><p>Means are from weighted, random effects meta-analysis and are shown with bias-corrected bootstrapped 95% confidence intervals</p></li><li><p>* denotes a significant difference from 0</p></li></ul><p></p><p><span style="color: yellow"><strong>Completely yellow (95% of CONFIDENCE INTERVAL OVERLAPS 0):</strong></span></p><ul><li><p>Either ineffective or not enough research to show</p></li></ul><p></p>](https://knowt-user-attachments.s3.amazonaws.com/d96553f7-1a45-4d2b-9e4d-257899d1a6e1.png)
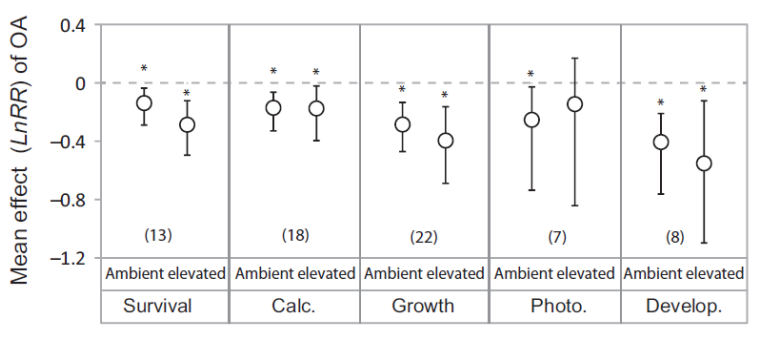
![<p><strong><u>Ambient v Elevated: Dawn of Acidification: Figure 1</u></strong></p><ul><li><p>We see evidence pointing towards elevated temperatures perhaps exasperating the effects of ocean acidification BUT it is not statistically significant as it all overlaps</p></li></ul><p></p><p></p><p><strong><u>Projections of Future Ocean pH and its Impacts: Figure 2</u></strong></p><ul><li><p>We used to be around 8.2 pH but since 2000 we have dipped down to around 8.1</p></li></ul><ul><li><p><strong>Worst case scenario is dropping to 7.75 by end of century</strong></p></li><li><p><span style="color: blue"><strong>Best case scenario is continues to decrease but levels out at 8.05 [Representative Concentration Pathway (RCP) 2.6]</strong></span></p><ul><li><p>The rest [RCP 4.5, 6.0, and 8.5] each dip below 8 pH by 2100.</p></li></ul></li></ul><p></p><p>Future Projections of Ocean pH and its impacts</p><ul><li><p>Will pretty much worldwide continue to drop and get more acidic</p></li><li><p>Risks to mollusk and crustacean populations</p></li><li><p>Along with risks to cold-water and warm-water corals</p></li><li><p>STRONGER decrease in pH at the North pole than everywhere else</p><ul><li><p>It absorbs more CO2 due to colder water temperatures</p><ul><li><p><strong><u>As temperatures DECREASE, the solubility of gasses in liquids INCREASE </u></strong></p></li></ul></li></ul></li></ul><p></p>](https://knowt-user-attachments.s3.amazonaws.com/a0159929-7b9d-4bae-8acd-0ca7e6714247.png)