2.6.1 Possible macroeconomic objectives & 2.6.2 Demand-side policies
1/17
There's no tags or description
Looks like no tags are added yet.
Name | Mastery | Learn | Test | Matching | Spaced | Call with Kai |
|---|
No study sessions yet.
18 Terms
What are the 7 possible macroeconomic objectives
1) Economic growth
2) Low unemployment
3) Low & stable rate of inflation
4) Balance of payments equilibrium on current account
5) Balanced government budget
6) Protection of the environment
7) Lower income inequality
Distinction between monetary & fiscal policy
Monetary: policy by Central Bank, change cost/amount of money to affect AD
Fiscal policy: policy by government, change government spending/borrowing & tax revenue to affect AD
Fiscal policy instruments: government spending & taxation / Distinction between government budget (fiscal) deficit & surplus
Balanced government budget: government spending = tax revenue with no budget deficit nor a budget surplus
Budget deficit / fiscal deficit = government spending exceeds tax revenue
Budget surplus / fiscal surplus = government spending is lesser than tax revenue
Distinction between, and examples of, direct & indirect taxation
Direct tax = tax on income, for example, corporation tax (tax on firm’s profits), income tax, national insurance, business tax, council tax
Indirect tax = tax on goods/services, for example, VAT (firms pay when consumers pay their products)
Use of AD/AS diagrams to illustrate demand-side policies (just for fiscal for now)
For Fiscal policy
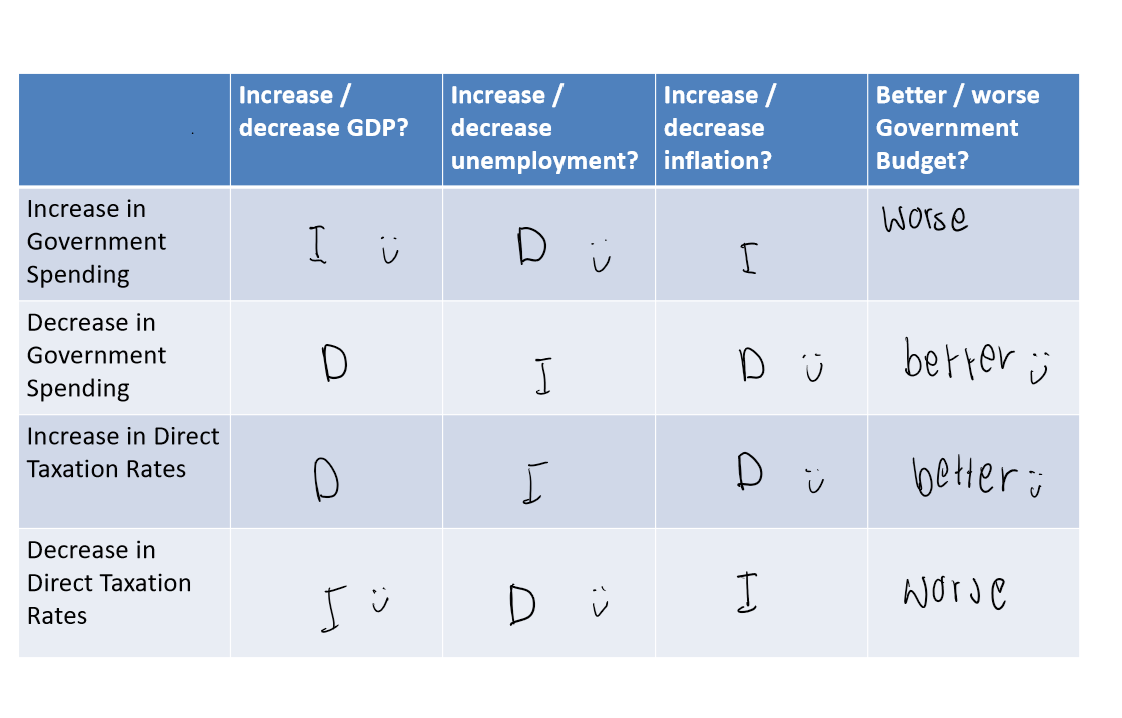
change government spending - shift of AD curve - economic growth
change in tax revenue caused by change in direct tax/indirect tax
direct tax - (ie. affect disposable income) shift AD curve - economic growth / inflation
indirect tax - shift SRAS curve (firm’s cost of production) - economic growth / inflation
2 goals of Demand side policy
Expansionary (AD increases)
Contractionary (AD decreases)
Expansionary is targeting economic growth objective
Contractionary is targeting inflation or budget deficit
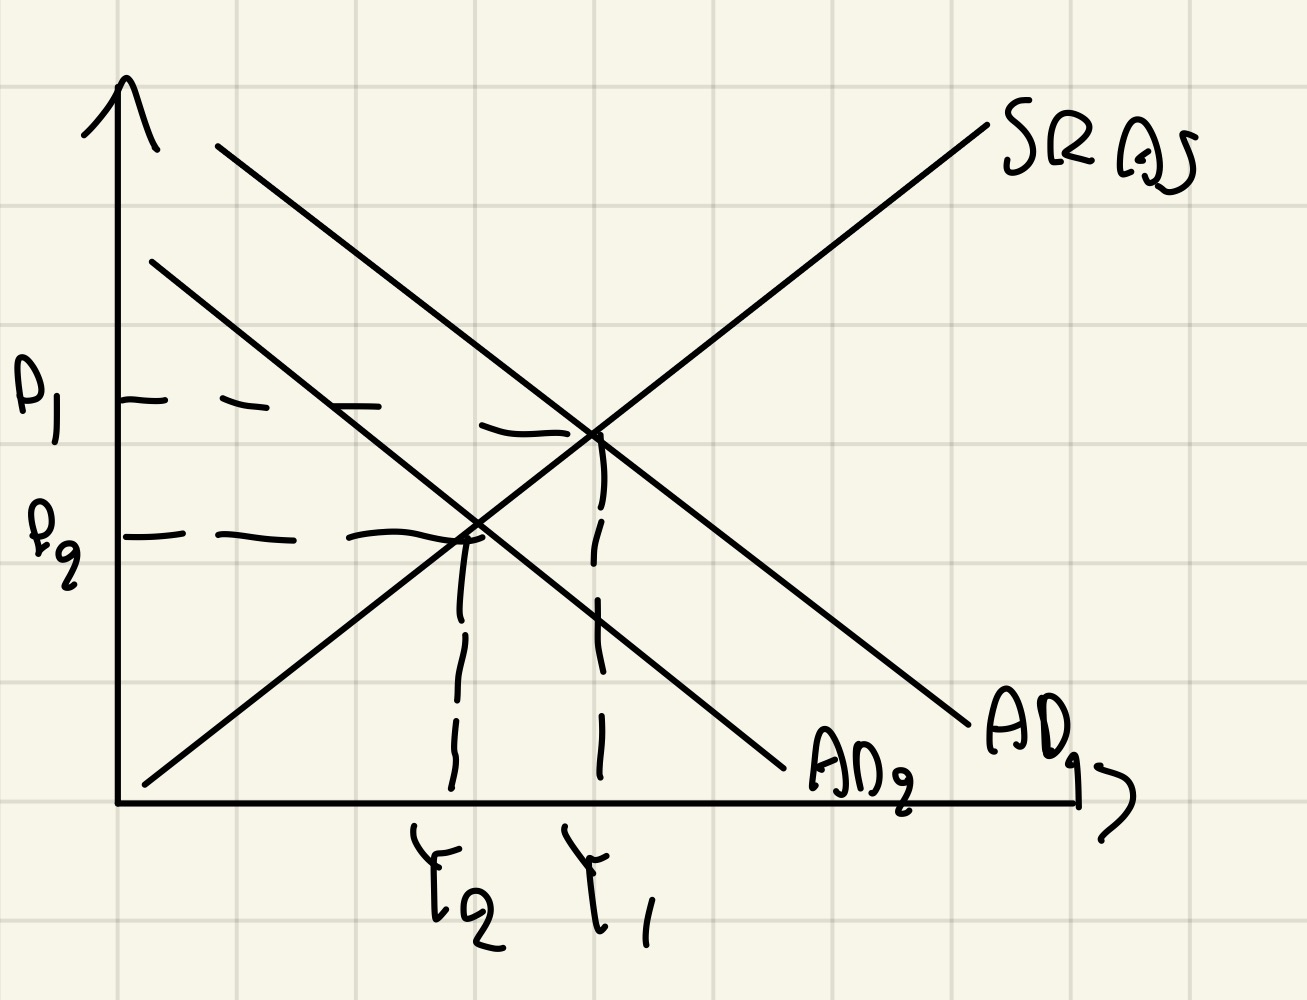
Common chain of reasoning for corporation tax on the AD/AS diagram (Direct tax)
Corporation tax increases = tax on profits of firms increases = firms have less profits = less incentivized to invest = Investment decreases = AD decreases = Contractionary = inflation decreases / economic decline
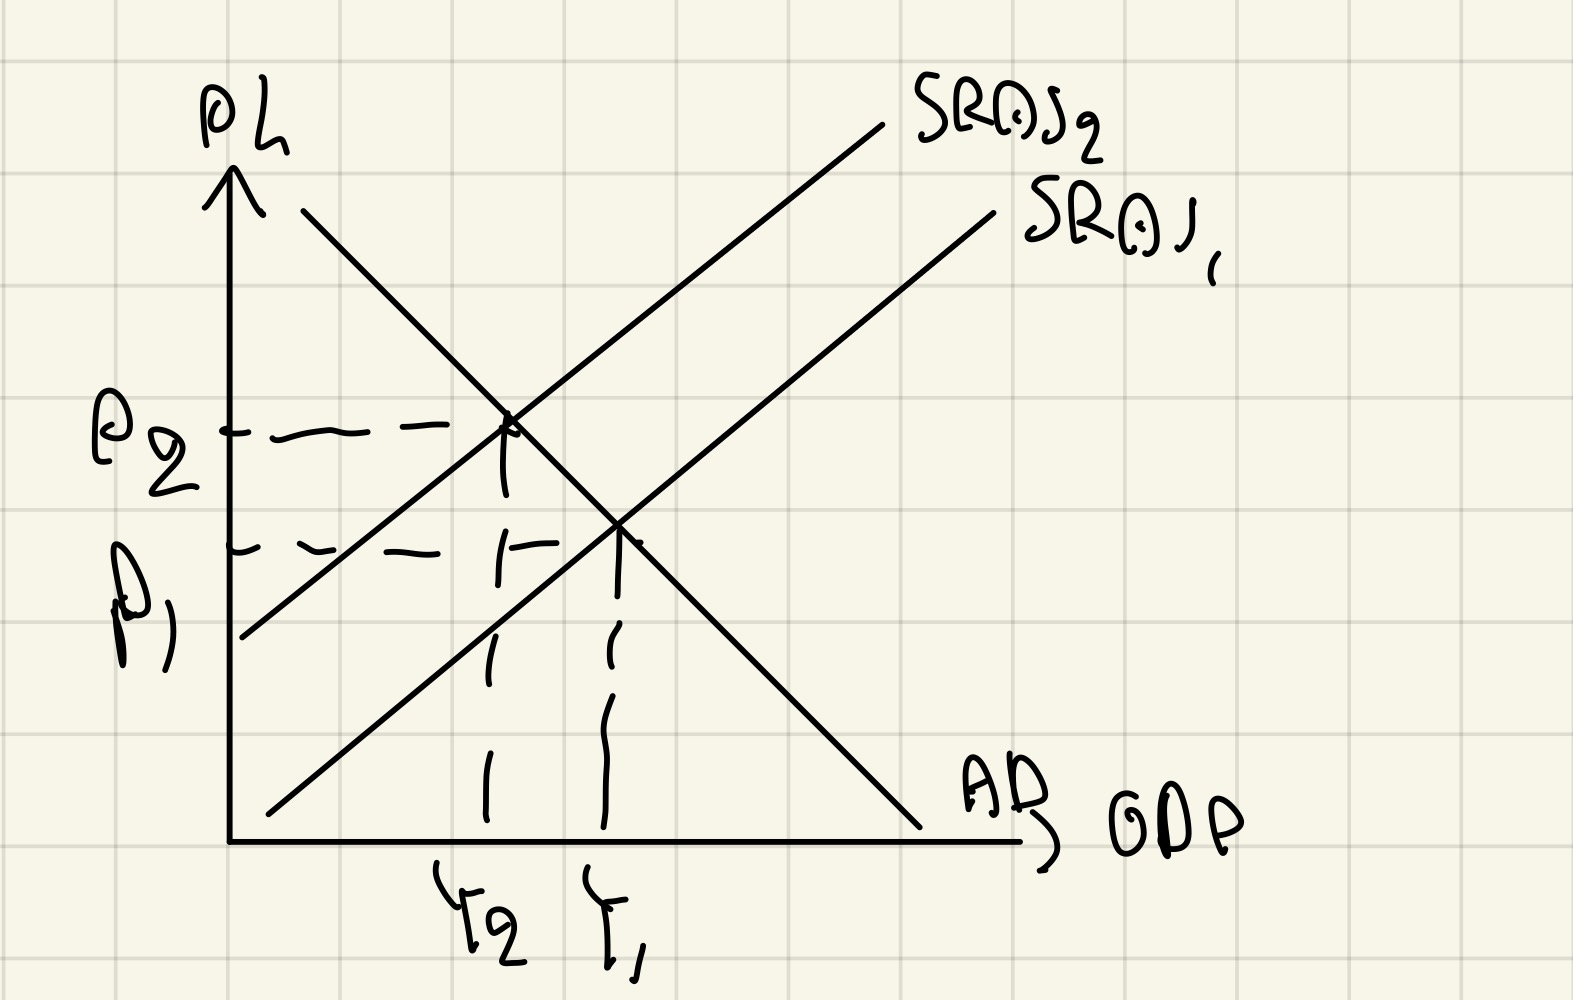
Common chain of reasoning for VAT on the AD/AS diagram (Indirect tax)
VAT increases = tax on g&s on producer increases = cost of production increases = SRAS decreases =Price level increases = inflation increases
Strengths & weaknesses of demand-side policies (EVALS)
Take long time to work?
Very expensive?
Does it affect other objectives?
Meaning of discretionary fiscal policy
When there are deliberate changes in government spending or taxes which can result in either expansionary / Contractionary
Monetary policy instruments: Interest rates
This is where the Central Bank (ie. Bank of England) changes the base rate of interest
(Base rate of interest = rate at which commercial banks pay back to the Central Bank for borrowing money)
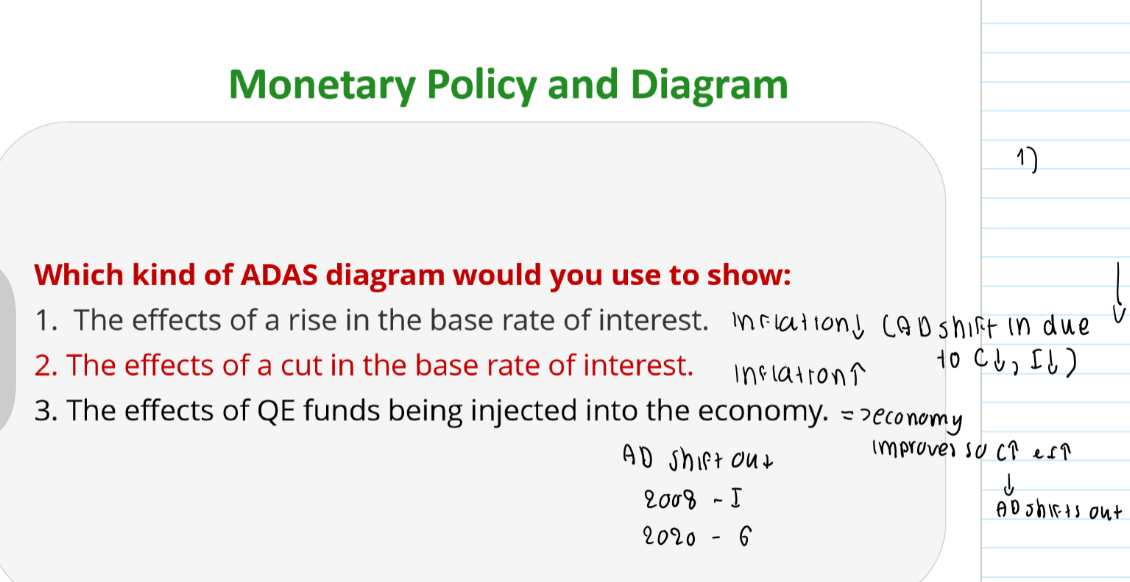
Aim of this interest rate policy (increasing interest rates) is to eventually lower rate of inflation (if inflation rise above 2%)
1) Increase base rate of interest by the Central Bank
2) Which eventually leads to lower rate of inflation
Monetary policy instruments: asset purchases by the Central Bank to increase the money supply (quantitative easing)
Quantitative easing = It’s when a central bank (ie. Bank of England) buys government bonds to increase money supply in the economy
Used when interest rates policies alone cannot stimulate AD as it is already very low
QE during 2008
Massive financial crash starting in USA
Commercial banks feels too risky to lend to businesses
So they bought safe government bonds
Since commercial banks stopped lending, many businesses had to close as not being able to borrow money
To stop this (further economic damage), Bank of England forced commercial banks to sell their bonds to them (to Bank of England) - quantitative easing
(Commercial banks received cash when sell bonds to Bank of England) Commercial banks now had extra funds which could lend to firms → investment increases → AD increases
At the same time, increase in demand for bonds → bond prices increases → bond yields decreases → bonds less attractive
QE during COVID
UK government needed to borrow money for NHS & need to pay for furlough scheme
But investors in bond market was scared by huge amounts of money governments were borrowing
Therefore, investors would either stopped buying governments bonds or only would at much higher interest rate
Bank of England were worried by this - that the government might not get enough money, or that it would but have high interest payments in the future
Therefore, Bank of England directly purchased UK government bonds at low interest rates → demand for bonds increases → bond prices increases = yields (interest rates) go down → government can borrow money cheaply → government spending on NHS… increases → AD increases
Since the full support of Bank of England was now behind the government, bond markets now also felt more confident to lend to government
The role of the Bank of England: the role & operation of the Bank of England’s Monetary Policy Committee
The job of the MPC of the Bank of England is to change the base interest rate if inflation is too high
Strengths & weaknesses of monetary policy
Affect other objectives
If interest rates rise → inflation decreases → GDP decreases → production decreases → need less workers → unemployment increases
If interest rates fall: opposite effect to the above
Effects on certain groups
Effect on households: If interest rates rise → mortgages (a type of loan) for households more expensive → take up more income → disposable income to spend on necessities decreases → reduces standard of living / don’t have enough money to spend on mortgages anymore → homeless
Effect on savers: If interest rates fall → savings have a lower return for existing savings → MPS decreases → banks have less money to lend loans to ppl / decreases money to use in recessions as wages go down
Time lag
It can take up to 18 months for an interest rate change to have its full effect
When interest rates change, borrowing/spending don’t adjust instantly
Households: Interest rates may have been fluctuating so they might wait to be certain enough that it will become stable ; households on a fixed-rate mortgages so their payments don’t change until the fixed term ends
Firms: they might already have enough cash for now so don’t need to borrow immediately
Evaluation for QE
Inflationary effects
Although this was not seen either in 2008 or 2020, Pumping so much money so quickly into economy risks boosting AD in an inflationary way
QE Money not being used as it should be
Ie. 2008-Banks could use QE money to lend to firms but could prefer to spend it on cheaply valued assets (shares, property)
2020 - governments could use QE money towards health care & furlough but could prefer to spend it on ‘voting-winning’ areas (ie. Tax cuts, defence)
High level of borrowing as you will get a QE funding anyways → debt increases → have to borrow money from other countries / get rescued→ recession
Additionally, public may be uncertain on whether government will get rescued → consumer confidence decreases → consumption decreases → AD decreases
Monetary policy & diagram