Lecture 6(2) - Measuring Market Strength
1/16
There's no tags or description
Looks like no tags are added yet.
Name | Mastery | Learn | Test | Matching | Spaced | Call with Kai |
|---|
No analytics yet
Send a link to your students to track their progress
17 Terms
Market Breadth Indicators
Measures internal strength of the market by considering whether stocks are gaining/losing strength in price
Why - Breadth leads price
Advance-Decline (A-D) Line, A-D Ratio, Breadth Difference, Breadth thrust
Advance-Decline Line (A-D)
Best way to measure internal strength of the market index
Cumulative sum of advancing issues minus declining ones
It should follow and move to new highs with the index for confirmation - if not, there is a divergence which will lead to a price reversal
A-D Tip
Look for 2 consecutive negative divergences - double negative divergence signals a peak within a year
A-D Breadth Line
McClellan Oscillator
Difference of 2 exponential moving averages (19 & 39 day EMAs) of [advances - declines]
Difference between advances-declines
Overbought: +100 to +150
Oversold: -100 to -150
Zero line cross is also important
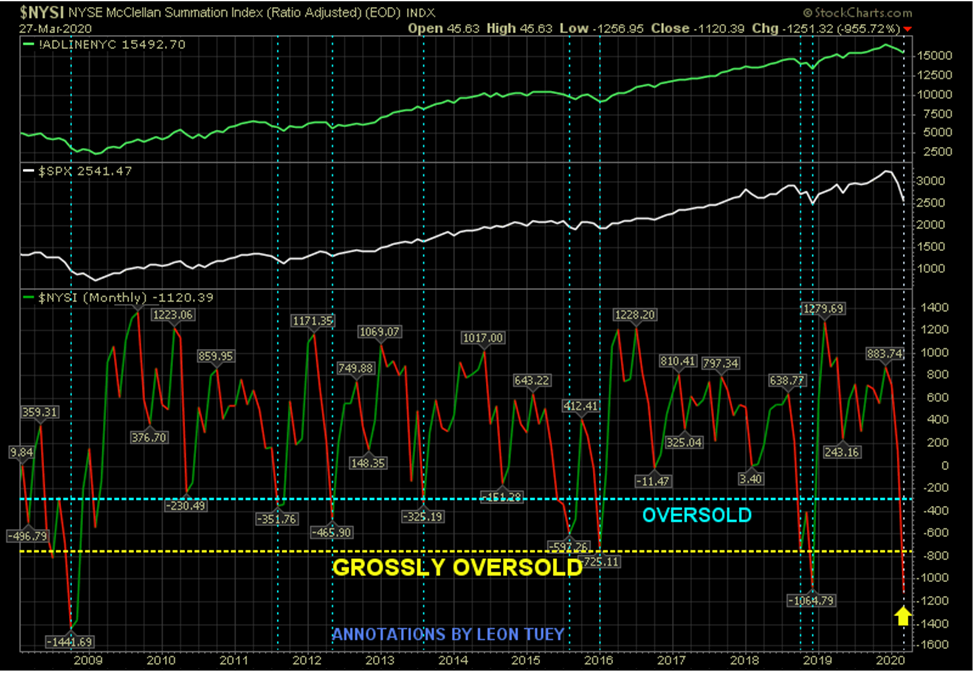
McClellan Summation Index
Measure of area under the McClellan Oscillator curve by acucmulating the daily McClellan Oscillator figures into a cumulative index
Oscillates between 0 and 2000, neutral is 1000
Ratio adjusted Summation Index (RASI) is used to factor for increases in number of issues, and oscillated between +500 (overbought) and -500 (oversold)
McClellan Summation Index Graph
Advance-Decline Ratio Graph
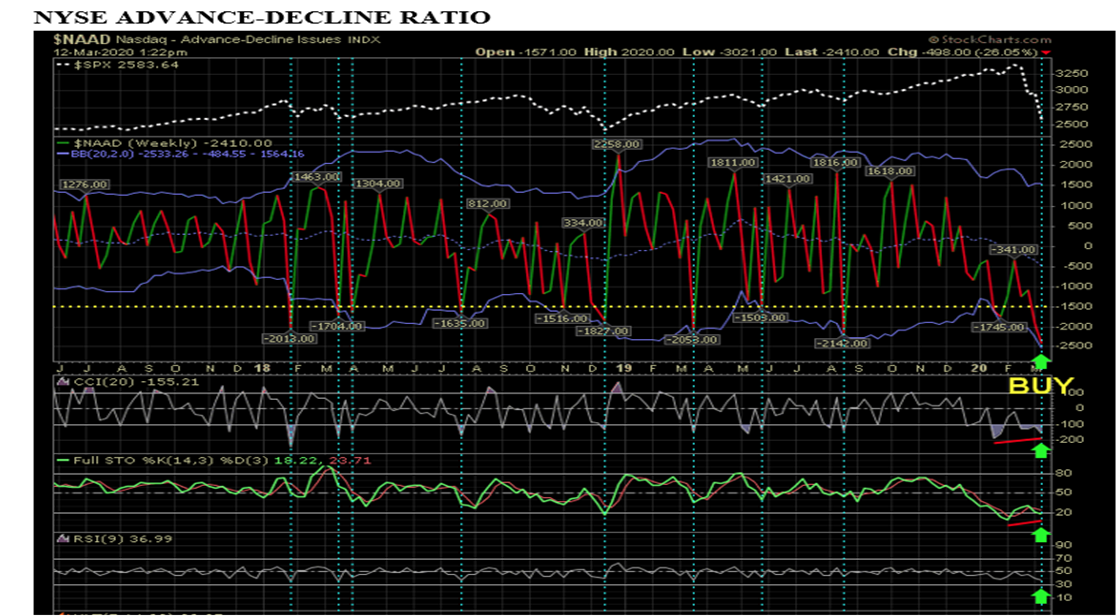
A-D Ratio
Number of Advancing issues
Number of Declining issues → and smooth it over a time period → a ratio above 1 shows that more stocks are advancing than declining
Breadth Thrust
10 day SMA of advances
(Advances + declines when it goes above 0.61)
Arms Index
Measures relative volume in advancing stocks vs declining stocks
Interpretation: large volume in declining stocks, market likely at bottom. Large volume in advancing stocks, market is healthy
(Advances/declines)
(Advancing volume/declining volume)
Arms index ABOVE one means a declining volume and price is leading the market
90% downside days (NPDD)
Reliable may to identfy major market bottoms
Occurs when on a particular day the % of downside volume > total of upside and downside points exceeds total of gained points and lost points by 90%
A 90% upside day occurs when both the upside volume and points gained are 90% of their respective totals
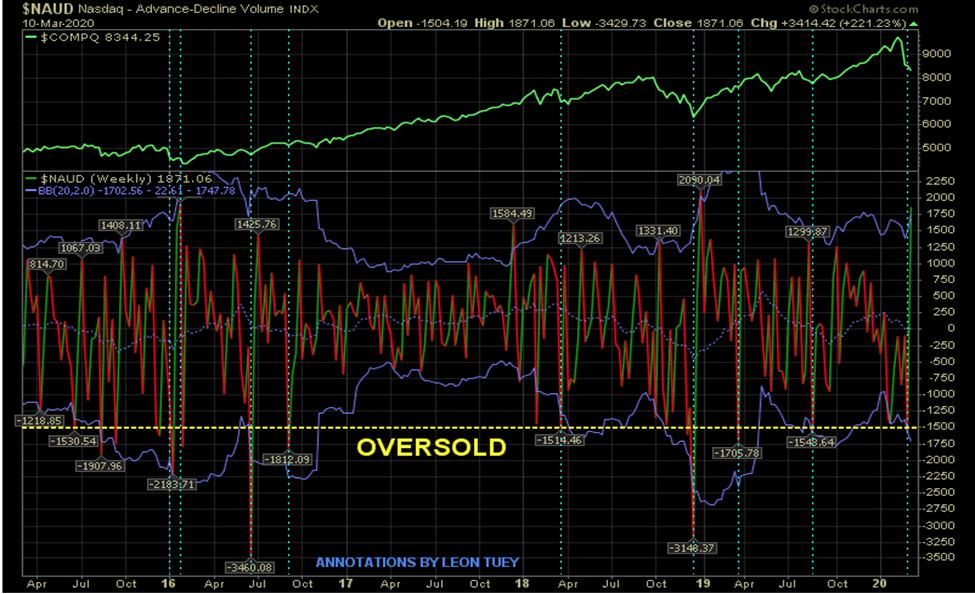
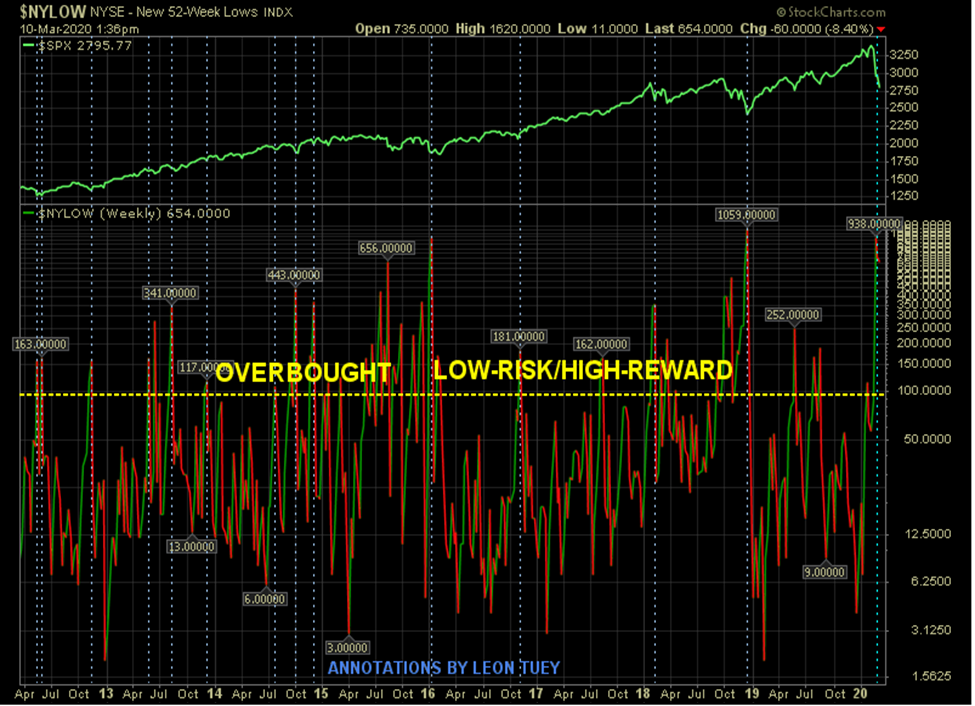
Up and Down Volume Indicators
Net new 52-week highs and Net New 52-week lows
When stock market index is rising, most individual stocks should be rising to new highs, when the market index is declining, most stocks should go lower and make new lows
Up and down volume indicators graph
Hindenburg Omen (HO) → part of Up and Down Volume
Signals a reversal downward and potential crash in the market just like the Hindenburg blimp crash
Rare technical signal, attempts to predict crashes
Must meet conditions
Conditions for HO to go off
52 week highs & lows each have to be greater than 2.2% of stocks
Small number of new highs or lows > 75
10 week moving average of NYSE comp is rising
McClellan oscillator is negative
New highs cannot be >2 x of new lows
Confirmation: 2 or more occurences within a 36-day period
Using Moving Averages
Number of stocks >30 week moving average
Looking at how many stocks are trending by seeing if their price is above a N-day moving average