STAT 3206
5.0(1)
Card Sorting
1/99
There's no tags or description
Looks like no tags are added yet.
Last updated 10:50 AM on 9/11/23
Name | Mastery | Learn | Test | Matching | Spaced | Call with Kai |
|---|
No analytics yet
Send a link to your students to track their progress
100 Terms
1
New cards
“status” ; state
Statistics is derived from the Latin word ________ with the meaning ________.
2
New cards
Plural
In _______ sense, statistics is defined as any set of numerical data (e.g. vital statistics, monthly sales)
3
New cards
Singular
In ______ sense, statistics is defined as a branch of science that deals with the collection, presentation, analysis, and interpretation of data
4
New cards
Aids in decision making
Summarizes data for public use
Summarizes data for public use
Roles of Statistics
5
New cards
Descriptive
Inferential
Inferential
2 Areas of Statistics
6
New cards
Descriptive Statistics
Area of Statistics that is concerned with describing a set of data **without drawing conclusions or inferences** from it.
\
It includes collecting, presenting, and analyzing of data.
\
It includes collecting, presenting, and analyzing of data.
7
New cards
Inferential Statistics
Area of Statistics that utilizes sample data to **make inferences and draw conclusions** about a larger set of data.
\
It includes interpreting, making inferences, hypothesis testing, determining relationships, and making predictions.
\
It includes interpreting, making inferences, hypothesis testing, determining relationships, and making predictions.
8
New cards
Data
facts or figures from which conclusions may be drawn
9
New cards
Data Set
collection of facts and figures or data
10
New cards
Elements/Units
entities on which data are collected
11
New cards
Variable
a characteristic or attribute of elements which can assume different values or labels under statistical study
12
New cards
Observation
set of measurements collected for a particular element
13
New cards
Qualitative Variable
Quantitative Variable
Quantitative Variable
2 Types of Variables
14
New cards
Qualitative Variable
outcomes of the variables expressed **non- numerically or categorically**
\
example: name, gender, eye color, religion, etc.
\
example: name, gender, eye color, religion, etc.
15
New cards
Quantitative Variable
outcomes are expressed **numerically** that are meaningful or indicate some sort of amount
\
example: age, allowance, number of students, height, etc.
\
example: age, allowance, number of students, height, etc.
16
New cards
Quantitative Discrete Variable
Quantitative Continuous Variable
Quantitative Continuous Variable
2 Kinds of Quantitative Variables
17
New cards
Quantitative Discrete Variable
It is a variable which can assume **finite**, or at most , countably infinite number of values.
\
It is usually measured by counting. It answers the question “how many”.
\
example: # of students, # of children
\
It is usually measured by counting. It answers the question “how many”.
\
example: # of students, # of children
18
New cards
Quantitative Continuous Variable
It is a variable which can assume infinitely many values corresponding to a line interval
\
It gives rise to measurement. It answers the question “how much”.
\
example: weight, allowance, height
\
It gives rise to measurement. It answers the question “how much”.
\
example: weight, allowance, height
19
New cards
Nominal
Ordinal
Interval
Ratio
Ordinal
Interval
Ratio
Scale/Levels of Measurement of Variables
20
New cards
Nominal
It is a classificatory scale. It is the **weakest** level of measurement where numbers or symbols are used simply for l**abeling or categorizing** subjects into different groups
\
example: sex (male/female)
\
example: sex (male/female)
21
New cards
Ordinal
It is classificatory with ordering scale. It is numbers assigned to categories of any variable may be **ranked or ordered.**
\
example: educational attainment (elementary/HS/college/MS/PhD)
\
example: educational attainment (elementary/HS/college/MS/PhD)
22
New cards
Interval
It has the properties of the nominal and ordinal levels. The distances between any two numbers on the scale are of known sizes.
\
It has arbitrary zero.
\
example: temperature
\
It has arbitrary zero.
\
example: temperature
23
New cards
arbitrary zero
zero does not mean nothing
24
New cards
Ratio
It is the highest level of measurement. It has the properties of the nominal, ordinal, and interval levels. It is anything that is countable or measurable.
\
It has absolute zero or true zero.
\
It has absolute zero or true zero.
25
New cards
absolute zero or true zero
zero means nothing
26
New cards
Primary Data
It is acquired directly from the **original** source of information. Data that are measured or gathered by the researcher themselves
27
New cards
Secondary Data
data taken from published or unpublished data which have been **previously gathered by others**
28
New cards
Subjective Data
It means “from someone’s point of view”. Data that is commonly about perceptions, beliefs, feelings, and opinions.
29
New cards
Objective Data
fact-based, measurable, countable, and observable data
30
New cards
Interview
Questionnaire
Experimental
Observation
Registration
Questionnaire
Experimental
Observation
Registration
5 Data Collection Methods
31
New cards
Interview
__**Data Collection Methods**__. There is a **person-to-person contact** or exchange of information between the interviewer and interviewee.
\
It is more appropriate for obtaining **complex emotional-laden** topics probing sentiments underlying an expressed opinion. It provides consistent and more precise information since the interviewee may give clarifications.
\
It is time consuming and has limited field of coverage
\
It is more appropriate for obtaining **complex emotional-laden** topics probing sentiments underlying an expressed opinion. It provides consistent and more precise information since the interviewee may give clarifications.
\
It is time consuming and has limited field of coverage
32
New cards
Questionnaire
__**Data Collection Methods**__. Data are collected by means of **written responses based on a list of questions** which are relevant to the problems of the study.
\
It inexpensive and can cover a wide area in a shorter period of time
\
It has high possibility of incomplete response or may not return the questionnaire, especially if it is mailed.
\
It inexpensive and can cover a wide area in a shorter period of time
\
It has high possibility of incomplete response or may not return the questionnaire, especially if it is mailed.
33
New cards
Experimental
__**Data Collection Methods**__. It is used when the objective is to determine the **cause-and-effect relationship** of certain phenomena under controlled conditions
34
New cards
Observation
__**Data Collection Methods**__. The researcher **observes** the behavior of persons and their outcomes. The potential bias caused by the interviewing process is reduced and eliminated in this method
35
New cards
Registration
__**Data Collection Methods**__. This method of collecting data is **enforced by** **certain laws** such as registration of births, deaths, licenses, etc.i Information are kept systematized and made available to all because of the requirement of the law.
36
New cards
Population
entire group of observations or elements where inferences and conclusions are made
37
New cards
Parameter
a numerical characteristic of the population
38
New cards
Sample
subset of the entire group of observations or elements where data is collected
\
representative of the population
\
representative of the population
39
New cards
Statistic
a numerical characteristic of the sample
40
New cards
Census/Complete Enumeration
Sampling/Survey Sampling
Sampling/Survey Sampling
General Classification of Collecting Data
41
New cards
Census/Complete Enumeration
process of gathering information from every unit or all the units of the population
42
New cards
Sampling/Survey Sampling
process of obtaining a part or subset of the population
43
New cards
less cost
greater accuracy
greater speed
greater scope
greater accuracy
greater speed
greater scope
Why do we sample?
44
New cards
Probability Sampling
Nonprobability Sampling
Nonprobability Sampling
Types of Sampling Methods
45
New cards
Probability Sampling
__**Types of Sampling Methods.**__ Each unit in the population has a known, non-zero probability of selection, and **have equal chances** of being selected as a sample.
\
It uses some **chance mechanism**
\
It uses some **chance mechanism**
46
New cards
Nonprobability Sampling
__**Types of Sampling Methods.**__ The elements in the population **do not have equal chances** of being selected as a sample.
\
Elements of the population are taken depending to a large extent on the **personal feelings or purpose** of the researcher and **without regard for some chance mechanism** for choosing an element
\
Elements of the population are taken depending to a large extent on the **personal feelings or purpose** of the researcher and **without regard for some chance mechanism** for choosing an element
47
New cards
sampling frame,
listing of all individual units in the population which is required in the execution of probability sampling methods
48
New cards
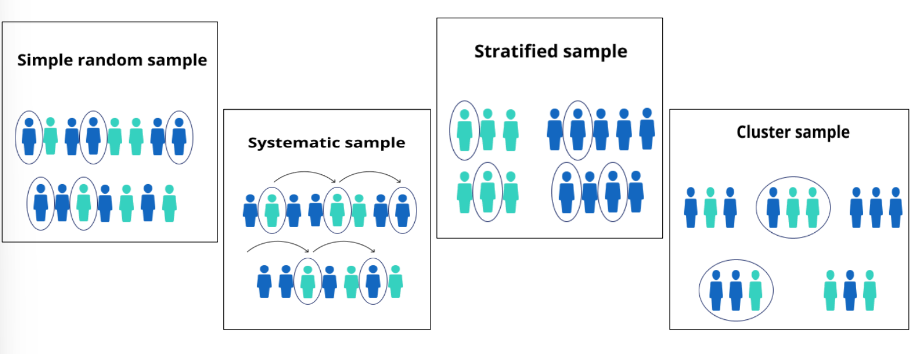
Simple Random Sampling (SRS)
Systematic Sampling
Stratified Sampling
Cluster Sampling
Systematic Sampling
Stratified Sampling
Cluster Sampling
4 Types of Probability Sampling Methods
49
New cards
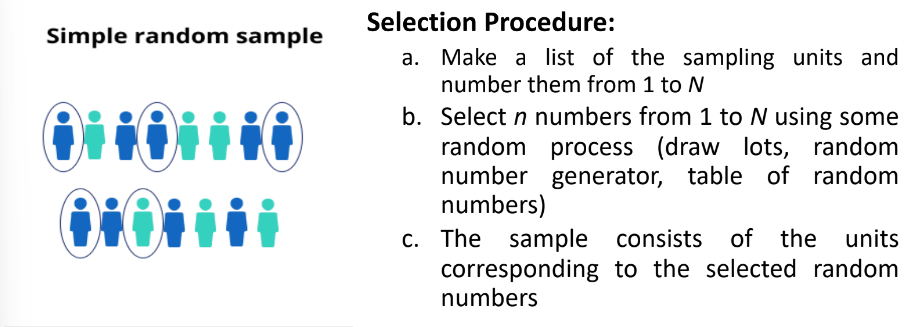
Simple Random Sampling (SRS)
Method of selecting ***n*** units out of ***N*** units in the population where all elements in the population have an **equal chance** of being included in the sample.
\
This sampling method is suitable when the **population** being studied is **homogeneous or have the same characteristics.**
\
ex. draw lots, random number generator
\
This sampling method is suitable when the **population** being studied is **homogeneous or have the same characteristics.**
\
ex. draw lots, random number generator
50
New cards
SRS with Replacement (SRSWR)
SRS without Replacement (SRSWOR)
SRS without Replacement (SRSWOR)
2 Types of Simple Random Sampling (SRS)
51
New cards
SRS with Replacement (SRSWR)
Type of SRS where a chosen element is **always replaced** before the next selection is made.
52
New cards
SRS without Replacement (SRSWOR)
Type of SRS where a chosen element is **not replaced** before the next selection is made
53
New cards
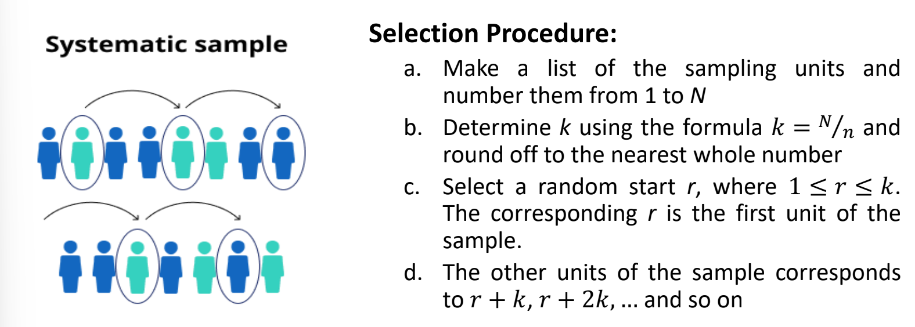
Systematic Sampling
Type of probability sampling method which is a method of selecting a sample by taking **every** **kth** **unit** from an ordered population, where the first unit being selected at random
54
New cards
sampling interval
In systematic sampling, what is k?
55
New cards
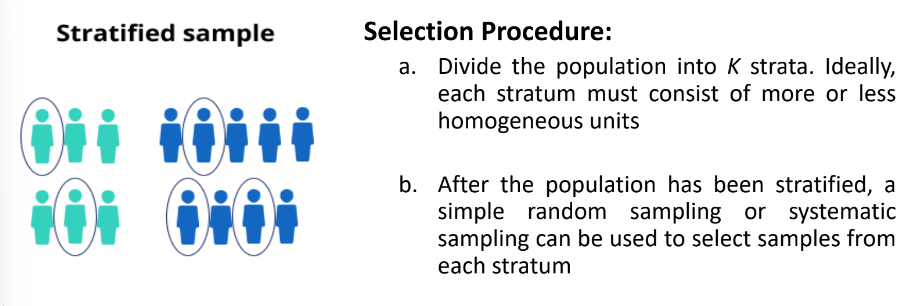
Stratified Sampling
It is done if the population is **heterogeneous** and can be subdivided into non-overlapping **homogeneous subpopulation** called ***strata***.
\
Samples are then randomly selected from all the strata using SRS or systematic sampling
\
Samples are then randomly selected from all the strata using SRS or systematic sampling
56
New cards
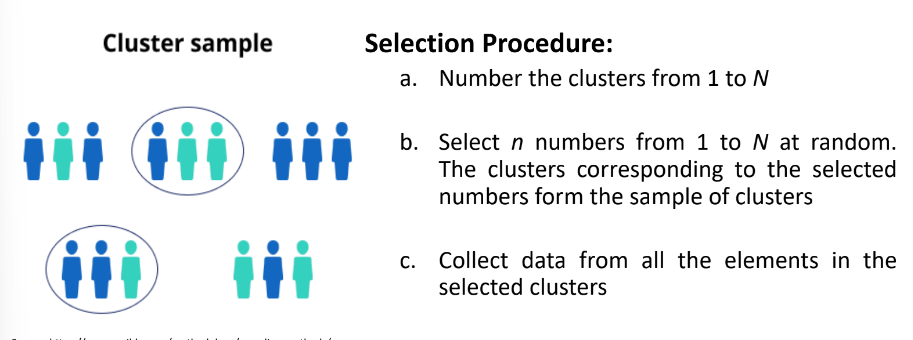
Cluster Sampling
A method of sampling where a sample of distinct groups, or ***clusters***, of elements is **randomly selected** and then a census or all elements in the selected clusters is taken.
\
Clusters are non-overlapping subpopulations which together comprise the entire population, and is preferably formed with heterogeneous.
\
Clusters are non-overlapping subpopulations which together comprise the entire population, and is preferably formed with heterogeneous.
57
New cards
Purposive Sampling
Convenience Sampling
Quota Sampling
Snowball Sampling
Convenience Sampling
Quota Sampling
Snowball Sampling
4 Types of Non-probability Sampling
58
New cards
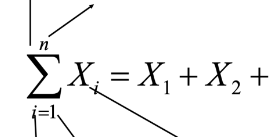
Summation Symbol
Upper Limit
Index of Summation
Lower Limit
Summand
Upper Limit
Index of Summation
Lower Limit
Summand
Parts of Summation Notation (from upper left, upper right, lower left, …)
59
New cards
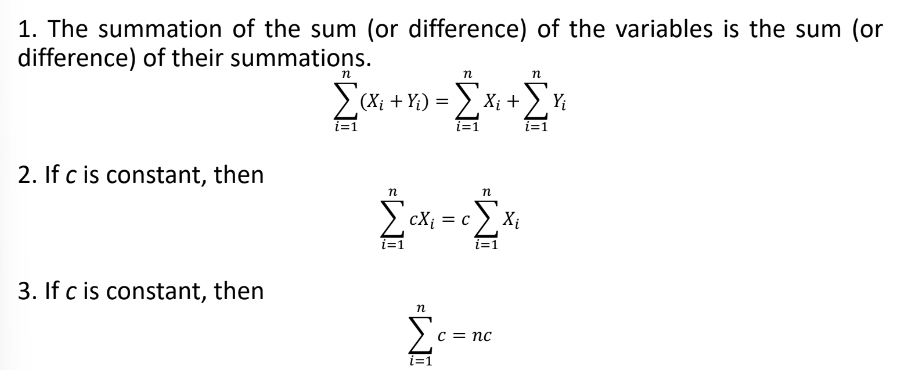
Rules on Summation
(ewn paano ipapasok huhu)
60
New cards
measure of central tendency
a value at the center or middle of a data set, that is, the value where the data tend to cluster
61
New cards
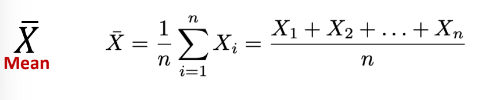
Mean
Measure of Central Tendency that is **average** value.
\
It is susceptible to extreme values, single value, and continuous data. It works well with many statistcial methods.
\
It is susceptible to extreme values, single value, and continuous data. It works well with many statistcial methods.
62
New cards
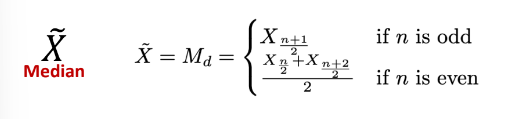
Median
Measure of Central Tendency that is the **middle value** **of an ordered data**.
\
It is not susceptible to extreme values, single value, and continuous data. It is often a good choice if there are some extreme observations.
\
It is not susceptible to extreme values, single value, and continuous data. It is often a good choice if there are some extreme observations.
63
New cards

Mode
Measure of Central Tendency that is the **most frequent value**. It locates the point where the observation values occur with the greatest density
\
It can be a single value, multiple values, may not exist. It can be categorical or continuous data. It is appropriate for data at **nominal and ordinal level.**
\
It can be a single value, multiple values, may not exist. It can be categorical or continuous data. It is appropriate for data at **nominal and ordinal level.**
64
New cards
Measure of variability or dispersion
It indicates the extent to which observations in a data set are **scattered about an average**. It is also used as a **measure of reliability** **of the average value**
65
New cards
True
__**True or False**__. The higher the measure of variability, the more dispersed the data is
66
New cards
Range
Variance
Standard Deviation
Standard Error of the Mean
Coefficient of Variation
Variance
Standard Deviation
Standard Error of the Mean
Coefficient of Variation
Measures of Variability
67
New cards

Range
A measure of variability which is the difference between the **highest value and the lowest value** in the data set.
\
It uses extreme values; an outlier can greatly alter its value. It fails to communicate any information about the clustering.
\
It uses extreme values; an outlier can greatly alter its value. It fails to communicate any information about the clustering.
68
New cards
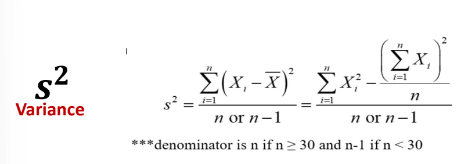
Variance
A measure of variability which refers to the **mean of the squared deviations** **of the observation from the mean**. It is not a measure of absolute dispersion. It can only take the values from 0 to +∞
69
New cards
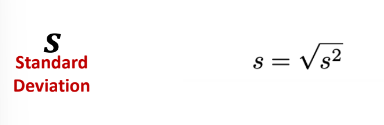
Standard Deviation
A measure of variability which refers to the **positive square root of variance**. It is the **measure of absolute dispersion**.
70
New cards
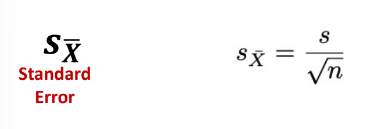
Standard Error
A measure of variability which refers to the **standard deviation of the sampling distribution of the mean**. It provides a tolerance of an estimate of the mean which is calculated from a sample
71
New cards
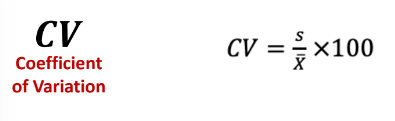
Coefficient of Variation
A measure of variability which refers to the **ratio of the standard deviation and the mean** and is expressed in percentage.
\
It is Unitless. It is used to **compare the variability** of two or more data sets
\
It is Unitless. It is used to **compare the variability** of two or more data sets
72
New cards
Measures of Skewness
It tells us the distribution of data. It can be revealted through a comparison of the mean, median and mode.
73
New cards
skewed
A distribution of data is _____ if it is **not symmetric** and extends more to one side than the other
74
New cards
symmetric
A distribution of data is ______ if the left half of its histogram is roughly a **mirror image** **of its right half**
75
New cards
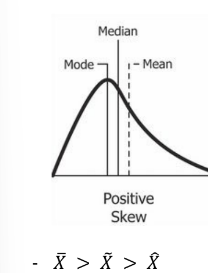
Positive Skew
__**Measures of Skewness.**__ It is ‘skewed to the right’. It has more concentration of values below the mean.
76
New cards
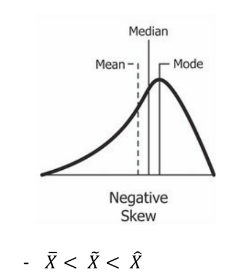
Negative Skew
__**Measures of Skewness.**__ It is skewed to the left. It has more concentration of values abovethe mean.
77
New cards
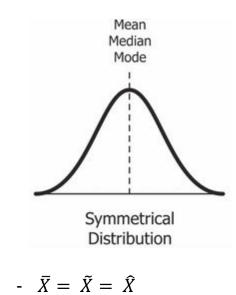
Symmetrical Distribution
__**Measures of Skewness.**__ It is ‘normally distributed’. It has approximately same values for the three central tendencies
78
New cards
Percentile
Quartile
Quartile
Measure of Location
79
New cards
Quartile
It divides a set of data into **four groups** with about 25% of the values in each group.
80
New cards
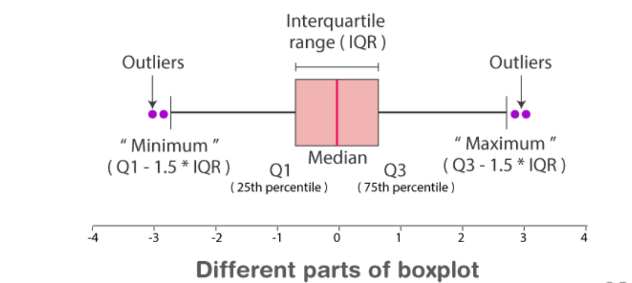
Boxplot
Graphical Presentation that gives information about the **distribution and spread of data.** It shows information on the minimum and maximum value, Q1,Q2, and the median
81
New cards
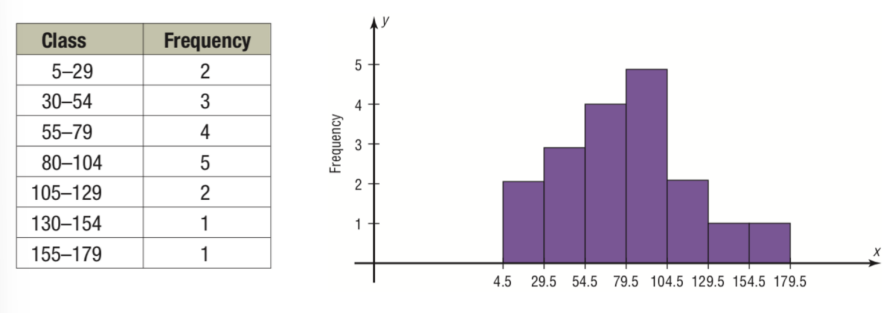
Histogram
Graphical Presentation in which the classes are marked on the horizontal axis and the class frequencies on the vertical axis.
\
The class frequencies are represented by the heights of the bars, and the bars are drawn adjacent to each other.
\
The class frequencies are represented by the heights of the bars, and the bars are drawn adjacent to each other.
82
New cards
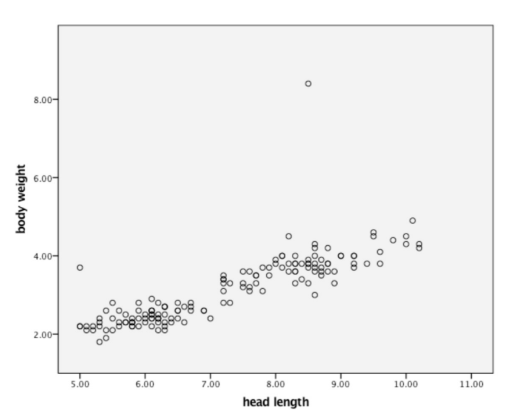
Scatterplot
Graphical Presentation that is used to evaluate the relationship between two different continuous variables.
83
New cards
Probability
It is a quantitative measure of uncertainty. It is a number that expresses the strength of our belief in the **occurrence of an uncertain event**
84
New cards
Random experiment
It is any process that allows researchers to obtain observations. It is any process that can be repeated under basically same conditions and yields well defined outcomes.
\
ex. toss coin
\
ex. toss coin
85
New cards
Sample space (S)
It is the set of all possible outcomes of a random experiment.
\
ex. {head, tail}
\
ex. {head, tail}
86
New cards
sample points
Elements of the sample space.
87
New cards
n(S)
\
ex. toss coin, n(S) = 2
\
ex. toss coin, n(S) = 2
number of sample points is denoted by ____
88
New cards
Event
A subset of the sample space
89
New cards
Classical Approach
Relative Frequency Approach
Subjective Probability
Relative Frequency Approach
Subjective Probability
Three Types of Probability
90
New cards
Classical Approach
Based on the idea that **certain occurrences are equally likely**, that is, we assume that in a given experiment, **all the sample points in the sample space have equal chances** of occurring
91
New cards
priori probability
Classical Approach is also called as ______. We can state the answer in advance without performing the experiment.
92
New cards
Relative Frequency Approach
An **experiment is conducted or observed** in large number of times that an event actually occurs, that is, probabilities are determined based on **experimental approach**
93
New cards
posteriori probability or empirical method
Relative Frequency Approach is also called as ______
94
New cards
Subjective Approach
It is based on the beliefs of the person making the probability assessment.
95
New cards
Law of Large Numbers
This law states that “**as a procedure is repeated again and again, the relative frequency probability of an event tends to approach the actual probability**”
96
New cards
random variable
a variable that has a single numerical value (determined by chance) for each outcome of a random experiment
\
It is denoted by X, Y, Z.
\
It is denoted by X, Y, Z.
97
New cards
Discrete Random Variable
Continuous Random Variable
Continuous Random Variable
2 Types of Random Variable
98
New cards
Discrete Random Variable
__**Types of Random Variable**__. It has either a **finite** number of values or a countable number of values.
\
ex. coin (h or t)
\
ex. coin (h or t)
99
New cards
Continuous Random Variable
__**Types of Random Variable**__. It has **infinitely** many values which can be associated with measurements on a continuous scale
100
New cards
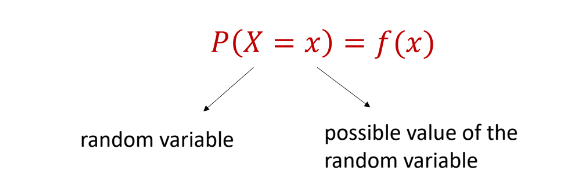
Probability distribution
the listing of all possible value that a random variable can take on together with their corresponding probabilities.