Stats 2
1/25
There's no tags or description
Looks like no tags are added yet.
Name | Mastery | Learn | Test | Matching | Spaced | Call with Kai |
|---|
No study sessions yet.
26 Terms
μ
population mean
x̄
sample mean
σ2
population variance
s2
sample vairance
σ
population standard deviation
s
sample standard deviation
p
population proportion
p̂
sample proportion
confidence interval for population characteristic
range of values that is likely to contain the desired characteristic you’re looking for
Ex: if you have a confidence interval of 95%, then out of all the 100 confidence intervals you have, 5 of the intervals will NOT contain the true mean (the value you’re looking for), but 95 intervals will
steps in constructing confidence intervals
write down appropriate formula
calculate appropriate critical value
substitute values into the formula
simplify
write solution in interval notation
interpret the interval
general form of confidence interval
(pt estimate using a specific statistic) ± (critical value) * (estimated standard deviation of the statistic)
x̄ ± zα/2 * σ/(√n)
As the ___________ increase, the chi-square curve approaches a __________ __________
degrees of freedom ; normal ; distribution
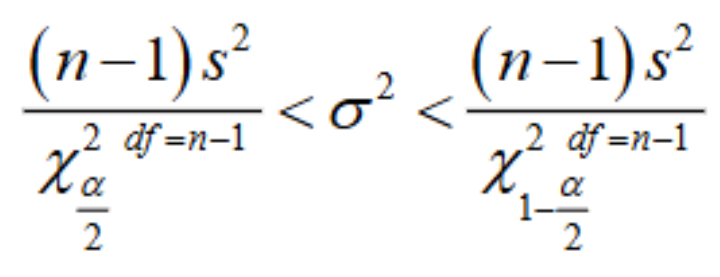
confidence interval for population variance formula
conditions required for a valid confidence interval for σ2
random sample is selected
the sample selected has a normal distribution (bell-curve)
test of hypotheses/test procedure
use sample data to decide between two competing hypotheses/claims about a population characteristic
null hypothesis
H0
Claim that is assumed to be true
alternative hypothesis
Ha
Claim that is the opposite of H0
Form of a null hypothesis
H0: population characteristic = hypothesized value
Ha: population characteristic > hypothesized value
right-tailed test (one tail)
Ha: population characteristic < hypothesized value
left-tailed test (one tail)
Ha: population characteristic ≠ hypothesized value
two tailed test
Type I error in hypothesis testing
You reject the null hypothesis when it was actually true
Type II error in hypothesis testing
You determine the alt. hypothesis is true when it was actually false
probability of a Type I error is denoted by ___
α
probability of a Type II error is denoted by ____
β
Steps of Test of Hypothesis (using a Rejection Region)
define null and alternative hypothesis
write down formula of test statistic and indiciate appropriate distribution
plug and chug
sketch image of distribution
calculate and state rejection region
write conclusion in context of problem