genetics- quantitative traits
1/27
There's no tags or description
Looks like no tags are added yet.
Name | Mastery | Learn | Test | Matching | Spaced | Call with Kai |
|---|
No analytics yet
Send a link to your students to track their progress
28 Terms
quantitative traits overview
traits that are measurable
rely on multiple genes
variation in traits
lots of possible phenotypes
slight changes in phenotypes
continuous variation of traits
quantitative traits
display continuous variation
measured and described in quantitative terms (quantitative inheritance)- multiple genes
range of different phenotypes
display continuous variation
polygenic
input for multiple genes
multiple genes control phenotype
varying phenotypes result from input of many genes
multifactorial traits
result of both gene action and environmental influences
phenotype relies on genetic genetic input (alleles) and environment (cellular and/ or outside environment)
quantitative patterns
mendelian factors could not account for the range of phenotypes seen in quantitative patterns of inheritance
multiple-gene hypothesis
multiple alleles
more certain types of alleles —> change phenotype
many contribute to phenotype in a cumulative/ quantitative way
discontinuous traits (discrete)
simple pheno and geno relationship
show only a few distinct phenotypes
Aaco
continuous traits
hegight mass, measurable traits- lots of variety and different outcomes
DO NOT follow mendel’s laws and principles
so many possible phenotypes b/c polygenic (multiple alleles, not environment) or multifactoral (genes and environment)
medicine
disorders are characterized by variation
many disorders caused by multiple genetic/environmental factors
goood to understand for
prevention
genetic counseling
treatments
agriculture and farming
bigger and BETTA food
economics
breeding programs
crops
livestock
big torkey
polygenetic traits
multiple genes
measured in large samples bc need large sample size to rep a population for #good stats
mode
value most frequently observed
3,3,3,5,6,6,7
mode is 3
median
middle value of set of values
if even take mean of two middle values
3,3,3,5,6,6,7
median is 5
mean
average
sum of values divided by number of samples
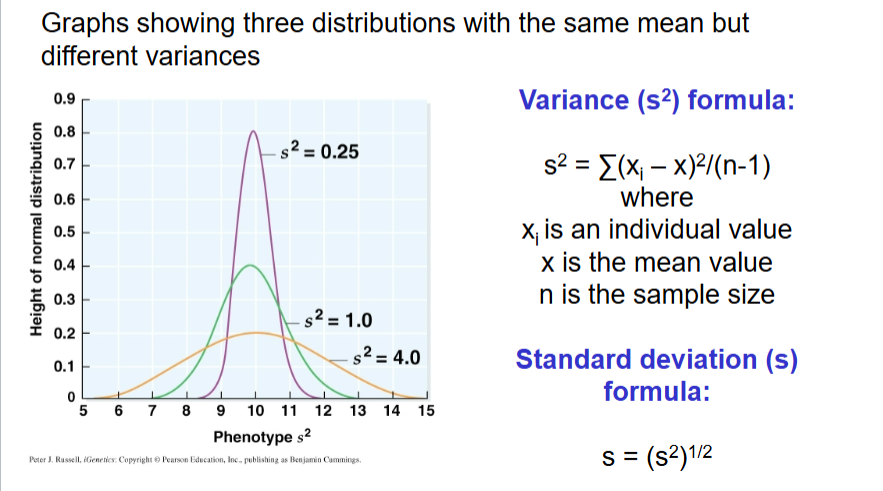
variance
distribution of measured values in relation to the mean
covariance
measures the shared variation of two traits by an individual
measures how much two random variables change together
do they both increase
does one increase and the other decreases
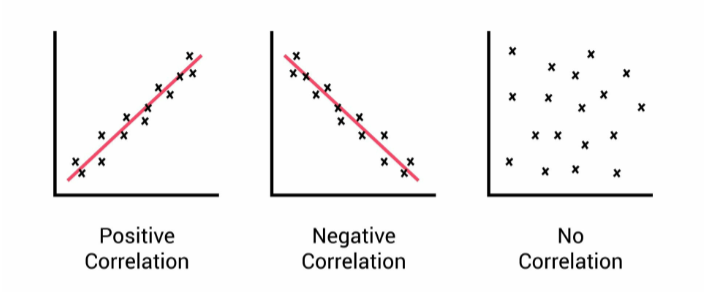
correlation coeficcient r
measure of how traits are associated
varies from -1 to 1
closer to 1 = better related/correlated
CORRELATION DOES NOT EQUAL CAUSATION
r values
quantitative traits are described by
a frequency distrubution (histogram)
bins make it possible to see bellcurve
WE WANT DA BELLCURVE
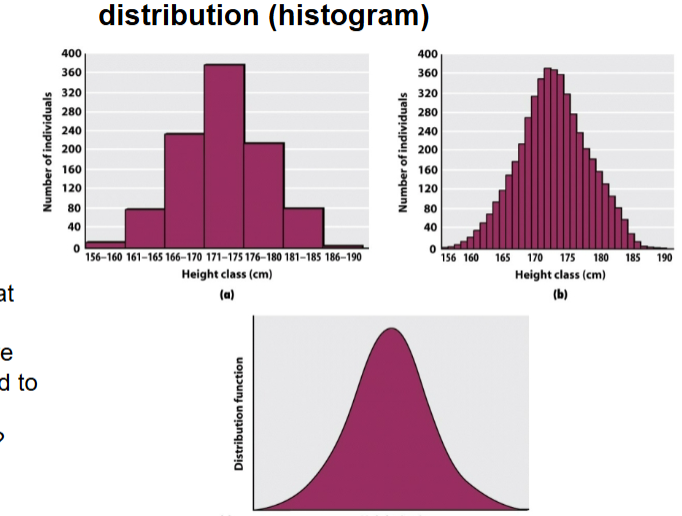
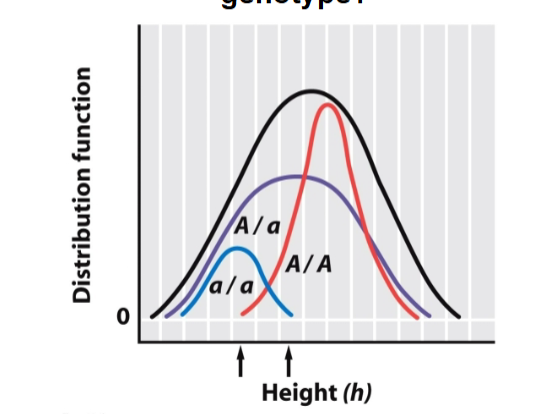
PROBELM with pheno disribution on chart
hard to make geno and pheno distinguish bc of overlap
pheno can only be within a certain range, depends on trait being analyzed
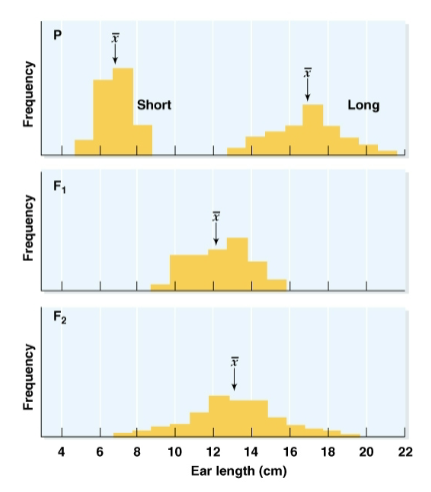
what is distinctive abt polygenic inheritance
mean of F1 is intermediate to the means of two parents
but F2 shows greater standard deviation and range
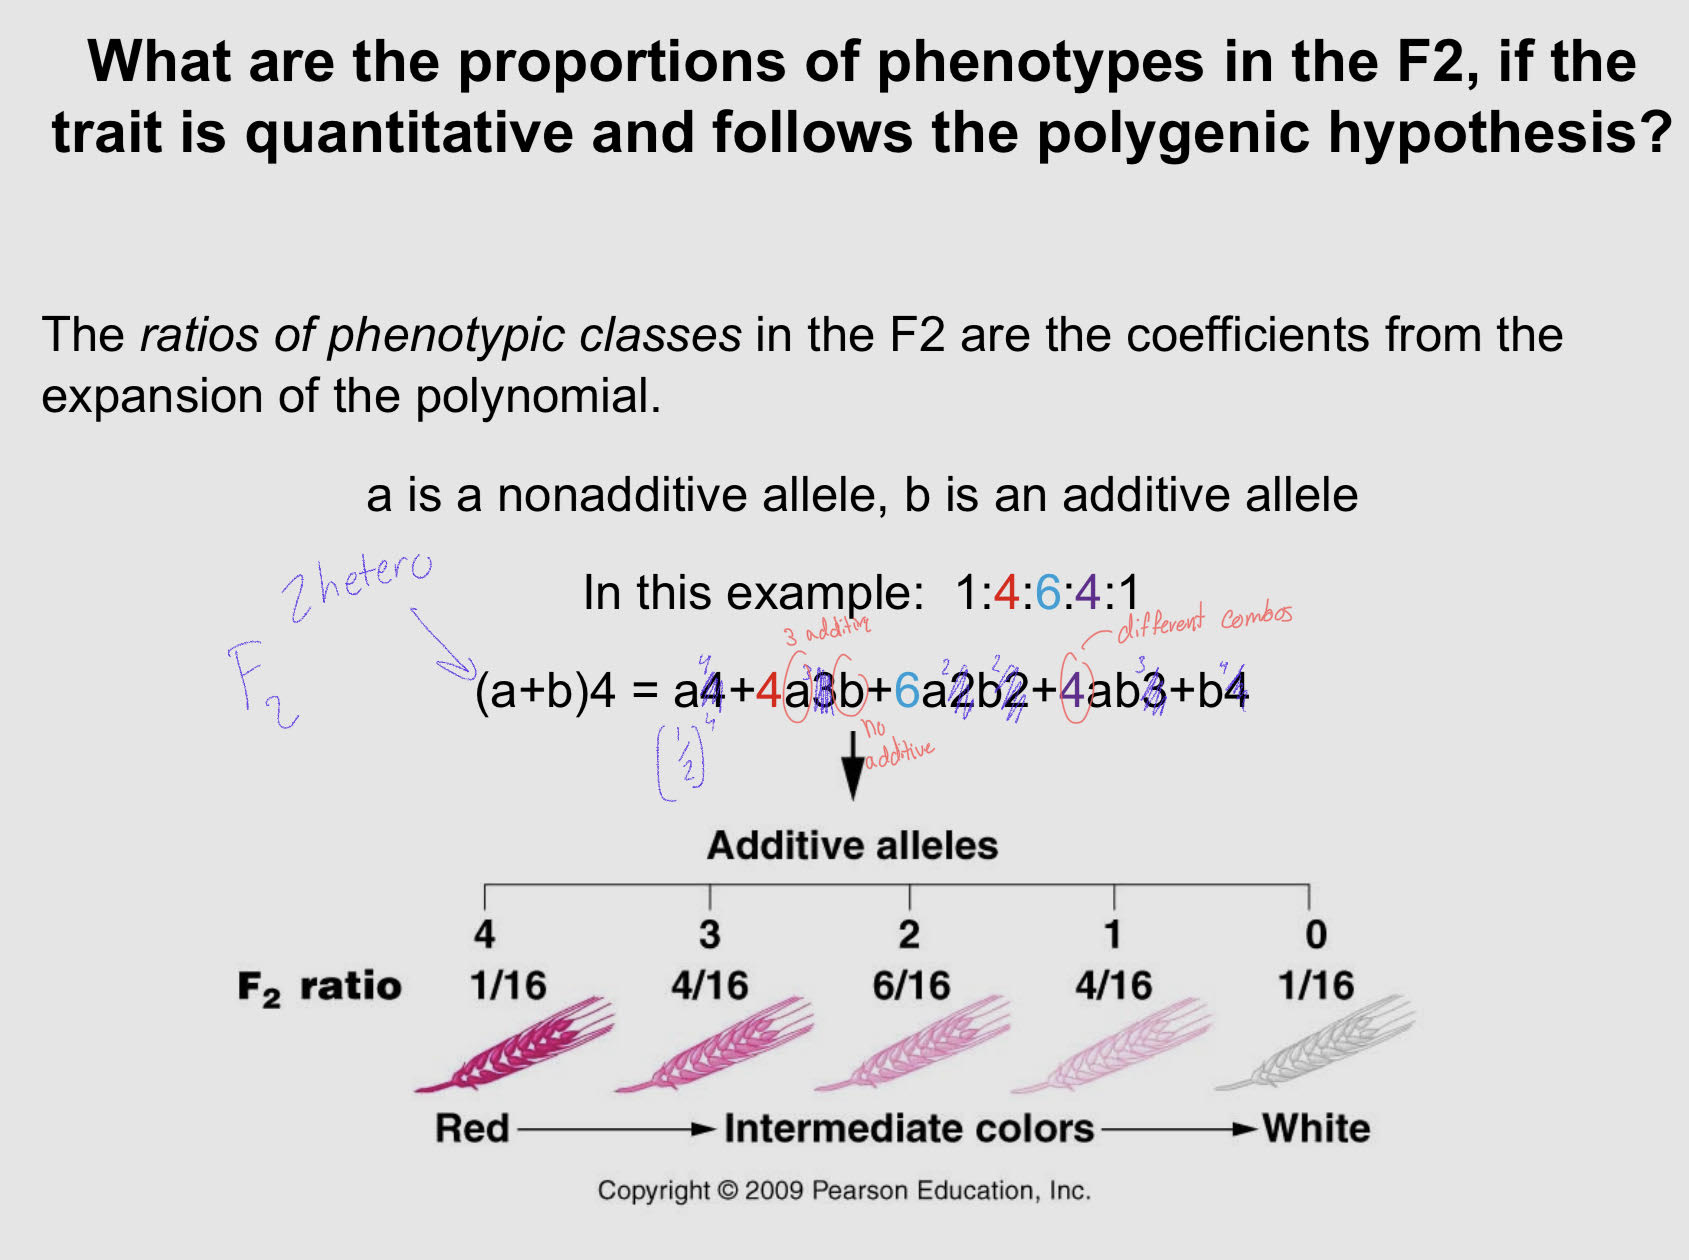
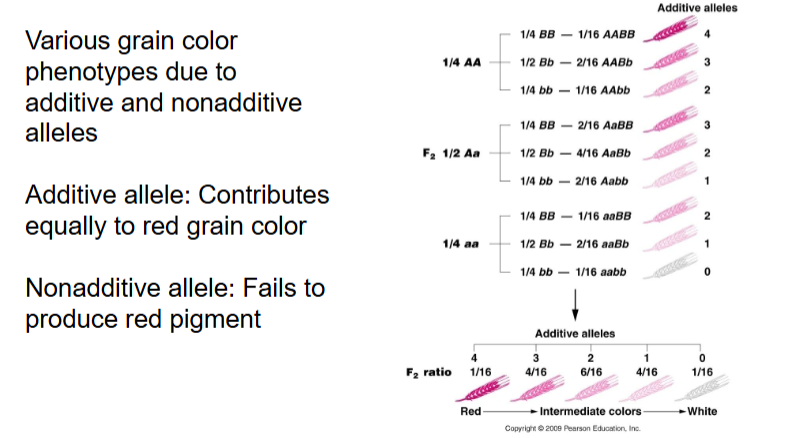
polygene hypothesis
phenotypes result from input of many genes
each gene locus may be occupied by either an additive allele or a nonadditive allele
phenotype is based on how many additive alleles you havea
additive allele
contributes equally to the phenotype
nonadditive allele
does not contribute to the phenotypedi
difference between additive alleles and incomplete dominance
more of a range of phenotypes
additive allele practice probelm
Two genes in corn, each with two alleles, contribute to ear length
• allele L contributes to long ears; allele l does not
• allele T contributes to long ears; allele t does not
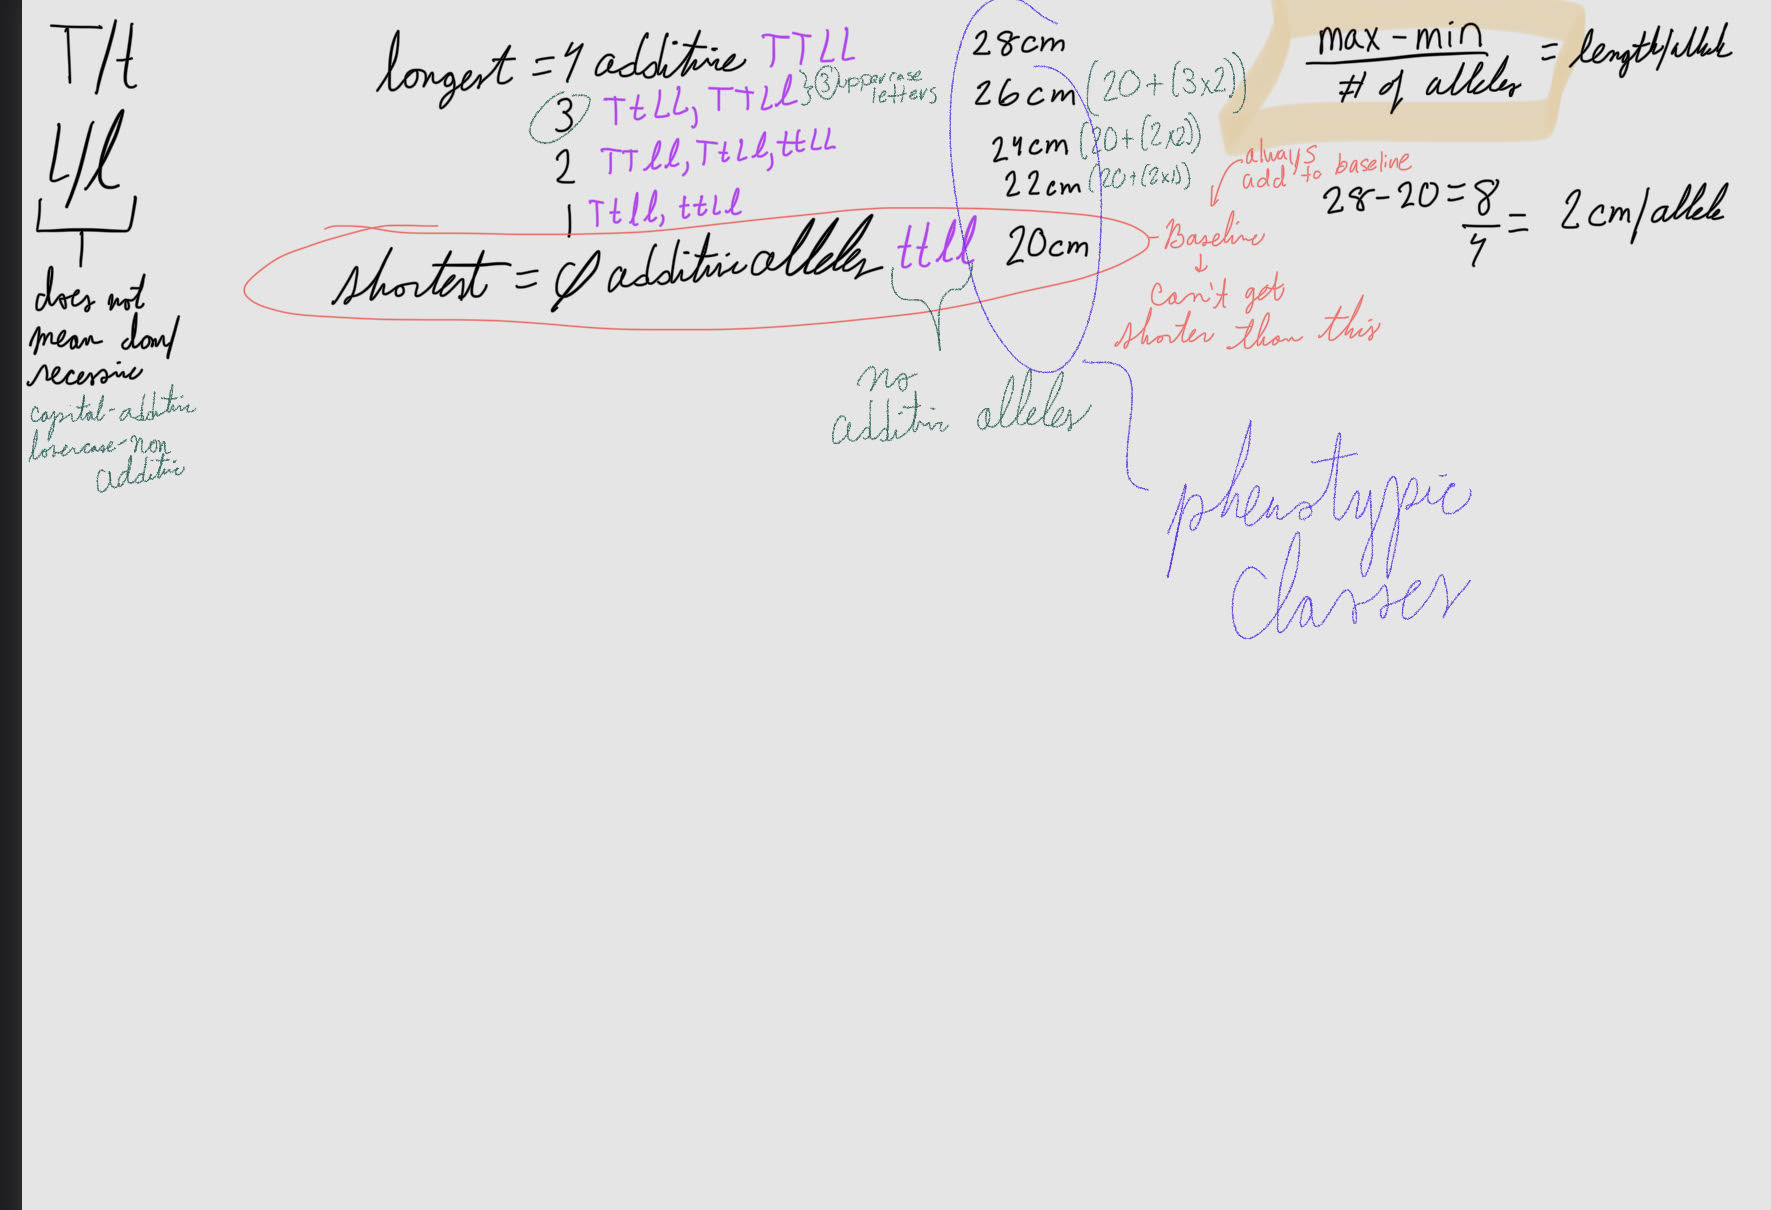
to find proportions of phenotypes in the F2, if the trait is quantitative and follows the polygenic hypothesis
(a+b)n
n is total # of alleles in a genotype
a is a nonadditive allele, b is an additive allele
figure dis out