Exam 3 Statistics - Multiple Choice Questions for Psychology Course
1/21
There's no tags or description
Looks like no tags are added yet.
Name | Mastery | Learn | Test | Matching | Spaced | Call with Kai |
|---|
No analytics yet
Send a link to your students to track their progress
22 Terms
Which of these is the recommended first step of data analysis?
Determine all pair-wise statistical relationships
Look at the data using graphical techniques
Calculate effect sizes
Conduct an omnibus test
B
By holding constant the content of an email, but randomly assigning professors to see one of 10 different types of names for the sender (the names pre-tested to reliably signal different gender/race identities), what type of validity did Katherine Milkman strengthen?
[At least one, and perhaps more, is correct. Select all that are correct.]
Statistical
Construct
External
Internal
B, D
construct validity
the extent to which variables measure what they are supposed to measure
In what way(s) are t-tests and ANOVAs similar? (SELECT ALL that apply )
We do not know the true population variance.
We can estimate the variance of each population from the sample scores.
They are both hypothesis testing procedures for 3 or more groups.
We assume all populations have the same variance.
ABD
A high school guidance counseling director confidentially identified a sample of the schools' students whose answers to several items on a recent health survey combined to suggest a disturbingly high level of depression. The next week, during already scheduled counselor meetings, these specially identified students' counselors included a five-minute lesson on stress management techniques (the students did not know that they had received this lesson because of their high depression score).
When all of the schools' students again completed the health survey at the end of the week, the average depression score of those who had received the stress management lesson had fallen significantly.
Which major type of confound (from among the nine we've studied) is most threatening to the school counseling director's belief that the stress management lesson reduced the students' depression?
regression to mean
What does a statistically significant p-value indicate for a correlation coefficient?
The correlation is at least "small" by Cohen's conventions
p-values are not relevant to interpreting correlation coefficients
The correlation is probably not zero.
The correlation is probably not 1.
C
When conducting a planned contrast of two groups after finding a significant omnibus ANOVA result with three or more groups, which of these statistics must be recomputed?
[At least one, and perhaps more, must be recomputed. Select all that must be recomputed.]
A- dfWithin
B- SSBetween
C- dfBetween
D-SSWithin
E- The grand mean
F- The observed F value
BCEF
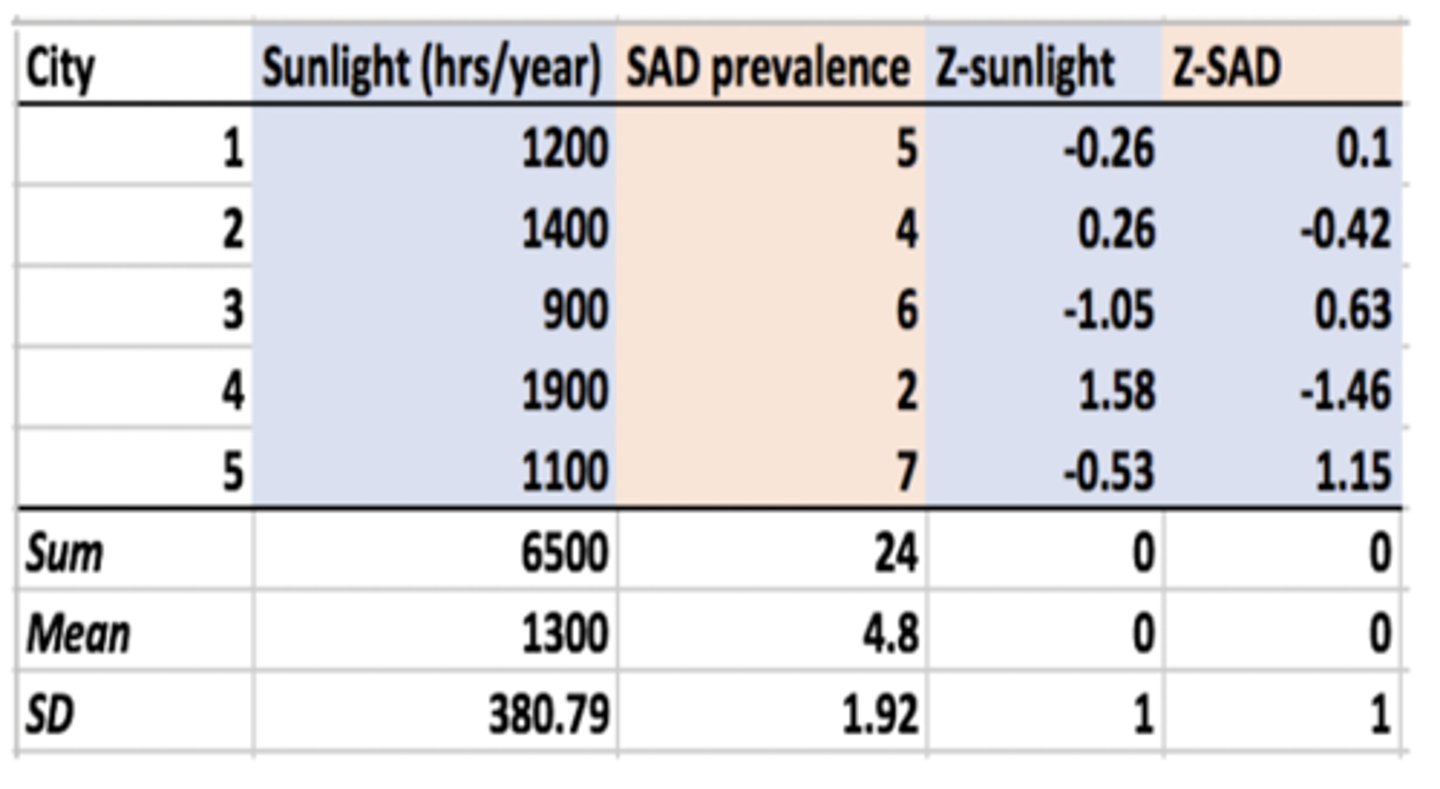
A researcher wonders whether there is a relationship between the amount of sunlight a city gets and the prevalence of seasonal affective disorder (SAD) in that city. SAD scores are reported on a 10-point scale with higher numbers indicating a higher prevalence of SAD in that city. The researcher's data are summarized here:
Help the researcher out by calculating Pearson's correlation. Show your work on your scratch paper under the label "Correlation Calculation" and enter your answer here:
The estimated correlation between sunlight and SAD is
[round to two decimal places].
--
Correct answer:
-0.74
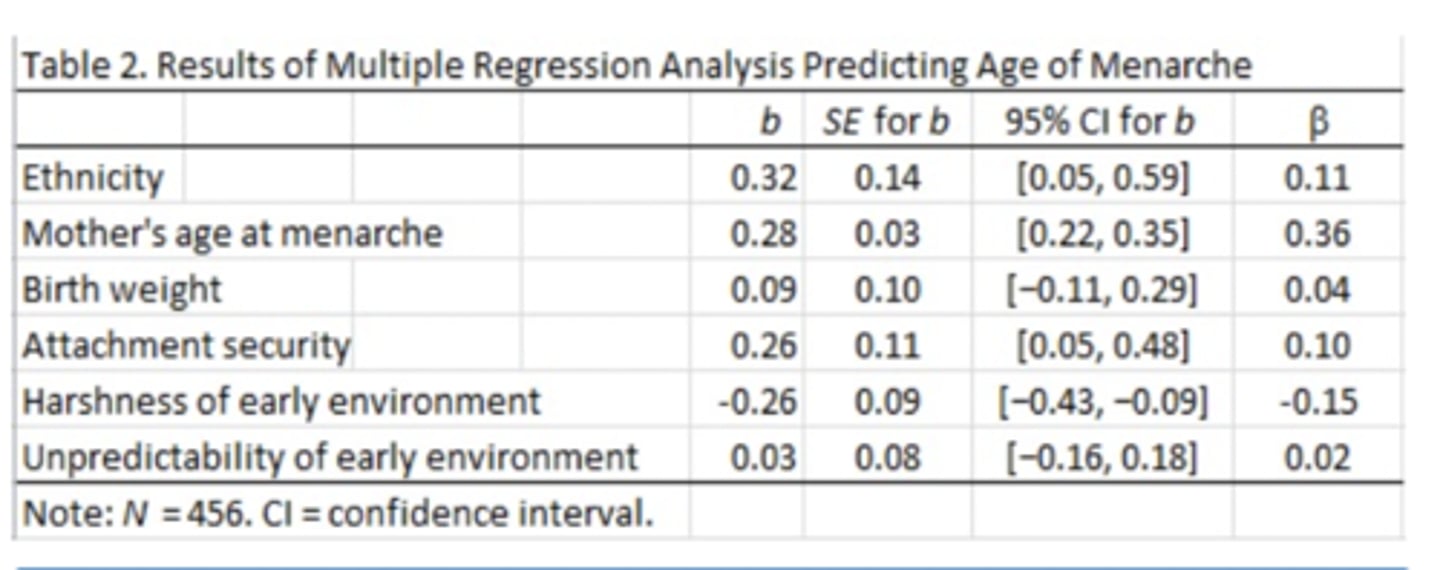
This table gives the multiple regression results for the prediction of Age of Menarche (first menstrual period). Put into words the meaning (specific interpretation) of the standardized multiple regression estimate for the effect of "harshness of early environment" in the context of this analysis.
With other predictors equal (or "accounted for" or "held constant"), a 1-standard deviation increase in the harshness of early environment predicts a 0.15-standard deviation decrease in age of menarche onset.
This graph shows the effects of three variables on a math test: (1) gender (participants self-identified as female or male), (2) strength of personal gender identification (relatively low or relatively high), and (3), by random assignment, whether or not gender identity was relevant to math performance (that is, half of participants were told that examining the relationship between gender and math performance was a focus of the study, and half were not told this).
The highest level of research design constraint used in this study is
experimental
If we look just at the graph on the right (showing participants who were told that the relation between gender and math performance was relevant to the study), we see that there is not a simple answer to the question, "What is the relation between strength of gender identification (low vs. high) and math test scores?" Rather, the answer depends on participants' self-reported gender, male or female. That is, for self-described male students, strong gender identification was associated with higher math performance, while for self-described female students, strong gender identification was associated with lower math performance.
In this case, self-reported gender, female or male, would be referred to as a(n)
moderator
variable.
The type of validity that is most focused on the demonstration of causation is ________
validity.
internal
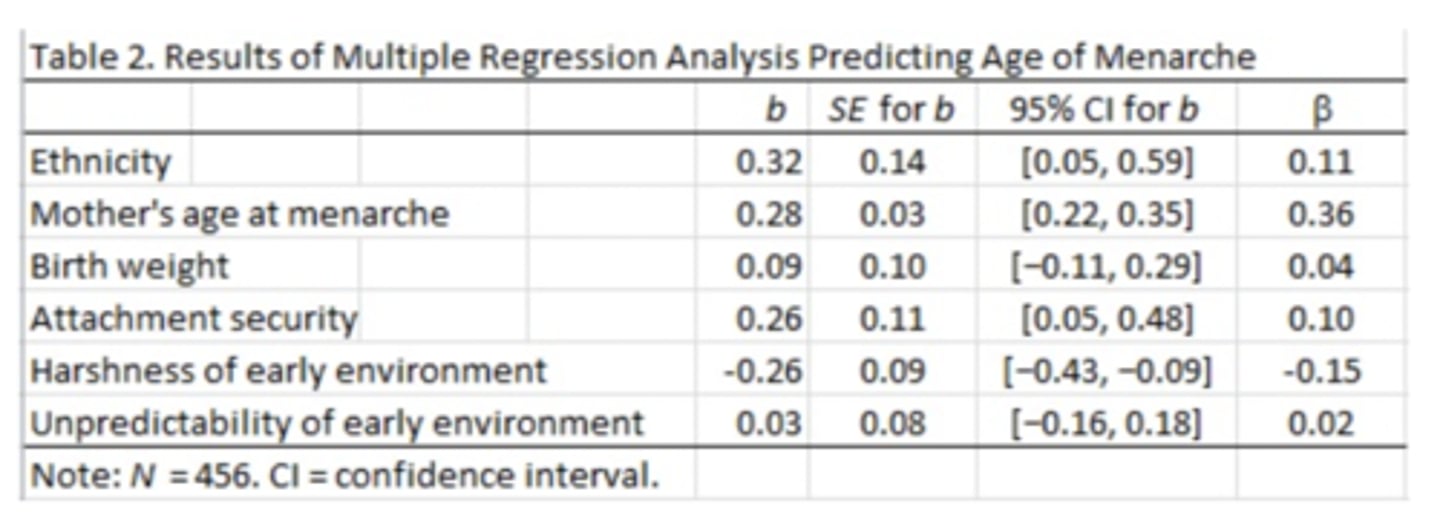
In the multiple regression results shown in this table, which of the following predictors is statistically significant at alpha level .05?
Mother's age at menarche
Birth weight
Ethnicity
Harshness of early environment
,Unpredictability of early environment
Attatchemnet security
ACDF
Which of the following is true for F-tests?
[At least one, and perhaps more, is true. Select all that are true]
The critical-F for a given alpha varies according to numerator and denominator degrees of freedom
F-tests are used to determine if three or more groups come from the same underlying population
F-tests cannot tell you the direction of a significant effect
F-tests are always two-tailed
ABC
How do we best ensure high interrater reliability?
Have them work together
Select highly qualified and motivated Research Assistants
Randomly check 20% of their ratings
C
Using a sentence or two, define the two primary characteristics of a confounding variable.
It must vary similarly to the independent variable.
t must have an effect on the dependent variable.
The F-distribution is a heap of what sort of numbers?
Z scores
raw scores
means
standard deviations
ratios
E
In regression, the baseline error (SSTotal) in the prediction of your criterion variable, Y, is derived from deviations of Y scores from
Y scores squared.
X scores.
the mean of Y.
the mean of X.
X scores squared.
C
For one variable, which value results in the smallest sum of squares?
median
mean
mode
answer depends on sample size
B
You have conducted an Analysis of Variance of six groups that revealed a significant F value. Now you would like to test the significance of each of the possible pairwise comparisons. With a sentence or two, explain why you would apply the Bonferroni procedure as you make the comparisons. [Note that you’re not being asked how the Bonferroni is done. You’re being asked to clarify why you would use it in this situation. Thirty well-chosen words are more than enough!]
Conducting multiple statistical tests would increase our chances of a false positive. The Bonferroni procedure keeps a cap on the overall (i.e., "family-wise") false positive rate.
Which random assignment approach is best to use when sample sizes available for experimental conditions are small? The ___________ random approach
matched
random approach.
If a variable's range is restricted in your study, the strength of its correlation with another variable of interest is likely to be _______ than is true in the population. (higher or lower)
lower