3.4 Finding Z-Score, Percentiles and Quartiles, and Comparing Standard Deviation Practice
0.0(0)
Card Sorting
1/4
There's no tags or description
Looks like no tags are added yet.
Last updated 1:30 PM on 1/2/26
Name | Mastery | Learn | Test | Matching | Spaced | Call with Kai |
|---|
No analytics yet
Send a link to your students to track their progress
5 Terms
1
New cards
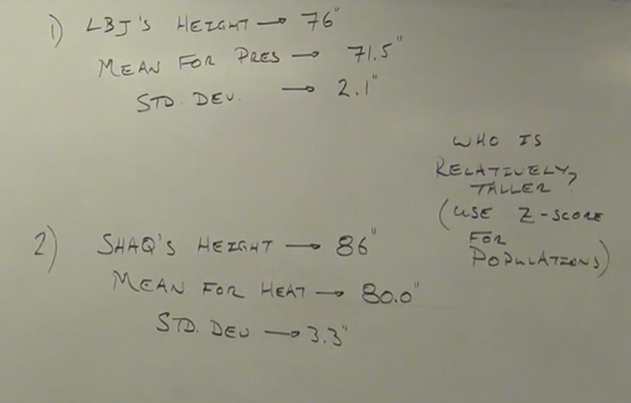
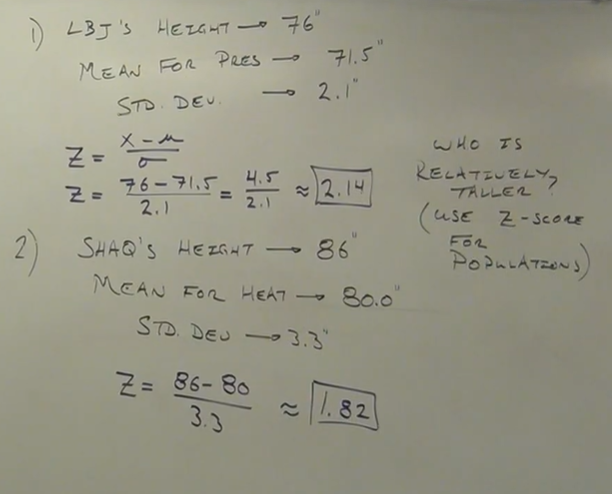
(1) Who is relatively taller?
(2) Figure out which data is usual and unusual.
(1) LBJ is relatively taller
(2) Usual and Unusual
Usual — 1.82 is usual data
Unusual — 2.14 is unusual data
2
New cards

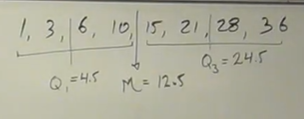
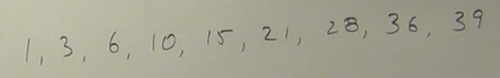
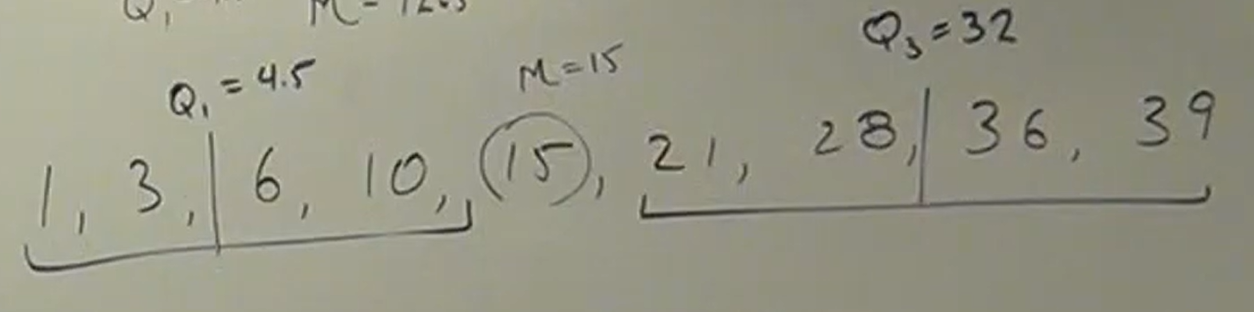
Find the quartiles, Q1, Q2, Q3, Q4.
Q4 does not exist
3
New cards
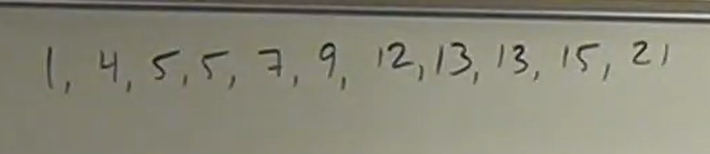
Find the quartiles, Q1, Q2, Q3, Q4.
Q4 does not exist
4
New cards

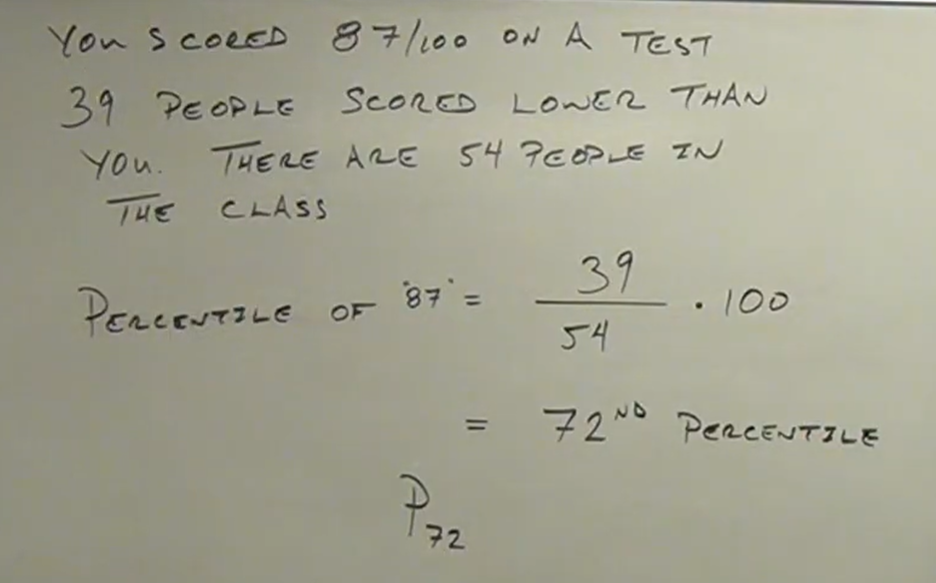
Find your percentile.
5
New cards
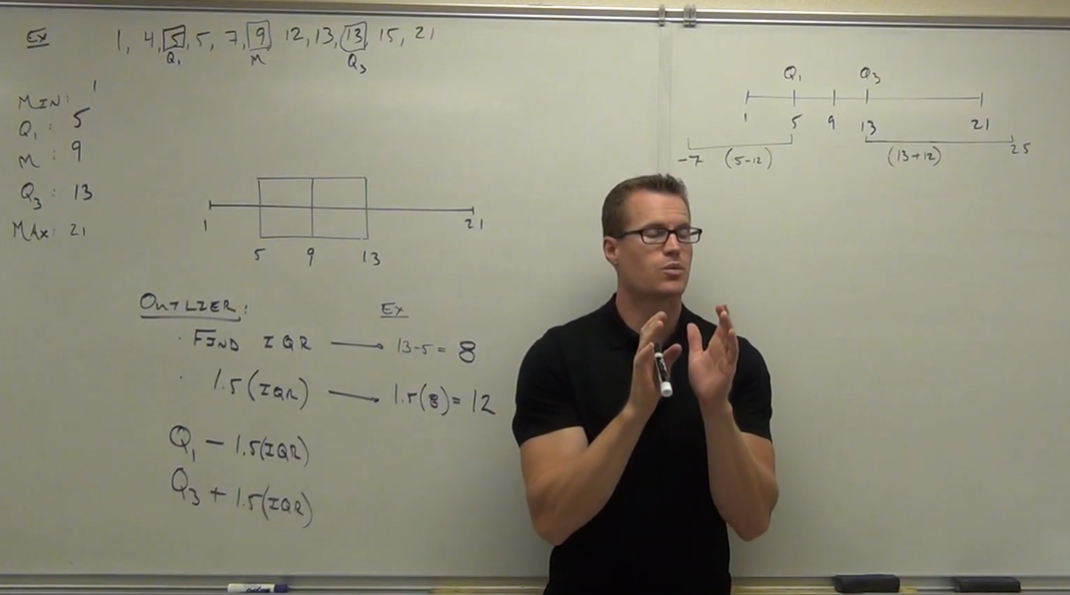
(1) Create a box plot.
(2) Determine if there are any outliers.
(2) the minimum and maximum values are not outliers