Introduction to Econometrics IBEB
1/102
Earn XP
Description and Tags
Name | Mastery | Learn | Test | Matching | Spaced |
|---|
No study sessions yet.
103 Terms
What is a cross-sectional data set?
When many individuals are observed once and compared.
What is a time-series data set?
When data is collected over time.
What is conceptualization?
The process through which we specify what we mean when we say particular terms in research.
What is operationalization?
The development of specific research procedures that will produce empirical observations representing those concepts in the real world.
What does the quality of operalization depend on?
Reliability: Quality of measurement method suggests the same data would be collected each time in repeated observations of the same phenomenon.
Validity: Does the measure accurately reflect the concept it is supposed to measure?
What does sample covariance tell us?
Whether X and Y move in the same or opposite directions. Sample correlation coefficient can be used if the units of the covariance are weird because correlation coefficient is unitless
What are residuals?
Residuals are the differences between observed values of Y and the predicted values from the regression.
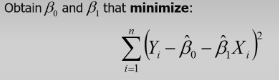
What does the Ordinary Least Squares do?
It minimizes the distance between data points and fitted line.
Can you assume that correlation is a causal effect?
No, OLS is only causal under OLS assumptions. If assumptions don’t hold, it’s only a correlation not a causation.
What is R2?
It is the proportion of the sample variance of Yi that is explained by the regression model Xi.
So: the explained sum of squares divided by the total sum of squares.
It is between 0 and 1 with 1 meaning the model predicts Y perfectly.
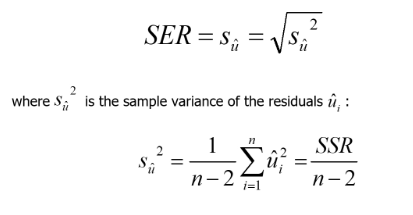
What is the Standard Error of Regression? (SER)
The spread of the scatterplot around the fitted regression line. A large value here means predictions are often very different from actual results.
To determine if the SER is large, it should be compared to the standard deviation of Y.
What are the OLS assumptions?
Zero conditional mean assumption (ZCM or exogeneity)
Y and X are independent and identically distributed
Large outliers are unlikely.
What is the Zero Conditional Mean (ZCM) assumption?
The expected value of the error term is 0, meaning it doesn’t depend on the value of X. - No correlation between u and X.
Holds when:
X is random
If not random: we need to believe that X is uncorrelated with other factors that influence Y, “As good as random”
This is because if X is correlated with other factors, we do not know that it is the X that causes the shift in Y, making it a correlation not a causation
When does the condition of observations being independent and identically distributed not hold?
When observations are dependent
Sample is one unit of observation over time - time-series data is always dependent - dependent on the results from previous years.
There are time series models that deal with this
The sample contains multiple observations, each being observed at several times
Called penal data
When the sample is not representative
What is panel data?
Data that contains multiple observations, each being observed at several times
What is a potenital source of large outliers in X and Y?
Data errors that can be fixed or dropped from the data.
What does ui capture in the linear regression equation?
The effect of other factors that are not Xi.
What would happen if we could draw all possible random samples?
We would obtain the true value on average, and the OLS estimator would be unbiased.
What is the difference between the OLS estimator and estimate?
Estimator: A Random variable that is different for each sample. It’s a function (think “recipe”) defined before you see the data.
Estimate: The Actual estimate that we obtain with our sample.
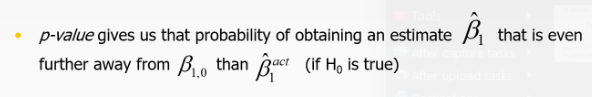
What does the p-value give us?
What is the meaning of the confience interval?
Assuming 95%: The confidence interval will contain the true value of beta1 95% in 95% of the cases.
Do we assume homoskedasticity in OLS estimation?
No. We usually use heteroskedastic robust standard errors.
What is homoskedasticity and what happens when it holds?
It means that the error term has a constant variance; variance does not depend on X.
It entails that the formula of standard errors can be simplified.
The OLS estimator is also efficient (minimum variance) among all unbiased linear estimators.
Does the magnitude of an effect matter when doing econometrics research?
Yes, statistical significance does not necessarily imply economic significance.
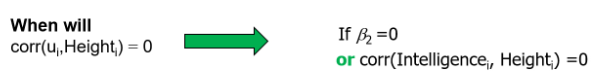
When does the Zero Conditional Mean (ZCM) assumption hold while including a new variable?
The assumption only holds if beta2 is 0, or the correlation between the two variables is zero
What can be a solution to ZCM assumption not holding causing Omitted Variable Bias (OVB)
Adding additional variables to the model, creating a multiple regression model.
What are the assumptions of the multiple regression model?
For causal inference of effects of X1, X2, ……
Zero conditional mean assumptions
For causal inference of the effect of X1
Conditional mean independence, Error term should be independent of X1
(Yi, Xi) i.i.d (independent and identically distributed)
Large outliers are unlikely
No perfect multicollinearity
What happens if ZCM does not hold, but conditional mean independence holds in a multiple regression model?
We can only infer that the main variable is causal, while the other variables must be treated as purely a correlation.
What are the conditions for a valid instrumental variable?
Relevance: The instrument Z must be correlated with the endogenous regressor X. In other words, Cov(Z,X) ≠ 0. You can use TSLS or run the first stage model to test this assumption.
Exogeneity: The instrument Z must be uncorrelated with the error term ε in the main equation, i.e., Cov(Z,ε)=0. To see if this holds, one should question if it is “as good as random”. You cannot really test it.
What is a quasi-experiment?
A quasi‐experiment is a research design that attempts to measure the causal effect of some “treatment” or intervention without fully randomized assignment. Researchers use quasi‐experiments when they cannot randomly assign subjects to treatment and control groups—often for ethical, practical, or logistical reasons. Instead, they rely on certain methods or naturally occurring circumstances to approximate the conditions of an experiment.
What is the main advantage of cross-sectional panel data?
It can help control for time-invariant omitted variable bias. It allows you to difference out or remove any individual-specific factor that does not change over time.
What are the main threats to the internal validity of an experiment?the
Failure to randomize → The background info of participants should be checked to secure that the groups are representative of the population.
Failure to follow treatment protocol → Participants in the study do something they are not supposed to do.
Attrition → Participants dropping out
Experimental effects → Motivational effect and placebo effect.
What is the difference between endogeneity and exogeneity?
Endogeneity: Cov(X,ε) =! 0, explanatory variable is correlated with the error term.
Exogeneity: Cov(X,ε) = 0, explanatory variable is not correlated with the error term.
What are the limitations of using panel data?
Time-invariable variables drop out
Cannot remove time-varying ommitted variable bias
Coefficients are constant over time
What are the two essential steps for sampling?
Define the population
Use this population through either a random selection (allows using probability theory), or a non-random selection (does not allow use of probability theory.
What do the Durbin-Watson statistic numbers mean?
The Durbin–Watson (DW) statistic ranges roughly from 0 to 4.
DW ≈ 2 means no first‐order autocorrelation in the residuals.
DW < 2 suggests positive serial correlation.
DW > 2 suggests negative serial correlation.
'What is operationalization?
The process of developing specific procedures to empirically represent the concepts defined during conceptualization. In other words, it is about measuring theoretical concepts.
What does the Standrard Error Regression show?
It shows the spread of data points around the population regression line. Larger values indicate a stronger deviation from the predicted value.
What does the Zero Conditional mean assumption entail?
That there is no correlation between the explanatory variable X and other factors that explain Y, mainly the error term. The expected value of a residual value given X should therefore be 0. 𝐸(𝑢 𝑖 |𝑋 𝑖 ) = 0.
It is generally assumed that this holds with a random selection. It does not hold with simultaneous causality.
When does the assumption of Independendence and Identical distribution hold?
It holds when using a simple random sample, and this sample is taken from the same population. The distribution will be identical when taken from the same population, and the obervations are uncorrelated and therefore independent.
When is a model considered unbiased?
When OLS assumption 1 and 2 holds. (ZCM and i.i.d)
When does the variance of an estimated coefficient (β^1) decrease?
When the number of observations increases, when the variance of residual factors decreases, and when the variance of the explanatory variable, x, increases.
When is an OLS estimator (β^) consistent?
Consistency implies β^ → β. It holds true when:
ZCM of errors assumption holds
i.i.d assumption holds
There is no perfect multicollinearity
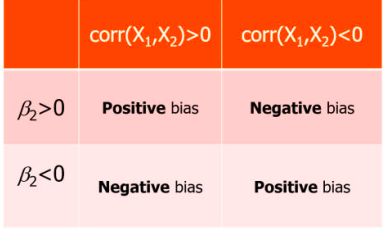
How do you determine the direction of bias of a variable?
By looking at the correlation and β values. If they are opposite signs, its negative. If they are the same sign, it is positive.
What is the conditional mean independence assumptions?
A weaker version of the ZCM assumption, used for multiregression models. It assumes that X1 is independent of the error term, while the rest of the variables get assumed as having a partial association to Y.
If the conditional mean independence doesn’t hold, there is an omitted variable bias in the model. Solving this can be done through a robustness check, by adding more variables to the model.
How is variance affected by other factors in a multiregression model?
Variance decreases with sample size n, β^ decreases with variance of Xj, increases with variance of error term, increases with correlation between X’s (imperfect 𝑖 multicollinearity), however, if assumption 1 holds, then the model is still unbiased.
What can we know through looking at the sign in front of quadratics in a polynomial regression?
With a positive sign of the coefficient before the variable, there are increasing returns to scale, when negative the return is decreasing.
What are the reasone for natural logarithmically transforming a regression model?
Large outliers in the right tail can be dealt with, making it more ikely for the 3rd OLS assumption to hold.
Used if one is interested in percentage changes.
How does perfect multicollineraty usually occur?
Including redundant variables
Dummy variable trap - not dropping a dummy variable results in perfect multicollinearity
With a log-linear model, how should the coefficient be interpreted?
A 1-unit change in X corresponds to a B1 × 100% change in Y. (Semi-elasticity)
In a linear-log model, how should the coefficient be interpreted?
A 1% change in X corresponds to a 0.01 * B1 change in Y.
In a log-log model, how should the coefficient be interpreted?
A 1% change in X corresponds to a B1 % change in Y. (Elasticity)
How is an interaction effect shown as a variable in a regression model?
Example: B1X1X2
When does ommitted variable bias occur?
If there is a variable that is omitted and is correlated with the variable of interest, as well as being a determinant of the dependent variable, then there is an omitted variable bias.
Is external or internal validity more important for Causal models?
Internal validity is more important.
Is external or internal validity more important for forecasting models?
External validity is more important.F
What can be done to minimize internal validity risks?
Proper sampling - choosing a representative population to make sure there is no sampling bias
Probability and non-probability sampling.
What is non-probability sampling?
Participants or units are selected non-randomly, often based on accessibility or the researcher’s judgment.
What is probability sampling?
Participants or units are selected randomly, each member of the population has a known chance of selection.
When is a panel data set balanced/unbalanced?
Its balanced when the duration observed is same for all the data, unbalanced if not.
What is panel data?
Observing the same individuals repeatedly at different points in time.
What do instrumental variables do?
Gets rid of OVB by isolating exogenous variations from endogenous ones.
What are endogenous and exogenous variables?
Endogenous: Correlated with error term → OVB
Exogenous: Not correlated with error term → No OVB
What are the conditions for a valid IV?
Relevance → the variable should have a explanatory power on the endogenous variable. Correlation between the instrument and dependent variable must therefore not be zero.
Exogeneity → IV must be uncorrelated with error terms.
What is the goal of TSLS?
To obtain consistent estimates of causal effects of an explanatory variable (endogenous regressor) on the dependent variable by removing the correlation between the enodgenous variable and the error term.
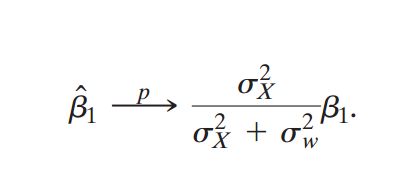
What is the classical measurement error model?
X^i = Xi + ei with corr(Xi, ei) = 0
How does variance affect classic measurement error?
If the measurement error variance is fixed, a higher true variance in the regressor reduces the relative impact of the classical measurement error on the estimated coefficients, and vice versa.
What is the Average Treatment Effect?
The expected difference in the outcome of units between the groups that receive a treatment and the control group.
For it to be valid you need a large sample and random treatment assignment to avoid selection bias.
What test can you do to see if the treatment assignment is random?
An F-test.
What is the main avantage of panel data over cross-sectional data?
It allows you to control for time-invariant omitted variable bias.
Is it possible to measure the individual causal effect from an experiment?
A person cannot be a part of both the treatment and the control group, hence you cannot infer an individual causal effect. This is why we primarily talk about Average Treatment Effect.
What is the Hawthorne effect?
A psychological effect where human’s act differently when knowing they are being observed for an experiment.
What are the main threats to external validity of an experiment?
Non-representative sample, e.g; drawing the sample from a region with high breast cancer rate.
General equilibrium effect → The experiment affects the behavior of a larger subset than initially anticipated.
Can we directly interpret the coefficient of the probit model?
The coefficient is given in z-values, which do not change the p-value uniformally, hence we can only interpret its sign and significance, not size.
What is Time Series Data?
A sequence observed and recorded at successive point in time with equal intervals in between.
What is a point forecast?
When a single forecast is made by a time series.
What is an interval forecast?
When there is some range of the forecasted variable.
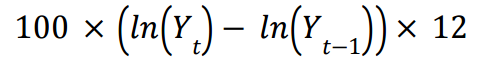
What is annualized growth?
The groth per given period scaled to be yearly growth.
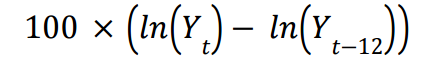
What is Annual growth?
The growth from a point to a point a year in the past.
What is the Durbin-Watson statistic, and how does one interpret its values?
It measures the autocorrelated errors.
Goes from 0 to 4, below is a sign of positive autocorrelation, above is a sign of negative.
d<1 is generally a warning of a positive autocorrelation.
Usually there are lower and upper bounds set where that the statistic must be under or over to exhibit autocorrelation.
What is the difference between autocorrelation and partial autocorrelation?
PACF at lag k is the direct link between Xt and Xt−k, removing influences of lags 1 through k−1.
ACF at lag k is the overall link between Xt and Xt−k, including everything that flows through shorter lags.
What is the Correlation between Yt and Yt-j given AR(1) model?
corr(Yt, Yt-j) = B1j
How do you detemine what forecasting model is the most accurate?
The model with the lowest (R) MSFE ((Root) Mean Squared Forecasting Error) is generally the best forecasting model.
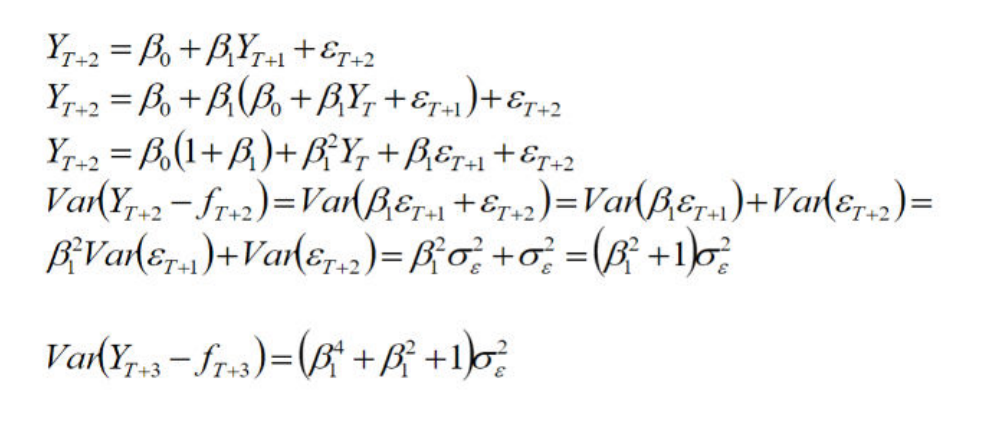
What happens to the variance when you make predictions further and further in the future?
The variance increases. In the first model, the variance is simply sigma², while later on it becomes larger.
How does using the pseudo-out-of-data method work?
Taking part of the data and reserving it for further analysis. Then you use the first part of the data to create a model, which you test with the rest of the data to see if it makes accurate predictions.
Assume you want to make a scatterplot of the mean of shotinit for each flu_season. What command(s) could you use?
egen mshotinit=mean(shotinit), by(flu_season)
scatter mshotinit flu_season
What is the purpose of a Moving Average model?
To see how a temporary shock affects the forecast model. It is essentially a model where the shock is remembered for a few periods, but then it dies out.
“A moving‑average model says every data point is the sum of today’s news and a short, fading memory of yesterday’s and earlier news—nothing more, nothing less.”
What are the characteristics of a GARCH model?
It lets one evaluate the changes in the variance separate from changes in the mean. It does this by letting the variance move up and down in response to recent shocks, while the mean stays calm/is modelled separately.
GARCH lets the spread of tomorrow’s forecast error grow or shrink depending on how wild things have been recently, mirroring the “quiet‑then‑stormy” character of real‑world economic and financial data.
What does the Dickey-Fuller test measure?
The Dickey‑Fuller test is your go‑/no‑go check on whether a time‑series naturally drifts forever (unit root) or eventually snaps back toward a typical level (stationary).
The key number is the t‑statistic (and p‑value) on the lagged‑level coefficient γ; a significant negative γ means mean reversion, an insignificant one means you’re dealing with a random walk.
What is the spurious regression problem?
A spurious (fake) regression is what you get when you run an ordinary OLS regression on two (or more) non‑stationary series that in reality have no economic connection at all.
Because each series drifts over time (has a stochastic trend), they can look strongly correlated even though their underlying shocks are independent.
Spotting this can be seen through an extremely low Durbin-Watson statistic, alluding to a massive positive autocorrelation, a very high R², and a small standard error for Beta^.
At time lags t + 1 and onwards, what happens to the error term?
It is assumed to be zero, as we cannot predict the error term. Variance is still accumulated in the forecast variance.
What is the Chow test?
A test testing for is there is a structural break in the data, when the estimated time of the structural break is known.
What does the Quandt-Andrews test do?
It tests the break date when the break date is unknown.
Can you trust the p-value of the Chow test when using a break date you have founr from looking at or analyzing the data?
You cannot, as once the data have been mined to find the “best” break, a conventional Chow test at that very date no longer has the advertised χ²/F distribution. Its p‑value is therefore not valid for inference.
What does the i.(variable) do in stata?
Stata treats this variable as an indicator or categorical variable. Stata will then create on the fly the necessary dummy variables for you, so that you don't need create these dummy variables yourself.
It is used when you want to regress a categorical variable.
How to convert logit outputs to probability?
p=1/(1+e−η)
What happens in the long-run equilibrium of a regression?
Changes = 0
What are the Null and alternative hypothesis of an ADF (Augmented Dickey-fuller test?)
Null: The series is a random walk or drift.
Alternative: The series is stationary.
What is the OLS slope in terms of standard deviations?
sX1Y/s2X1