Everything up until Card 12 is for Quiz 2. Remember... be cool..... stay in school....
Explain what temperature-dependent sex determination and pivotal temperature are in sea turtles and how warming affects turtle reproduction
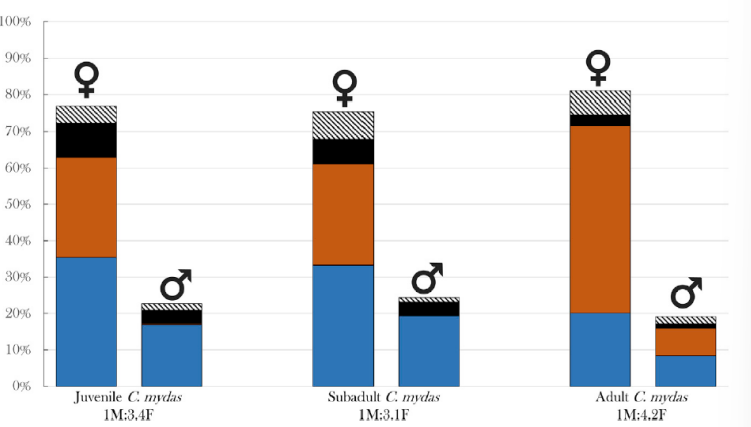
Sea turtles exhibit temperature-dependent sex determination (TSD)
Croccies, alligators, iguanas and other reptiles
The sex of a sea turtle is determined by the heat of sand incubating their eggs
Each species has a PIVOTAL temperature (not same as critical max/min temperature or optimal temperature)
Threshold temperature around which the COOLER it is (the higher chance it is that the individual develops as a MALE, the WARMER it is the higher chance it is a FEMALE)
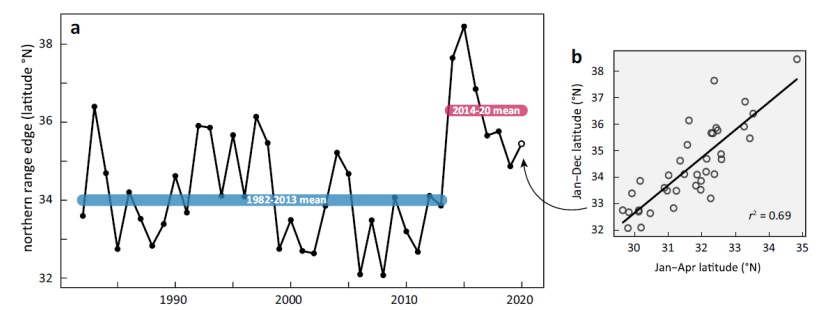
Environmental Warming and Feminization of One of the Largest Sea Turtle Populations in the World
You can’t tell if sea turtles are male or female until after they are developed as adults.
You need INVASIVE procedures to see if immature turtles are male or female
This is difficult for research because we want to know breeding patterns and establish a link
Sea turtle sex cannot be determined externally until they mature as adults; invasive LAPAROSCOPY is necessary to determine sex in juveniles
Laparoscopy: a surgical procedure used to examine the organs in the belly (abdomen)
Another problem is that the distance from location of capture of adults could be pretty far from their original nesting sites
To circumvent this
JENSEN ET AL ended up CREATING GENETIC TECHNIQUES to make correlation, captured some juveniles at nesting sites and then COMPARED their DNA to that of adults to DETERINE their SEX
They also developed a way to determine sex based on HORMONE levels
Annual variation in sand temperature over last 55 years has had POSITIVE trend meaning that INCREASED FEMINIZATION of sea turtles is taking place due to increasing temperatures (GRAPH 1)
Whether it be in juveniles, subadults, or adults
Define fundamental/realized niches and niche filling, and consider the implications of climate change on them for a species
Compare/contrast terrestrial and marine niche filling (overfilling and underfilling)
"As temperatures change, an organism's realized niche may shift BEYOND its thermal limits, forcing it to seek new suitable habitats (realized niches) or face population decline."
Niche
The combination of abiotic and biotic factors along with a species’ interactions with its environment that determine where it can live
Fundamental Niche
The nice a species would occupy in the ABSENCE of interspecific interactions (e.g. competition or predation)
Realized Niche
The ACTUAL niche that a species occupies in the real world IN LIGHT OF of interspecific interactions in the real world among organisms of other species in their ecological community
Niche Filling
The DEGREE to which a species occupies its fundamental niche in the wild
****************************************************************************
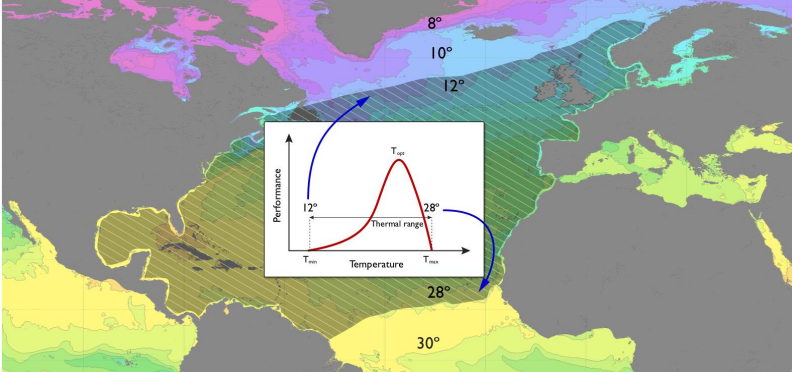
Species Range Filling of Thermal Limits (GRAPH 1)
The shaded area between a North Atlantic fish species’ upper (28 C) and lower (12 C) thermal limits as indicated by the thermal response curve.
ARROWS indicate that the upper and lower thermal limits of the species correspond closely to the mean annual water temperatures found at its geographic range limits.
This species is fully filling its thermal niche with very little underfill or overfill.
Winter minimum and summer maximum (rather than mean) temperatures probably set its actual GEOGRAPHIC range.
****************************************************************************
Thermal Limit
The highest/lowest temperature a species can tolerate before it can no longer SURVIVE or function properly
Geographic Limit
The FURTHEST area where a species is found, based on environmental conditions, resource availability, and other ecological factors
Defines the EDGE of a species’ natural range
Warm and Cold Boundaries
Temperature EXTREMES at the edges of a species’ geographic range
Warm boundary: HOTTEST area where a species is found, near its upper thermal limit
Cold boundary: Coldest area where a species is found, near its lower thermal limit
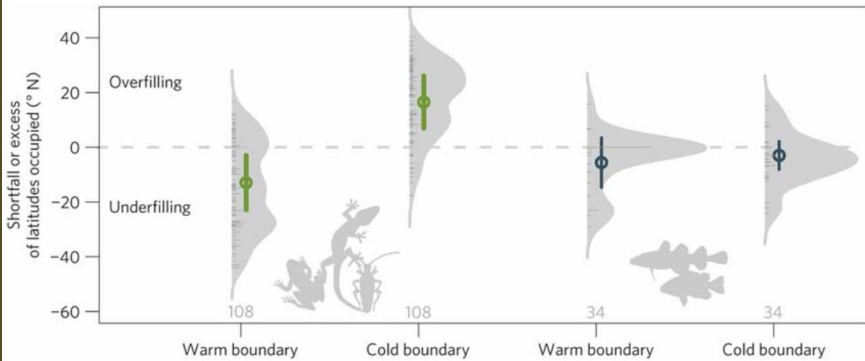
Niche-Filling in Marine and Terrestrial Ectotherms (GRAPH 2)
GRAY shading represents abundance of species near their thermal limit.
Marine species closely fill their niche (right, CLOSE TO ZERO), with most species falling either at or near their thermal limit.
Underfilling (vertical axis) occurs when species have a geographic limit at a temperature well BELOW their measured thermal limit.
ACTUALLY FOUND (Geographic limit) BEFORE WHERE THEY CAN POTENTIALLY SURVIVE (thermal limit): UNDERFILLING
My underwear is WARM
UNDERFILLING occurs mostly at WARM boundaries of terrestrial species as it indicates that the species is ABSENT from hotter areas even though they COULD tolerate them
Usually due to competition, resource limitations, or ecological constraints.
As such, the species’ geographic limit is in a COOLER area than its thermal limit
EXAMPLE: The American Pika living in the mountains despite being able to survive in warmth
Pikas have a high thermal tolerance, meaning they CAN SURVIVE in warmer temperatures than where they are actually found.
Despite this, they are mostly RESTRICTED to cooler, high-altitude mountainous regions, likely due to factors such as competition, habitat preference, or physiological stress from sustained heat exposure.
Even though pikas COULD , in theory, survive in warmer, lower-altitude regions, they are absent from these areas, making them an example of underfilling at their southern (warm) range boundary.
Overfilling (vertical axis), when a species geographic range EXCEEDS its measured thermal tolerance, is seen mostly in TERRESTRIAL species at their cold boundary.
A species’ geographic limit is found in places COLDER than their measured thermal tolerance, likely due to WARM SPOTS (otherwise known as microclimates which are warmer than average temperature)
Overfilling is the reverse of underfilling and occurs at the COLD boundary, where species are found BEYOND their expected THERMAL LIMIT due to factors like microclimates (warm spots) that provide local refuge.
A species’ geographic range extends into colder areas where the average temperature is below its measured THERMAL tolerance.
EXAMPLE: The Red fox (Vulpes vulpes) living BEYOND at its northern range geogrpahic boundary in Arctic regions (MUCH COLDER)
The red fox is found in areas colder than its measured thermal limits.
How? This is likely due to microclimates (warm spots) such as sheltered environments, burrows, or areas with higher solar radiation that provide localized warmth, allowing the species to persist beyond its expected thermal limits.
Describe the fundamental response of populations to climate change and define the Allee effect:
Describe the significance of the impact of changing climate on insect by latitude, and where they will be most heavily/least affected and why:
What are novel and disappearing climates? Where on the earth are new climates forming and old ones disappearing most prominently?
Fundamental Response of Populations to Climate Change
A population of a species in a given location, experiencing climate change, can respond in one or more of the following ways (AMD)
Adapt
Move
DIE
Allee Effects
Factors that cause population DECLINE when a given population is SMALL in size
****************************************************************************
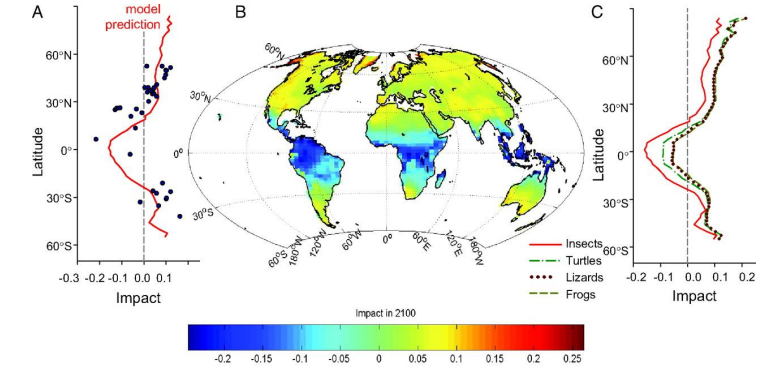
Insect Response Curves and Tropical Density (GRAPH 1)
Distribution of predicted impact in ectotherms by LATITUDE.
High impacts, strongest decline in performance occur in the TROPICS, where ectotherms include insects, which make up most species on Earth.
Performance actually most often INCREASES in temperate areas, as warming removes cold-boundary thermal limits or moves species UP their thermal performance curve
Impact in 2100 for insects (by latitude) estimated by thermal response curves fit to models of population growth.
DECREASE in pop NEAR EQUATOR (too warm)
INCREASING TOWARDS POLES AS MOVE UP THERMAL PERFORMANCE CURVE (get closer to Topt)
****************************************************************************
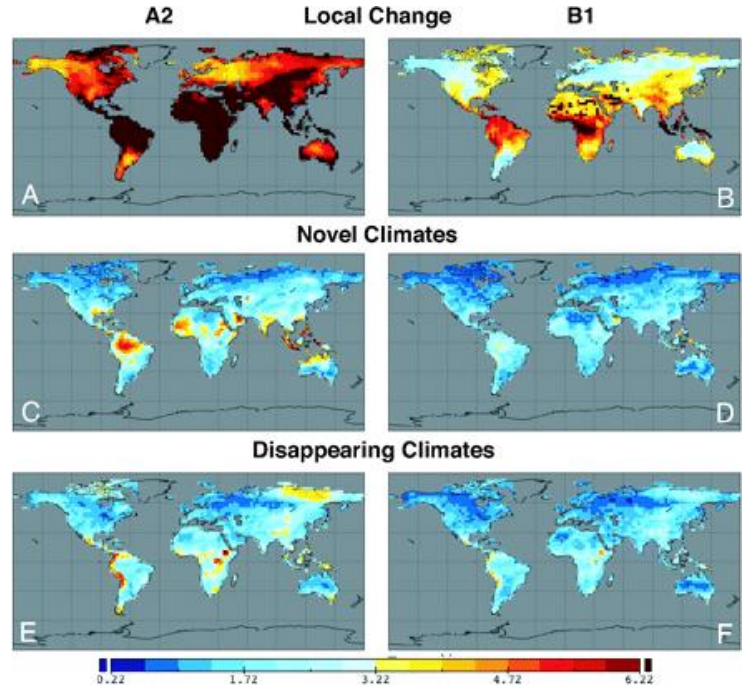
Novel Climates
New climates that emerge that do not have analogs in current climate (middle row).
Disappearing Climates
Are current climates that are not represented in future climate (furthest towards poles)
Novel and Disappearing Climates (GRAPH 2)
Novel and disappearing climates are shown under HIGH (left) and LOW (right) climate change scenarios.
Local multivariate change is shown for comparison (top row).
Red is HIGH local change, most novel and greatest multivariate distance from current in disappearing climates.
Towards EQUATOR you are getting higher rate of NOVEL climates
It is already very hot there, so the hotter things get the more you get NEW climates never been seen before type shi
Towards POLES you are getting higher rate of DISAPPEARING climates
The polar regions are warming much faster than the rest of the planet (polar amplification), causing previous cold climates to VANISH.
As glaciers MELT, sea ice disappears, and ecosystems shift, many cold-adapted climates and habitats are lost because they have nowhere further to move.
Coldest far up by the poles are disappearing
Cold-ish are becoming warm in the way historically climates closer to the equator usually are.
NOT novel because there are climates closer to the equator which are around the same
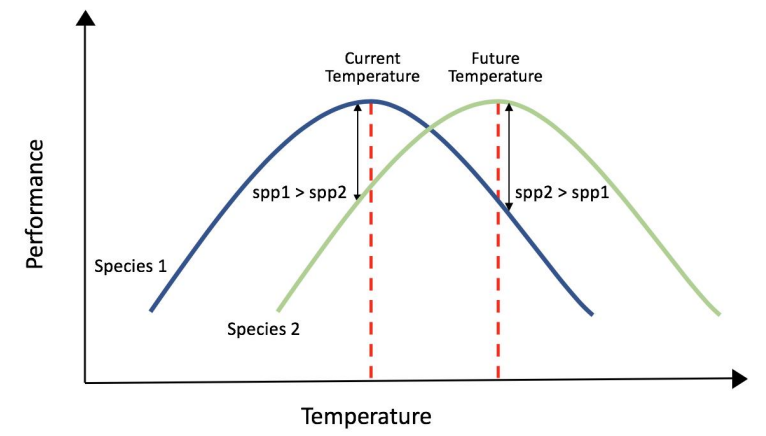
Describe the relationship between population growth and thermal performance curves:
How can warming reverse the competitive advantage between species?
Population Growth Response to Temperature Follows Thermal Performance
Thermal performance of individuals translates into FASTER population growth.
The population growth curves shown here are SIMILAR in shape to thermal performance curves of individual organisms for this reason.
Just as thermal response of biochemical reactions molds the shape of tissue and organismal thermal response curves, organismal thermal response curves can mold the shape of population growth curves.
“If a population does well at a certain temperature, that population will also GROW faster at that temperature.”
Simple enough
****************************************************************************
Reversal in Competitive Advantage between Species due to Warming (GRAPH 1)
At CURRENT temperatures at this particular site, Species 1 is near its thermal optimum and has higher performance than Species 2.
Thus Species 1 can CURRENTLY outcompete Species 2 in CURRENT climate at the site.
But as climate WARMS, Species 2 moves up its thermal performance curve while Species 1 moves PAST its thermal optimum into a zone of declining performance.
In FUTURE climate Species 2 outcompetes Species 1 - the competitive advantage of the two species has been reversed.
Describe basic patterns of species range shift and how it may differ between some species:
Different types of animals will respond differently to warming and climate changes
Their ability to move varies between organisms (birds and fish migrate easily)
However, with animals like mollusks and mammals it is not as significant of decreases
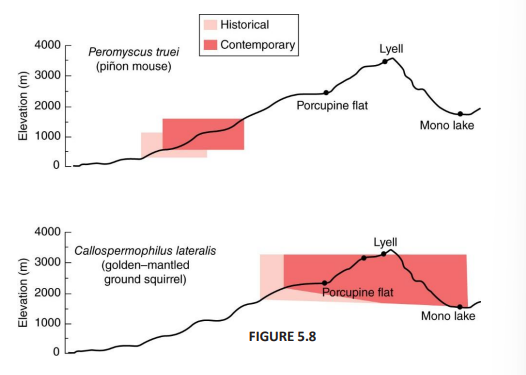
Many species ranges are shifting TOWARD THE POLES and UP IN ALTITUDE in response to global warming (GRAPH 1)
We are going to expect animals shifting UP in elevation in response to global warming
We have some examples of this happening
Pinon mouse is historically found a bit lower but now we’re starting to see them go up HIGHER
Golden-mantled ground squirrel, since they are ALREADY very high up they do not have as much of a range to shift up to (eventually running out of space) might eventually lead to pretty significant effects like population decline
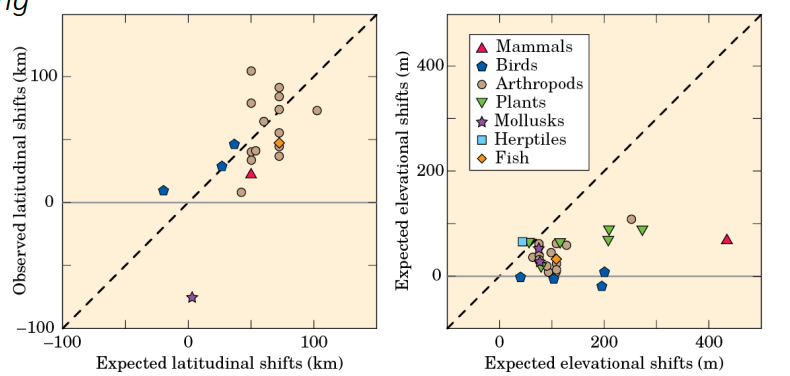
A wide variety of species show range shifts that correlate with recent warming (GRAPH 2)
Insects in particular follow migration patterns UP (in terms of LATITUDINAL SHIFT) but MOLLUSKS are decreasing in direction.
Mollusks lowkey just tryna be different, cringe
If some animals are going up and others are staying put or going down this might DISRUPT predator-prey interactions resulting in there having to be changes in diet and lifestyle
ADAPT OR DIE
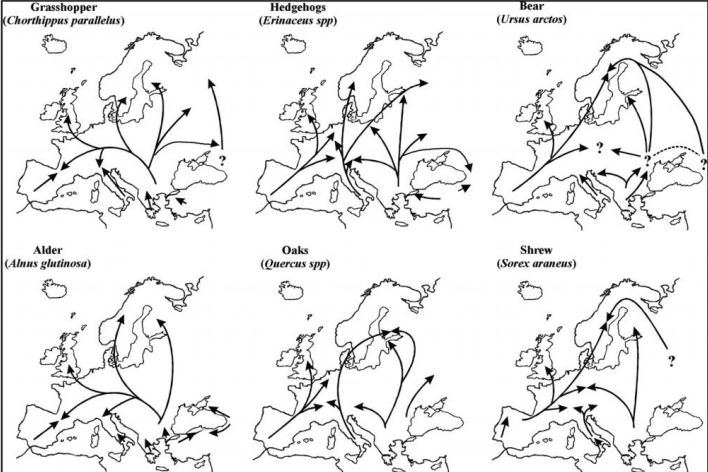
Describe the spread of species in the warming from the Last Glacial Maximum:
Characterize the spatial patterns of genetic diversity as a species’ geographic range shifts in response to environmental change
Spread of Species in the Warming from the Last Glacial Maximum (GRAPH 1)
Different species move in different ways
Different species have different dispersal RATES
Birds/fish: Quickly | Oak trees: Slowly
Refugial Centers
Areas where species persist during unfavorable climate conditions such as ice ages or extreme warming periods, and from which can later recolonize surrounding areas when conditions improve
Kinda like SAFE ZONES that protect species from extinction during climate change
Genetic Suture Zones
Genetic suture zones are regions where genetically DISTINCT populations of a species meet and INTERBREED after having been separated in different refugia during past climatic events
THREE PATTERNS dominate spread from refugial centers in Southern Europe
These are characterized by the grasshopper, the hedgehog and the bear (top row).
The grasshopper has genetic suture zones in the Pyrenees and Alps.
Suture zones for the hedgehog are in Central Europe and for the bear in Scandinavia.
The BOTTOM row illustrates that other species group into these same patterns, for instance the genetic patterns of alder are similar to the grasshopper, oak is similar to hedgehog, and shrew similar to bear.
Life history and climatic tolerance similarities may drive these parallels.
****************************************************************************
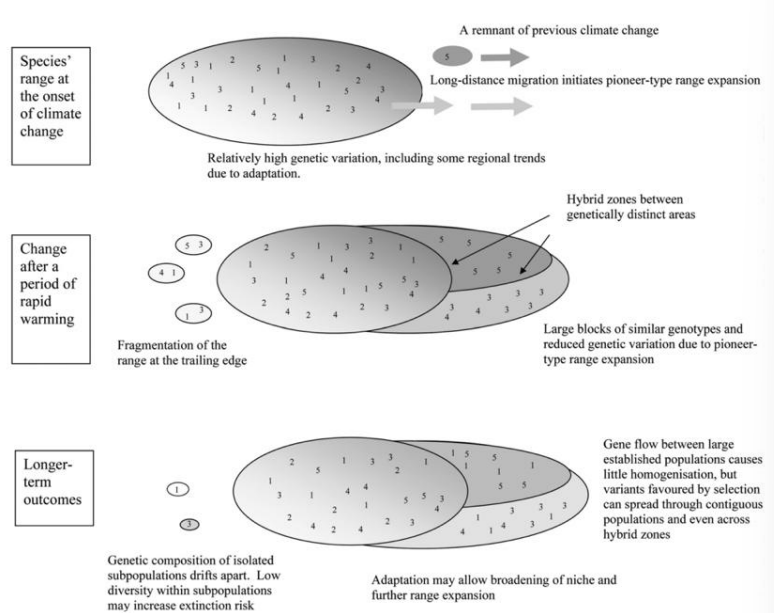
Genetic Signatures of Leading and Trailing Edges (GRAPH 2)
At The Onset of Climate Change (TOP)
Climate change causes movement in a species’ range
Relatively high genetic variation, including some regional trends due to adaptation
Long-distance migration initiates PIONEER-type range expansion
Remnant of previous climate change also moves forward a little bit
Change After Period of Rapid Warming (MIDDLE)
With fragmentation of the range at the trailing edge and expansion at the leading edge forming HYBRID ZONES between genetically distinct areas
At tail end, or trailing end of genetic range you have “fragmentation”/isolation from main range; pockets of former population that stay behind.
Ultimately resulting in large blocks of similar genotypes and reduced genetic variation due to pioneer-type range expansion
Long-Term Outcomes (BOTTOM)
Eventually, trailing edge fragments disappear and genotypes at the leading edge mix.
Fragmentations of trailing edge begin to isolate and drift apart.
Low diversity within these subpopulations increases EXTINCTION risk.
Adaptation may allow BROADENING of niche and further range expansion
Gene flow between large established populations causes LITTLE homogenization, but variants FAVORED by SELECTION can spread through populations and even across hybrid zones
Overall Takeaways
5 different genotypes are illustrated, each number represents a gene pool (1, 2, 3, 4, 5)
Each big circle is a species “RANGE”
The genetic make up within a species range is NOT homogenous (there is diversity)
What leads to some of these population declines
Genetic LOSS occurs at the LEADING EDGE as a few genotypes colonize newly suitable climate, begin to HOMOGENIZE.
Genetic RETENTION is greater in the trailing edge, but is gradually eroded by fragmentation and declining climatic suitability
As species expand towards right (a remnant of previous climate change; long distance migration)
Eventually as the population begins to catch up with the lead population you’ll see more intermixing, populational diversity, and the fragmented left-behinders will probably decrease in number/die out
Back to how it was before climate change induced range shift
In ocean the migration/range-expansion is much more CLEAN, on land you have pockets which are SEPARATED from main group
Describe what heat waves are along with their severity:
Describe the location and cause of the “Blob” of 2015, and how it had far-reaching impacts on marine life along the west coast of N. America:
Heat Waves
A heat wave is an extended period of abnormally HIGH temperatures that exceeds historical climate norms for a given region, significantly impacting ecosystems, biodiversity, and ecological processes.
We will experience more frequent, more severe heat waves in the future due to warming (IPCC, high confidence)
This puts certain human groups and many animal & plant populations at risk
Effects in the ocean are particularly complex during marine heat waves (MHW)
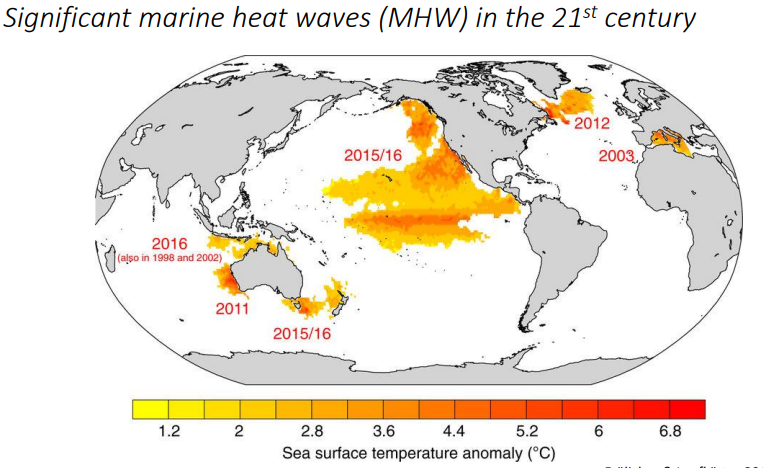
There have been significant marine heat waves (MHW) in the 21st century (GRAPH 1)
Especially in the Pacific Ocean in 2015/16 known as “Ze Blob” where it affected the coast of Alaska down across the US & Mexican coast eventually reaching near the equator
This featured an increase of roughly 3-5 degrees Celsius of sea surface temperature
In 2003 in the Mediterranean Sea
In 2011 off the coast of Australia
In 2012 off the coast of Canada and Greenland
In 2015/16 off of Australia and New Zealand
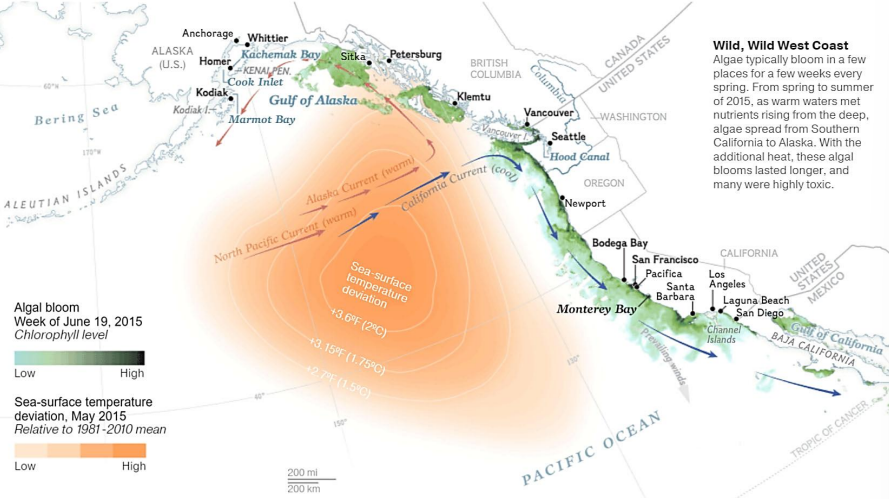
WHAT IS ZE BLOB OF 2015? (GRAPH 2) AKA “2014-16 NORTH PACIFIC MARINE HEATWAVE”
Starting in late 2013, a (Dr. Stephen) Strange patch of warm water formed in the Gulf of Alaska
Caused by an atmospheric high-pressure system (nicknamed the “Ridiculously Resilient Ridge”), that PREVENTED winds from blowing over the ocean at that spot and caused heat to BUILD UP
Sea temps PEAKED at almost 6°C above average
MAX AREA: warm water covered about 3.5 million square miles in the Pacific, stretching from Mexico to Alaska
Algal Bloom Type Beat
Algae typically bloom in a few places for a few weeks every spring.
From Spring-to-Summer of 2015, as warm waters met nutrients rising from the deep, algae spread from Southern California-to-ALASKA
With the additional heat, these algal blooms were able to last longer near Alaska where they would typically be unable to survive
Many of these longer-lasting algal blooms were HIGHLY TOXIC
How was Ze Blob Sustained?
The Alaska Current, which moves NORTHWARD along the Pacific coast, WARMED as it transported heat from Ze Blob into higher latitudes.
Northward, carrying warmer water from Ze Blob to Alaska
Meanwhile, the California Current, a SOUTHWARD-flowing COLD-water current, experienced enhanced upwelling (bringing deep, cold water to the surface), KEEPING it relatively COOLER despite regional warming.
Southward, carrying colder water got even colder due to increased upwelling
South water prevented from warming by California Current
The Blob (a marine heatwave in the North Pacific from 2013–2016), the North Pacific Current split into:
The warm Alaska Current – which transported warmer-than-usual water northward toward Alaska.
The cold California Current – which typically brings cool, nutrient-rich water southward along the U.S. West Coast but was weakened and displaced offshore during The Blob.
Why Did This Happen?
The Blob created a large HIGH PRESSURE (Ridiculously Resilient Ridge) system, reducing storm activity and weakening ocean mixing.
This led to WARMER , stagnant surface waters in the North Pacific, disrupting normal circulation patterns.
As a result, warmer waters intensified the Alaska Current, while the California Current WEAKENED (typically bringing cold down), allowing warm waters to persist along the U.S. West Coast, contributing to marine ecosystem disruptions
Warmer Deep Water
Heat extended to ocean depths of 1300 feet in some places
A temperature rise of EVEN A SINGLE DEGREE can disrupt an ecosystem
Heat remains DEEP in the ocean, even though the surface cooled slightly in late 2015.
A Refuge From the Heat
As waters warmed, wildlife moved from the warming Pacific Ocean INTO Monterey Bay inside of Northern California to feed in cool, nutrient-rich water rising from the deep canyon
In 2015, high concentrations of toxic algae lasted LONGER THAN USUAL harming animals and making some shellfish UNSAFE TO EAT
Sustained toxic bloom in 2015 in Monterey Bay
MARINE ORGANISMS SHIFTING
“Market Squid” are usually off coast of Cali/Mexico, but as ocean temperatures warm, they have pushed into Alaska where conditions are becoming more suitable for them (also warm)
Go north for extra warm, OVERFILLING
Expanding geographic range
A variety of marine organisms washed ashore in large numbers such as the Portuguese Man-of-War
Some are already DEAD
Or they are weakened, end up getting too close to shore, and then end up getting washed onto shore in a weakened state
SEA OTTERS in Alaska are experiencing large DIE-OFFS due to a combination of factors, including predation by orcas, disease, environmental changes, and food scarcity linked to ecosystem disruptions.
Sea Lions are becoming increasingly EMACIATED near Laguna Beach (by Orange County)
SEA OTTERS (ALASKA) and SEA LIONS (CALI) BOTH GETTING COOKED
Tuna Crabs should be in the middle of the ocean but are beginning to appear near Monterey Bay
Drifting towards shore to cool down, UNDERFILLING
Their previous niche is inadequate for them
From 2015-16, from tens to hundreds mostly of Murre bird deaths along west coast of United States.
Dying in hundreds along West Coast USA
Dying up to the tens of thousands along gulf of Alaska
As you go up, MORE DIE!
The cause of death in all cases was starvation due to food web changes caused by Ze Blob, a pool of unusually hot water linked to climate change.
Summarize some of the research that has observed range shifts in various species (e.g. sharks, krill, insects, etc.):
Juvenile White Sharks are unprecedentedly becoming increasingly sighted in the generally central California (MONTEREY BAY), they typically remain the warmer waters of the Southern California Current
Moving UP into CENTRAL California from So-Cal
Southern California (historic habitat) has become too warm for juvenile white sharks, while central California (which was historically too cool) has warmed to a more suitable temperature, matching what Southern California once was.
Juvenile white sharks are being overwhelmingly spotted compared to adult white sharks because juveniles are affected by warming waters because they have narrower thermal tolerance ranges THAN ADULTS, making them more likely to shift their habitat as temperatures change.
OVERFILLING
They are shifting poleward as the thermally suitable habitat for juvenile white sharks continues to shrink (GRAPH 1)
The cold range edge migrated poleward during the 2013-2016 North Pacific Heatwave (Ze Blob)
Too cold cut off becomes even smaller as cold edge migrates POLEWARDS
Edith’s Checkerspot Butterfly (Euphydryas Editha)
Southern populations of Edith’s Checkerspot Butterfly (ECB) are becoming EXTINCT (shaded squares) more frequently than northern and montane populations
As such, this has resulted in a NORTHWARD and UPSLOPE range shift
Southern ECBs dying moving north and up in a range shift
Shifting Krill in Southern Oceans of Antarctica
Krill abundance is DECREASING in areas bordering Antarctica whereas salp plankton densities are INCREASING
Krill depend on ice algae for summer population growth
WARMING temperatures resulting in DECREASING sea ice due to climate change REDUCES algal density thus DEPRESSING krill populations
Averaging up to and over a twofold decrease
Salps fill in the gap by increasing in their place
Averaging up to and over a twofold increase
These changes have had profound impacts on food webs in the southern oceans.
Krill live on ice algae, ice melts, algae die, krill die, salp plankton takes advantage and fills gap EXPANDING population
Less Competition for Food – Krill and salps both feed on phytoplankton. When krill populations drop due to loss of ice algae, there is less competition for available food, allowing salps to thrive.
Warmer Water Favors Salps – Salps reproduce rapidly and prefer warmer conditions, while krill rely on cold, ice-dependent ecosystems. As climate change reduces sea ice, salps gain an advantage.
Different Feeding Strategies – Krill selectively graze on larger phytoplankton and ice algae, while salps efficiently filter-feed on a wider range of particle sizes, including smaller phytoplankton that krill might not target as much.
Large-Winged Forms experiencing range EXPANSIONS (GRAPH 2)
Insects have longer wings in expanding range margins
The (CBC) Conehead Bush Cricket (a) and (RBC) Roesel’s Bush Cricket (b) have undergone recent EXPANSIONS due to climate change
BLUE circles: Historical range
YELLOW and RED circles: Denoting progressive EXPANSION in these species
In these expanding populations (yellow and red circles), long-winged individuals are more common because longer wings improve dispersal ability, allowing them to travel further and colonize new habitats.
Long-Winged Trait is Advantageous at the Range Margins
Range Margins:
The outer boundaries of a species’ geographic distribution) (c & d), where conditions are changing and new territories are being established.
Flying/jump abilities favorable for enemy lines so you can jump back at any time
For species like crickets with longer wings, it’s advantageous to live at range margins because long wings enable them to disperse more easily and move to new, more favorable habitats if conditions become too harsh (e.g., too warm or dry).
In range margins, where environmental conditions can be more variable or unpredictable, being able to fly away to find better conditions can enhance their survival and reproduction.
Essentially, long wings act as a tool for colonization and escape, helping them adjust to changing climates or other environmental pressures.
Diatom diversity has INCREASED in Arctic Lakes
This is owed to warming during the second half of the 20th century
An increase in diversity in sampled lakes is indicated for the arctic and in more detail for FOUR REGIONS with especially rich records for the insets
FES LQ
Fennoscandia
Ellesmere Island
Svalbard
Labrador & Quebec
Explain how warming and range shifts may affect pathogens and disease spread
Warming may Exacerbate Vector-Borne Diseases & Fungal Pathogens
Higher temperatures SPEED UP development rates and sometimes egg-laying frequency of vectors (arthropods that transmit pathogens (which develop within the vector)
Shorter winters or wider areas of warm weather may INCREASE geographic range of various disease vectors (e.g. mosquitoes and Dengue Fever)
Fungal pathogens may also THRIVE in WARMER climates;
This is a RISK for plants, esp. crops, and also amphibians
Blackflies: River blindness
Mosquitoes: Dengue Fever, Yellow Fever, West Nile Fever, Malaria, and Elephantiasis.
Sandflies: Dum-Dum Fever, Black Fever, and Orient Boils
Ticks: Lyme Disease, Tick-borne Meningoencephalitis
Kissing Bugs: Chagas Disease (American trypanosomiasis)
Tsetse Flies: African Trypanosomiasis (African Sleeping Sickness)
Increasing Range of Dengue Fever Infection Risk via MOSQUITOES (GRAPH 1)
Presently only about 35% of the world population is at risk of contracting Dengue Fever
Future projections raise that number to a whopping 50-60%
Rising global temperatures, altered precipitation patterns, and increased humidity are creating more favorable conditions for mosquito survival and reproduction in areas previously too cold or dry for them to thrive.
Expanding Malaria Zone
Malaria is currently RARE in the highlands of Zimbabwe
Malaria parasites mature up to 10 days more RAPIDLY under projected temperature increases
This allows the disease to persist in formerly inhospitable areas
By 2050, Malaria will spread like crazy across Zimbabwe (orange and red colors denote suitable conditions for Malaria transmission)
Projected Changes in 17 C (Yellow) and 13 C (White) Isotherms that LIMIT the distribution of avian (bird) Malaria under current and +2C WARMING Conditions
(GRAPH 2)
As the climate warms by +2°C, the 17°C and 13°C isotherms (temperature limits/lines on a map for avian malaria) shift upslope, reducing malaria-free zones in high-elevation Hawaiian bird refuges.
Malaria parasite PREVIOULSY could not survive in high-elevation but now can due to cold edge moving poleward
This threatens native forest birds like honeycreepers, as they have nowhere higher to escape from disease-carrying mosquitoes.
The study predicts severe habitat loss for these birds, increasing their risk of extinction.
MAIN IDEA OVERALL: As climate change CONTINUES, species will move polewards and higher up
Explain the physiological mechanism of coral bleaching
Explain the observed impacts on cherry blossom blooms by rising temperatures
Bleached Coral
Corals are the most biodiverse AQUATIC BIOME
Support a vast number of different organisms and fish species.
Coral reefs are actually made up mostly by colonial invertebrate animals
Very useful to millions in developing in countries
El Nino events in 1982-1982 and 1997-1998 (warm pacific jet stream, warms up pacific ocean contributing to WARMER AND DRIER CONDITIONS near Australia/Southeast Asia while Americas will actually becoming WARMER AND WETTER) bleached corals in reefs throughout the world
Bleaching is an increasingly common phenomenon even in non-El Nino years
Mass Coral Bleaching Event in Australia, early 2020
The last 3 MASS BLEACHING EVENTS in Great Barrier Reef (along Australia)
In different years, DIFFERENT REGIONS of the Great Barrier Reef showed different degrees of bleaching
Red spots are where 60% or more of coral have bleached
Mass bleaching events are becoming more common
70% or more of coral are starting to undergo bleaching events at one point or another
2016
Nearly half of the Great Barrier Reef underwent severe bleaching (north to middle)
2017
Primarily central Great Barrier Reef underwent severe bleaching
2020
February’s temperatures were some of the hottest ever recorded
Conversely, most of the bleaching occurred skewed down (towards central and southern Great Barrier Reef)
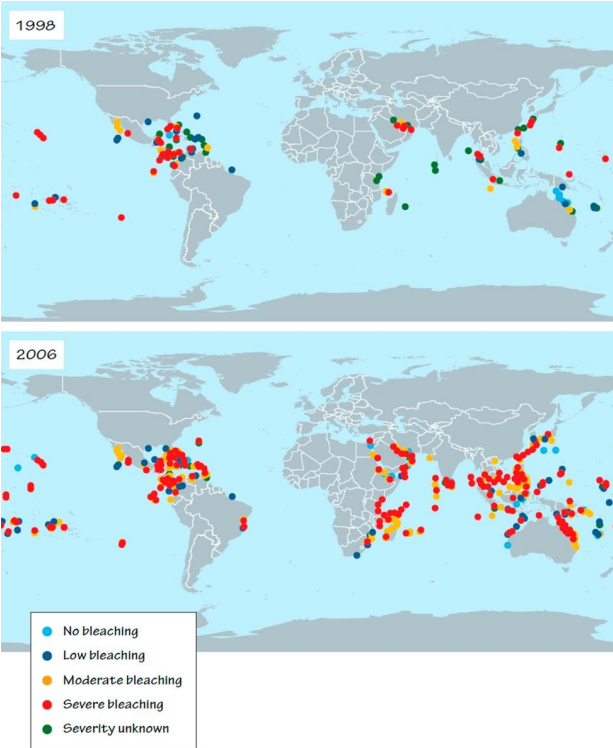
Coral Bleaching Events (GRAPH 1)
As global mean temperature rises, the frequency of events that exceed the BLEACHING threshold INCREASES.
The threshold varies in different regions.
These global maps illustrate the severity of bleaching in the 1998 El Niño, which was the FIRST MAJOR GLOBAL BLEACHING EVENT, and recorded bleaching in 2006.
Every major coral reef region in the world has now suffered moderate to severe bleaching events.
Temperature increasing does not guarantee all reefs in area will bleach, there is a variability in response
Facts on Coral and Coral Bleaching
Coral can be seen from space
Reefs are made of individual coral colonies, that coral is made up of a whole series of small polyps (it is a colonial organism), each polyp is genetically identical in a coral and can reproduce, eat, and function as living organism
Chloroplasts in symbiotic algae (zooxanthellae) are damaged during bleaching, affecting their thylakoid membranes, which normally capture light energy and convert it into chemical energy.
Excess HEAT and light stress overwhelm the photosystems in the thylakoid membranes, causing damage faster than they can be repaired.
The excess energy GENERATES reactive oxygen species (ROS), which harm both the algae and the coral host.
As a defense mechanism, the coral expels the symbiotic algae, leading to the whitening (bleaching) of the coral.
Since the symbionts provide 70-80% of the coral’s energy, their loss prevents coral from building its skeleton, ultimately leading to starvation and death if conditions do not improve.
You’re NOTHING without me, kick me out and you starve! - Symbiont/Symbiotic Algae to Coral
****************************************************************************
Cherry Blossoms in Japan: A Sign of Spring
Cherry blossoms in Japan symbolize the arrival of spring.
Their blooming is highly significant, with forecasts predicting the best viewing spots.
The timing of peak bloom is tracked based on altitude, weather, and temperature, with popular parks being prime locations for appreciation.
Used to be that in 2018 blooming dates in Northern Japan would extend into middle of May, now (2025) is late April MAX
In general, BLOOMING dates nationwide are becoming increasingly SOONER than they once were primarily in late March-Late April instead of Late March-Mid May
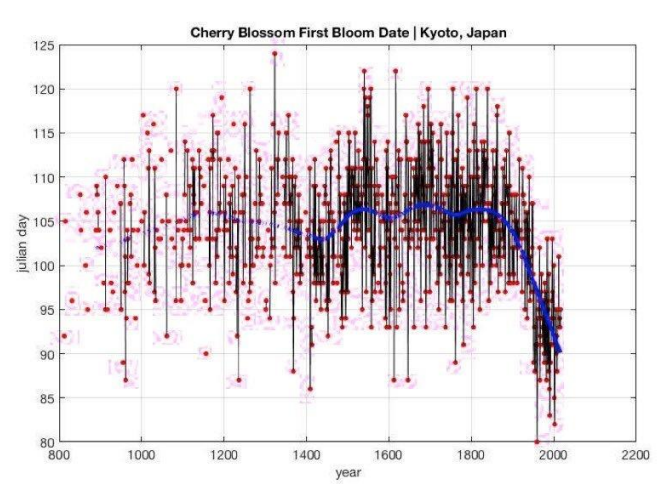
Cherry Blossom Bloom Historical Records Date Back to 800s (GRAPH 2)
Flowering dates have been collected by researchers recorded on diaries and chronicles written by emperors, aristocrats, governors, and monks dating back to the 9th century
It is the longest known such data set in the world
A 1200-year record of cherry blossoms show our current climate is historically unprecedented
First bloom date of cherry blossoms in Kyoto, Japan has been getting as much as TWO WEEKS EARLIER over the past few decades compared to the last 1200 years
The date used to be pretty stagnant around Julian Day 105, took a nose dive upon the turn of the 20th century, now is 15 (BENZEMAAAAAAAAAAAAAAAA) days sooner than it was for most of recorded history
1900 compared to 2020 (GRAPH 2)
Even in Washington DC, used to bloom early April now bloom in late March
Kyoto: used to bloom mid April now early April
IN FLOWERING TREES, HEAT BREAKS WINTER DORMANCY: GETTING WARMER SOONER: FLOWERS SOONER
Early blooms can be disrupted/stopped by winter storms
Define phenology, lower developmental threshold, and growing degree days.
Explain how plants and animals’ development is linked to temperature
Characterize the broad impact of recent warming on phenology
What is PHENOLOGY
The TIMING of regular/seasonal life events in plants and animals
Refers to seasonal biological events such as FLOWERING, bud burst (the emergence of new leaves and blossoms, as seen in cherry trees), bird migrations, animal mating seasons (timed to optimal conditions), and the duration of the plant growing season.
Warming shifts the phenology of some species
Climate change can cause “MISMATCH in phenology” where for example flowers bloom (sooner as heat breaks bud dormancy) and pollinators mature at inappropriate/mismatching times
De-synchronization of phenology between interacting species may cause ecological problems
Lower Development Threshold (LDT)
The temperature below which development STOPS but doesn’t necessarily kill the organism.
Development resumes when temperatures rise again.
Used to predict growth rates, phenology, and life cycle timing (e.g., insect emergence, plant growth).
Some species have genetically determined LDTs and developmental events are triggered once a set value of cumulative degree days is achieved
Thus, developmental speed and phenology (timing) of organisms can be directly affected by changes in temperature
Growing Degree Days
For every 24 hours spent at 1 C ABOVE the LDT, 1 degree day is accrued
A good way to measure accumulated heat over time to predict biological development (when plants will flower or insects mature)
Every species has an LDT, and a GDD is earned for every degree ABOVE the LDT over a 24-hour period
If the LDT is 10 C, and the daily average temp is 15 C
5 GDDs are accumulated for that day
Important metric as development depends on HEAT rather than just calendar days
***************************************************************************
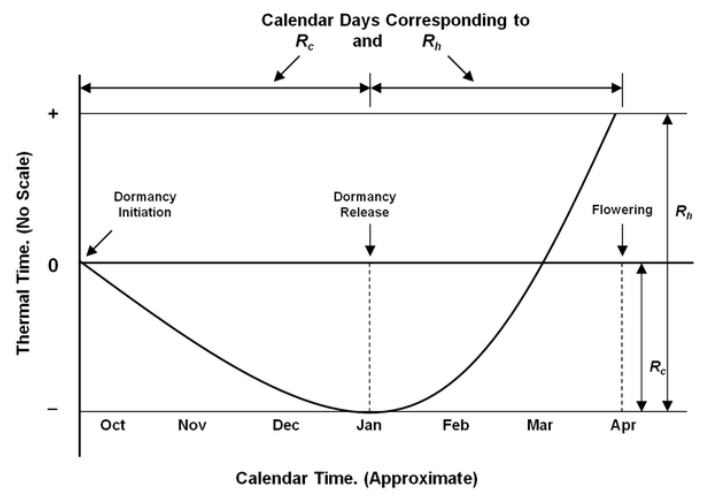
Conceptual Model For Predicting Flowering Date in Temperate Zone Deciduous Trees (GRAPH 1)
Deciduous trees are trees that shed their leaves seasonally, typically in autumn, and grow new ones in spring.
This graph model was used to estimate the PBD (peak bloom dates) of flowering Cherry Trees in DC
Floral buds must be exposed sequentially to long enough periods of chilling temperature (Rc) and heating temperature (Rh) for spring flowering.
Dormancy Initiation in October and cools (Rc) until January where
Dormancy Release takes pace switching from (Rc) to (Rh) and ultimately
FLOWERING around April following the bud-burst
The onset of dormancy in deciduous trees can be approximated by the date at which the temperature falls below a fixed threshold, the date that fruits are harvested from trees, or the date when the leaves begin to fall
Similarly, it has been proposed that floral buds of deciduous trees enter dormancy in the autumn as their leaves begin to fall
According to NPN (National Phenology Network): Earlier Greening Across US
IN 2017: Leafing/Blooming/SIGNS OF SPRING across the US especially from Eastern to Central US are beginning to leave much EARLIER (around 10-15 days earlier) than they used to
That being said in North-West (Nor-Cal, Washington) signs of greening/blooming are LATER than they once were indicating non-uniformity of Climate Change
IN 2022: Stabilized since 2017 but still earlier compared to historical records
The network takes into account a host of factors like pollen levels, tree bud colors, soil temperature, and moisture levels to determine when each area’s green up actually occurred
Phenology of Budburst Advancing Due to Spring Temperature Increase
Both in current conditions (ambient) and warming scenarios (+1.7 or +3.4 C), warmer conditions cause EARLIER BUDBURST
Heat triggers budburst by accumulating enough thermal energy to break bud dormancy, signaling the plant to resume growth.
Warmer temperatures accelerate biochemical processes that degrade dormancy-related hormones while promoting growth hormones, ultimately triggering budburst.
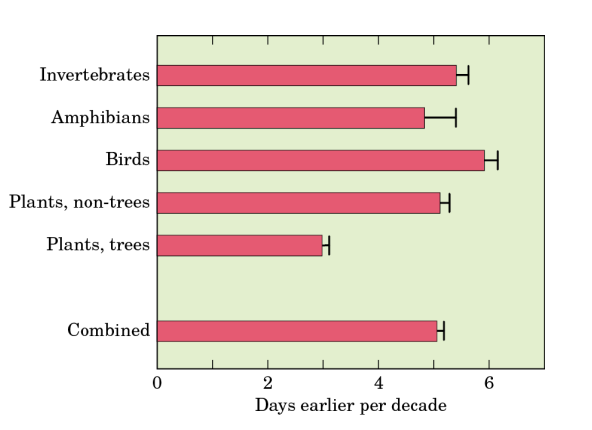
Shift in Animal & Plant Phenology (GRAPH 2)
Shift in spring events (days earlier per decade) such as arrival, flowering, and egg-laying for various groups of species
Depicted are the mean and an error bar indicating the variation in values around the mean of 694 species over the past 50 years
The timing of various biological processes (SPRING EVENTS) have shifted 2.3-5.1 days EARLIER PER DECADE in the spring due to warming
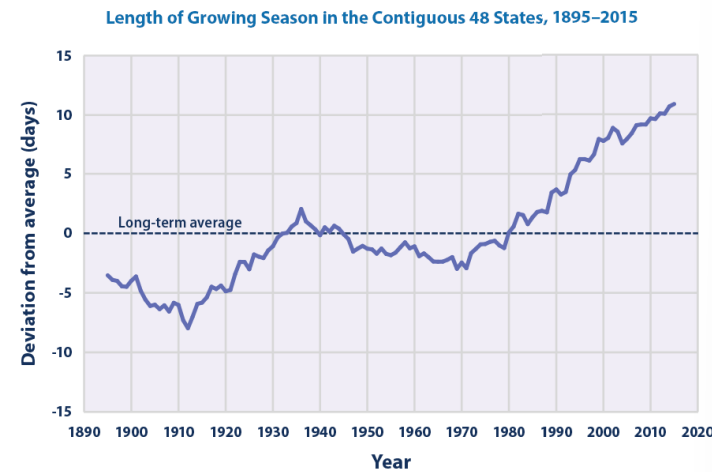
Describe impacts of changing temperature on plant growing season and pollen severity
Plant-Growing Season Becomes LONGER under WARMER climates (GRAPH 1)
WARMER Temps=EARLIER flowering & bud-break
EARLIER Spring/LATERFall=LONGER POTENTIAL GROWING SEASON
This results in INCREASED seasonal amplitude of the Keeling Curve!!
Pollen Season Becomes LONGER Under Warmer Climates
WARMER climate means that PREVIOUSLY cooler areas may experience LONGER growing seasons for pollen-producing plants
This will lengthen the duration of SYMPTOMS for people suffering from hay fever or allergies
WARMER temperatures EXTENDING GROWING SEASON, allowing pollen-producing plants to start flowering EARLIER and CONTINUE later into the year, INCREASING overall POLLEN exposure.
Pollen triggers allergies because the immune system mistakenly identifies pollen proteins as harmful, causing an inflammatory response with histamine release, leading to symptoms like sneezing, congestion, and itchy eyes.