AP Human Geography Models and Theories
1/37
Earn XP
Description and Tags
Flashcards for AP Human Geography Unit 1-7 Models and Theories Review
Name | Mastery | Learn | Test | Matching | Spaced | Call with Kai |
|---|
No analytics yet
Send a link to your students to track their progress
38 Terms
Latitude
Based on the equator; horizontal lines.
Longitude
Based on the prime meridian; vertical lines.
GIS
Used to layer different maps to show patterns in data.
Thematic Maps
Used to show data such as population, ethnicity, temperature, or economic patterns using color, dots, and shapes.
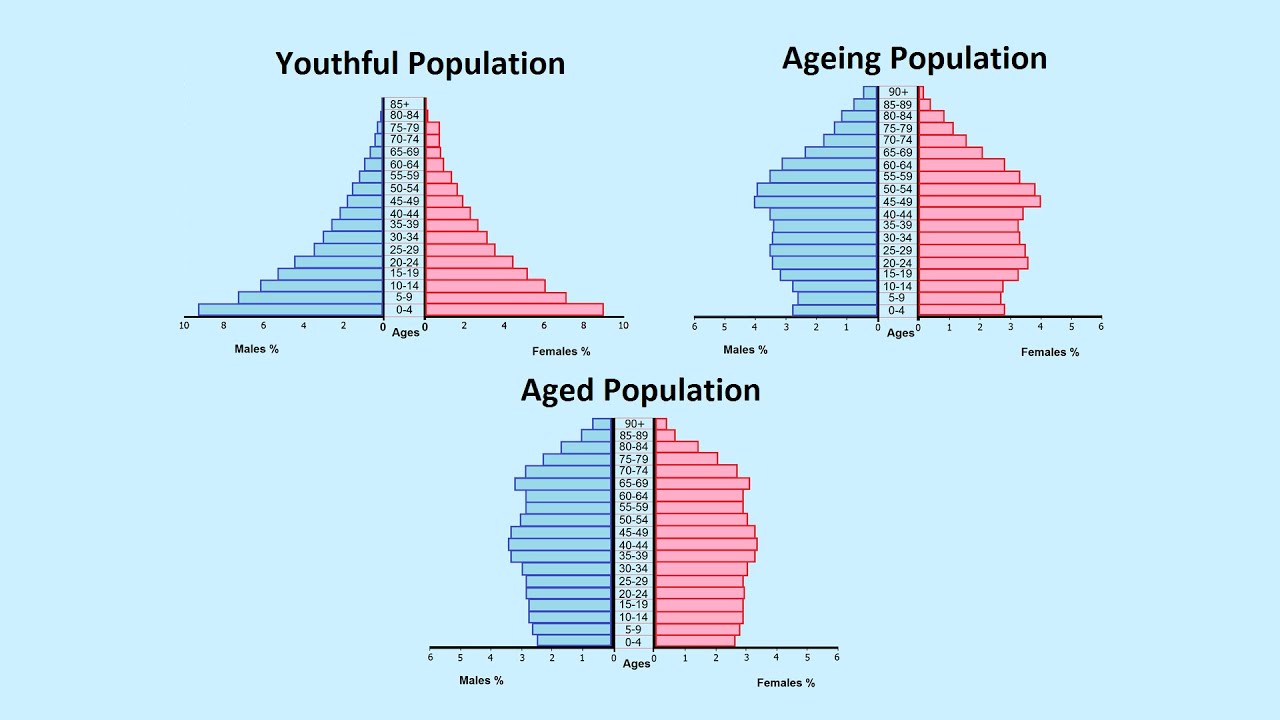
Population Pyramids
Used to show demographic patterns in a population using sex and age.
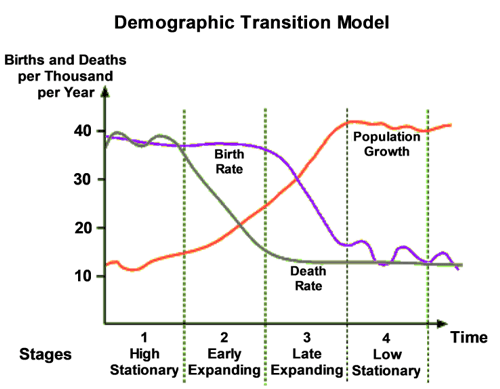
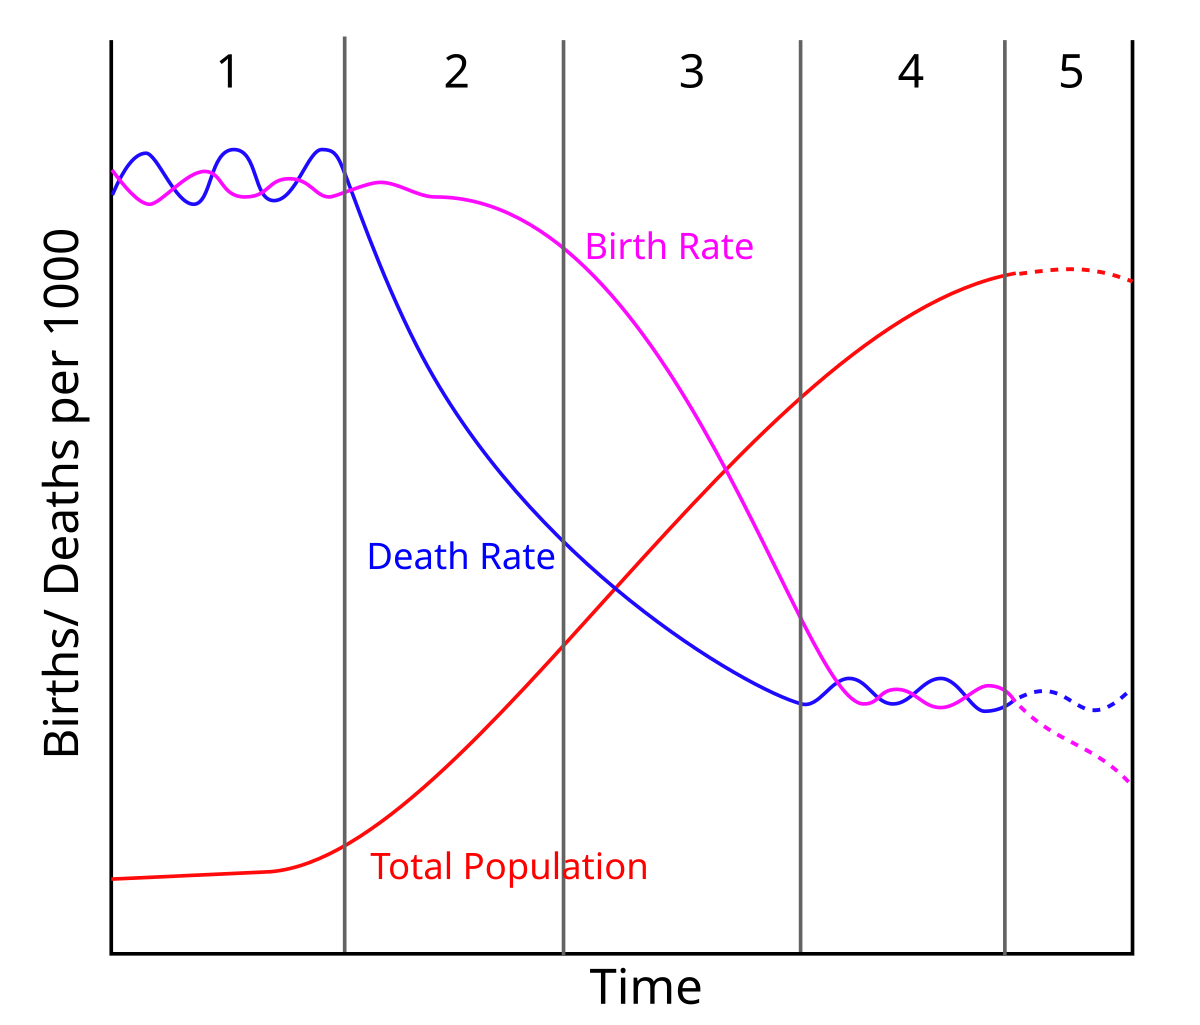
Demographic Transition Model (DTM)
5 stages that all countries go through, categorized by birth/death rates and natural population increase; does not factor in migration. More developed countries = later stages.
Epidemiological Transition Theory
Shows what type of diseases a country is most likely to face depending on its development stage.
Ravenstein’s Laws of Migration
Common patterns that migrants share: Most move a short distance; migration goes by steps; long-distance migrants more likely to move to big cities; all migration flows have a counterflow; people of rural areas are more likely to migrate; men are more likely to migrate long distances while women are more likely to migrate short distances; migrants are mostly adults not families; urban areas mostly grow from in-migration not naturally; migration increases with more transportation and economic opportunities; mostly from rural to urban; economic factors are the main cause of migration.
Zelinsky Model of Migration Transition
Talks about what type of migration is most likely to happen depending on the demographic stage a country is in.
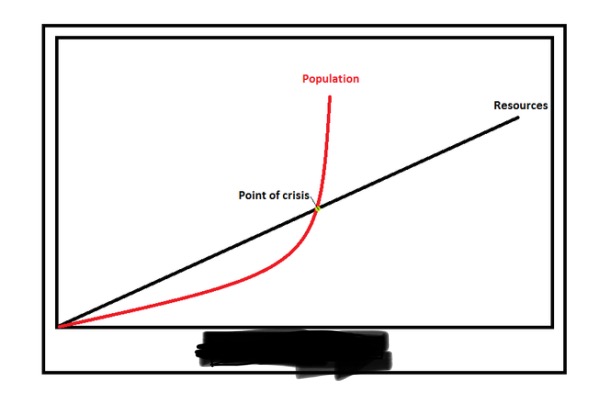
Malthusian Theory of Population Growth
The idea that the world's population grows exponentially while food production grows linearly, leading to 'checks' like famine and war.
S-Curve
Shows the speed at which ideas are adopted: they start picking up slowly, then quickly become popular, then cool off.
Language Tree
A tree of which languages came from which language family. Indo-European is the largest language family.
Organic Theory
The idea that countries are like living organisms that go through birth and death and need nourishment (acquiring less powerful states to survive). Without expansion, the state would die.
Mackinder’s Heartland Theory
The key to achieving global power is to conquer Eastern Europe/Russia.
Spykman’s Rimland Theory
Key to global power would be to conquer the UK, India, and China.
Domino Theory
The idea during the Cold War that if one country 'fell' to Communism, the surrounding countries would also fall like dominoes.
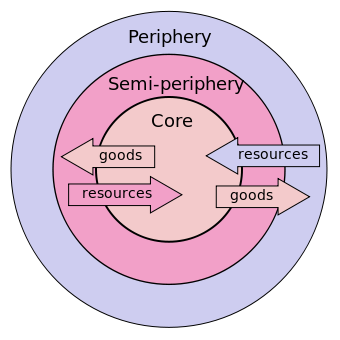
Core-Periphery Model
Describes the relationship between core and periphery countries. The core countries rely on the labor from the periphery countries.
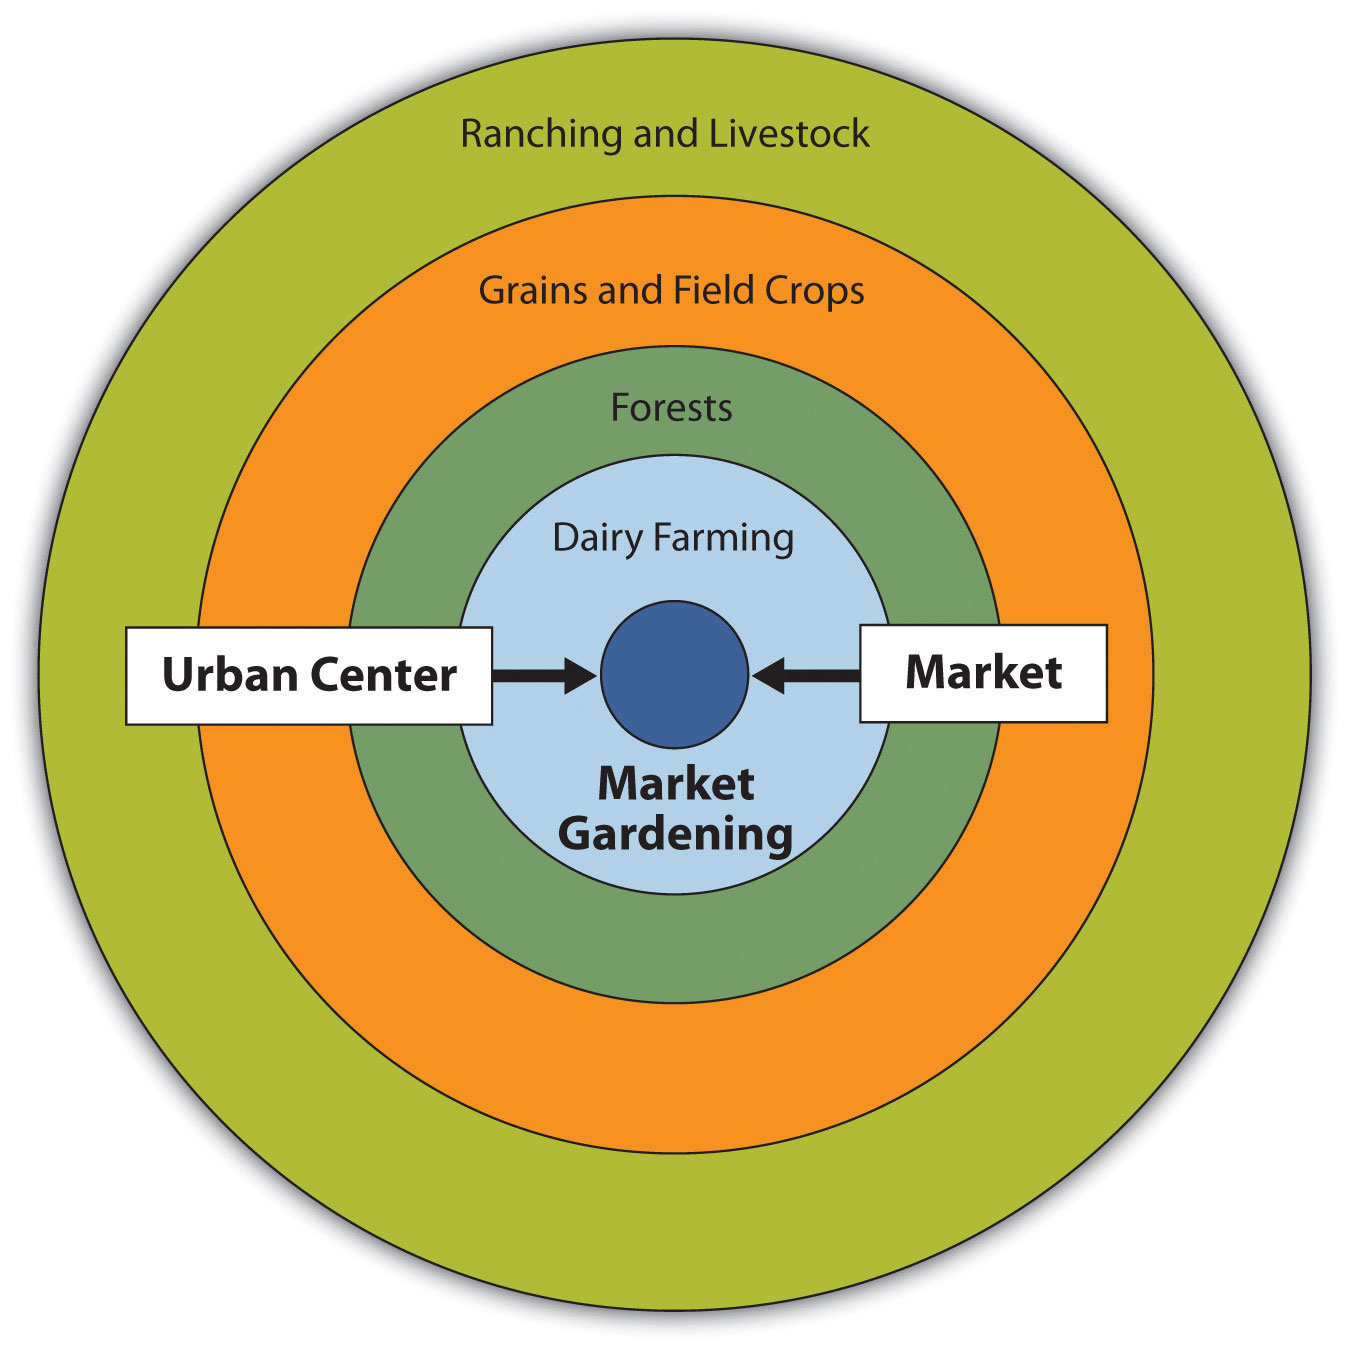
Von Thunen Model
Shows where industries are located in four rings around the city: dairy farming + market gardening, forests, grains + field crops, and ranching and livestock.
Ester Boserup’s Theory
The idea that food production will increase based on population increase.
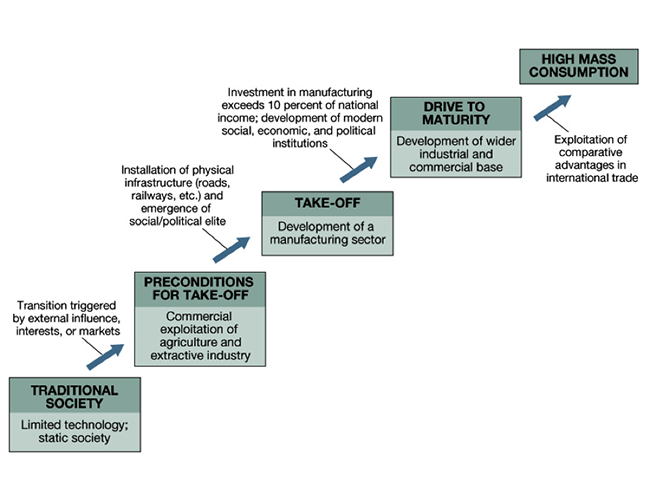
Rostow's Stages of Development
Countries' industries develop in 5 stages over time: Traditional Society, Preconditions to take off, Take off, Drive to maturity, High mass consumption.
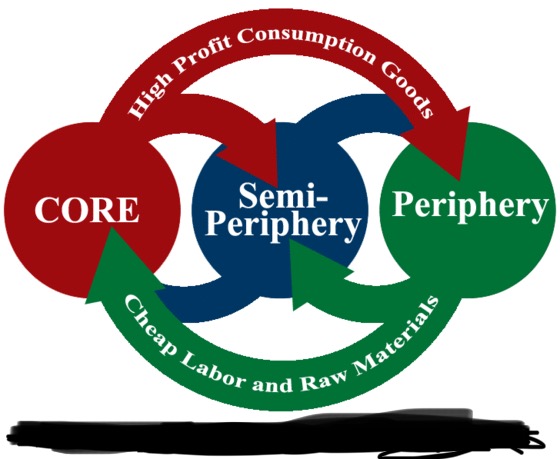
Wallerstein's World System
The connection between core-periphery relationships and industrial development. Core countries sell their high-profit goods to the periphery/semi-periphery countries, while the periphery and semi-periphery countries have raw materials and labor to produce those goods.
Dependency Theory
The idea that the World Systems Theory’s dependency was caused by colonization. As periphery countries were colonized, their production was replaced by labor which helped the core countries to develop goods, resulting in them becoming dependent on the core countries for food and consumer goods.
Weber's Least Cost Theory
The pattern with industries is that the transportation costs of raw materials to the factory and the finished product to the market are the lowest.
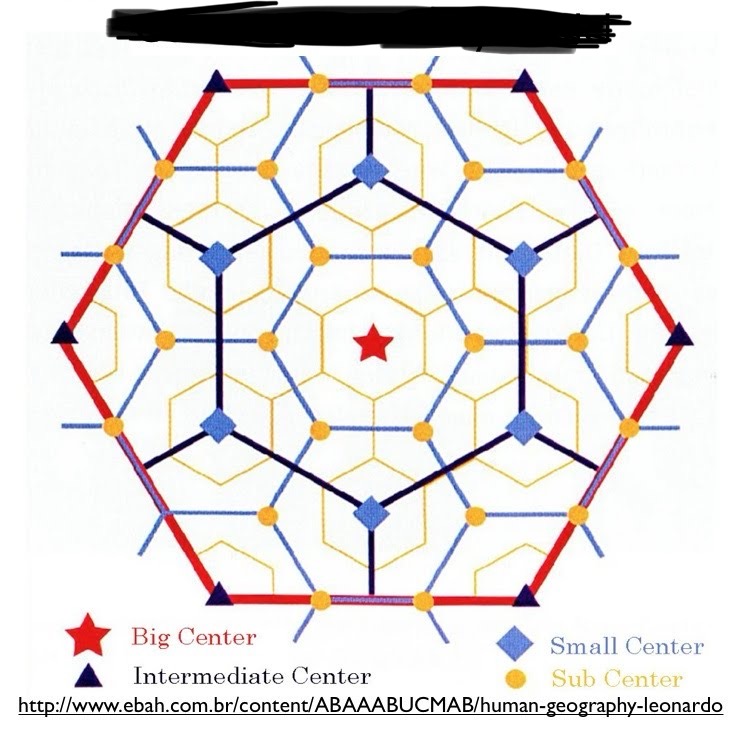
Christaller’s Central Place Theory
Based on how far people are willing to travel for work and products, creating a hexagon shape of main cities is surrounded by small towns and cities.
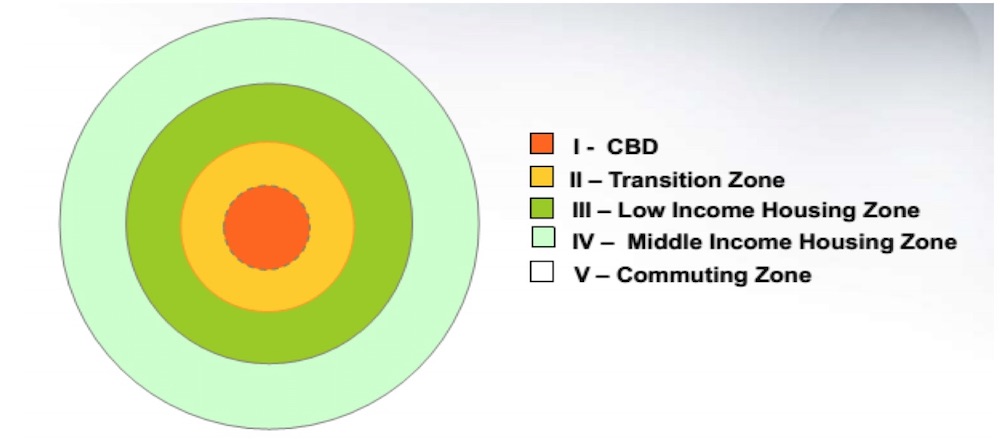
Burgess Concentric Zone Model
Describes the layout of a city. The center of the city, the business district, is surrounded by rings of industry/residential areas, with the most wealthy people living the furthest from the center.
Gravity Model
The idea is that people would be more willing to go to certain places over others, such as a big city like Chicago compared to a smaller city like Detroit.
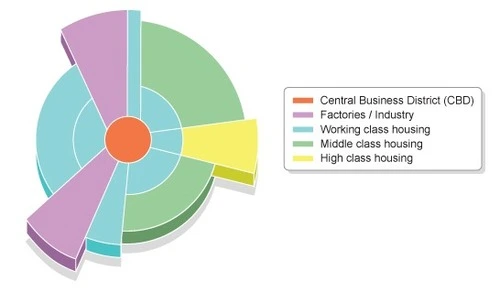
Hoyt Sector Model
A city map where the lowest class lives around transportation, while the upper class lives along business.
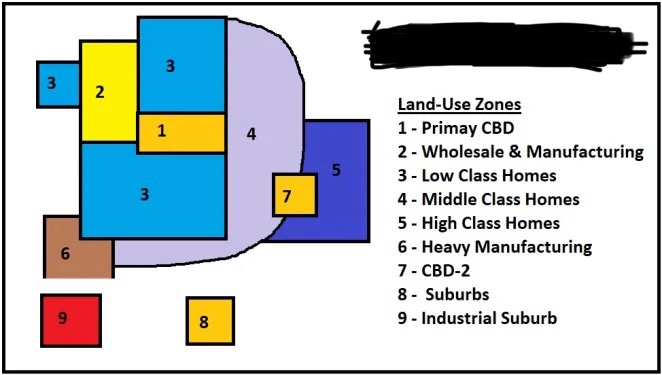
Harris Ullman Multiple Nuclei Model
City layout with multiple central business districts.
Borchert's Epochs of Urban Growth
Change in the history of urbanization with cities first being developed near ports and major waterways, then along railroads and steamboats, in the early 20th century with long haul railroads, to the development of gasoline-powered transportation including cars and planes, and since the 1970s, they have been developing around the service and information technology sectors.
Zipf's Rank Size Rule
The formula nth largest city is 1/n of the largest city. For example, the second-largest city in a country is half of the size (population) of the first-largest city.
Bid-Rent Curve
The further away from the central city, the higher the land prices.
Topographic maps
Used to show the natural and man-made features in an area including the elevation in detail. They use contour lines to depict elevation.
Choropleth Map
A type of thematic map that uses color to show information.
Isoline Map
Use lines or 'counter lines' to show information. This can commonly be seen with graphs displaying weather.
Dot Density Maps
Maps that show information with dots.
Flow Line Maps
Show the movement of things from one place to another using arrows. Thicker arrows would represent more movers while thinner arrows would represent less movers.
Cartogram
Distorts the shape of maps to depict the information they are trying to show.
Mental Map
The maps that people create in their minds based on their own experiences and knowledge.