AP Micro unit 6
1/25
There's no tags or description
Looks like no tags are added yet.
Name | Mastery | Learn | Test | Matching | Spaced | Call with Kai |
|---|
No analytics yet
Send a link to your students to track their progress
26 Terms
Market failure
occurs when a market creates an inefficient outcome
Market Failure
Sources and How
Monopolies → underproduction of Q
Positive externalities → underproduction of Q
Negative externalities → overproduction of Q
Asymmetric Information → lack of info by seller or buyer
Socially optimal
Marginal Social Benefit = Marginal Social Cost → MSB = MSC
“efficient/allocative” means this
Marginal Analysis
Society should act when
MSB > MSC
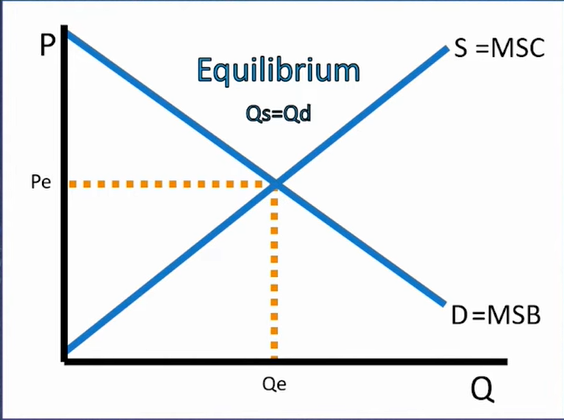
Competitive Market without externalities
MSC = S
MSB = D
no private curves found
Pe/Qe is where we produce → b4 n after leads to over/underproduction
Firms’ socially optimal
Perfectly competitive: P = MC
below or over price resaults in higher or lower Q produced
Monopoly: P = MC vs. profit at MR = MC
MC curve is the MPC curve
Monopsony: S= MRP vs. hire at MRP = MFC
At Socially optimal points:
TSurplus is maximized
No DWL
resources are allocated optimally
“When costs and benefits are internalized”
producing at the social optimal Q
All things that cause DWL
Taxes + trade
price floor/ceiling
imperfect comp.
externalities
public goods → cant charge ppl
asymmetric info
Externalities
Determining a tax or subsidy effect
is the market structure over or under producing?
Tax will reduce DWL if overproduction
Subsidy will reduce if underproduction
OR: DWL will worsen if given tax when under and vice versa
→ is isnt about the externality type
Negative externalities
Definition
“Spill over costs” → bad effect to society
Positive Externalities
“Spill over benefits” → good effect to society
Externalities in consumption/Production
Consumption: When externalities happen due to consumers = Effects demand curve
Production: externalities happen due to Producers = Effects supply curve
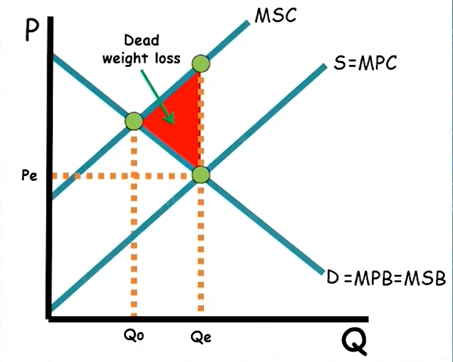
Negative externalities of Production
Graph
MPC = MSB is where we produce equilibrium
Qo: optimal Q
DWL always points to optimal Q point
MPC is above MSB
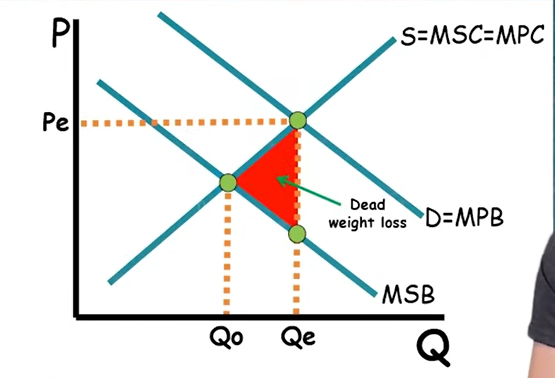
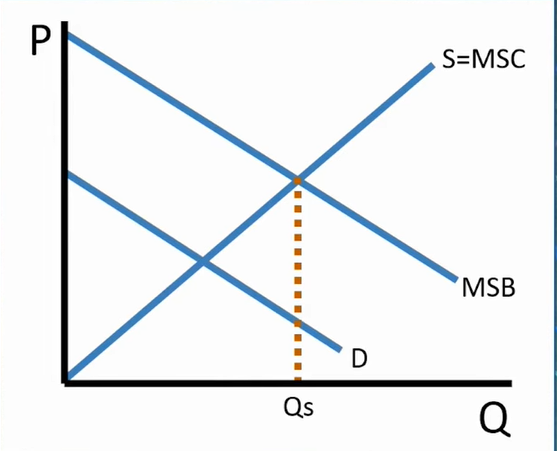
Negative externality of Consumption
produce at MPB = MSC → equilibrium pe qe
Production occurs at equilbrium
MPB is below Demand
What shifts in positive externalities
Production: MPC above MSC
Consumption: MPB above MSB
→ DWL points to optimal point
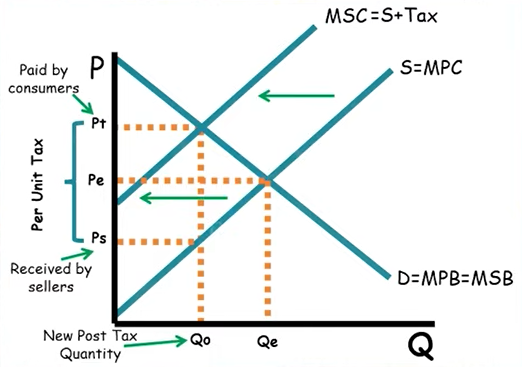
Negative externality
Per- unit Tax
→ regardless of consum/prod
The negative externality is a overproducing market in which will become socially optimal with a tax that shifts focus on curve MPC to MSC → production becomes at Qo
tax starts from Po till we hit the MPS curve
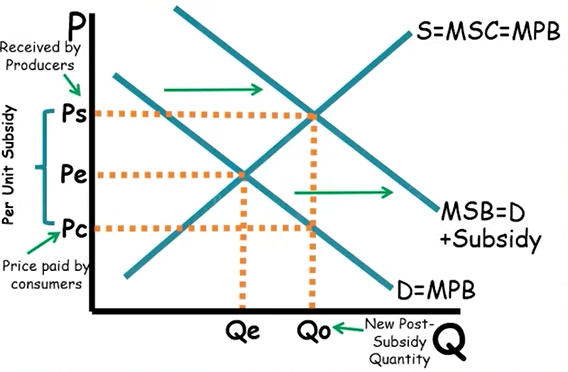
Positive externality
Per- unit subsidy
→ regardless of consum/prod
The positive externality is a underproducing market in which will become socially optimal with a tax that shifts focus on curve MPB to MSB → production becomes at Qo
subsidy starts from optimal point till we hit the MPB curve
“Market Quantity”
Q equilibruim not optimal Q
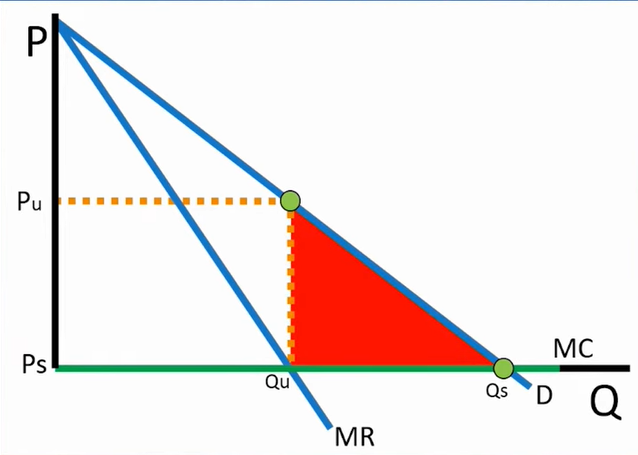
Monopoly producing a non-rival good
Qs n Ps = p=mc → optimal
Qu is production occurs
Red is DWL
MC WILL EQUAL ZERO
Excludable
paid for/[ban-able by gov]
people can be prevented from using it if they don’t pay
Non-excludable
Free by government
Rival
Diminshes for others with personal use
Non-rival
No amount of using it will diminish its use
What effect does a non-excludable good have on a market
Demand < MSB
“Perfectly competitive free market economy”
unit 6.5 reference → elaborate later