STA 2023 Exam 1 Study Guide (University of Florida)
1/140
There's no tags or description
Looks like no tags are added yet.
Name | Mastery | Learn | Test | Matching | Spaced | Call with Kai |
|---|
No study sessions yet.
141 Terms
Statistics
the art and science of learning from data, which involves data collection, organization, and interpretation.
Design
the process of determining how to get data
Description
the process of organizing data in a meaningful way, with numerical summaries or graphs.
Inference
involves making some conclusion about the population of interest based on a random, representative sample
Population
all of the subjects we're interested in
Sample
all of the subjects for whom we have data
Statistic
a numerical summary of the data for a SAMPLE
Parameter
a numerical summary of the data for a POPULATION
Categorical variables
variables that do not take on a meaningful numerical value (ie. gender, race, major)
Are zip codes quantitative variables?
No, they are categorical. They cannot be meaningfully averaged together.
Quantitative variables
variables that take on meaningful numerical values, which can be described in terms of center and spread
Discrete variables
a type of quantitative variable that can take on a finite list of outcomes (ie. the number of defectives)
Continuous variables
a type of quantitative variable that can take on an infinite list of outcomes (ie. height and weight).
Which graphical summaries are appropriate for categorical variables?
bar charts and pie charts
Which graphical summaries are appropriate for quantitative variables?
dotplots, stemplots, and histograms
On stemplots, what does the number with the parentheses mean?
it means that the median is in that row
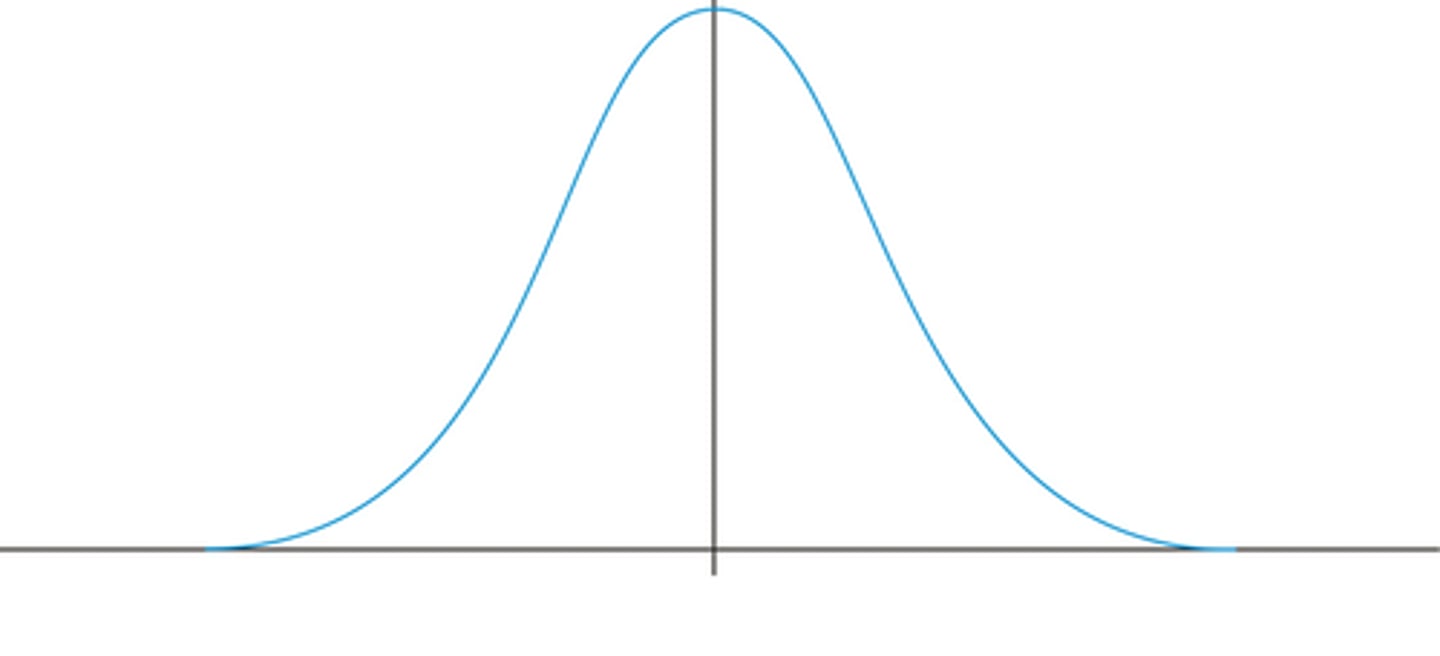
"Mound" or "bell-shaped" distribution
where most of the values are concentrated in the middle—unimodal and roughly symmetric
"Uniform" or "rectangular distribution"
a distribution in which all of the options are equally likely
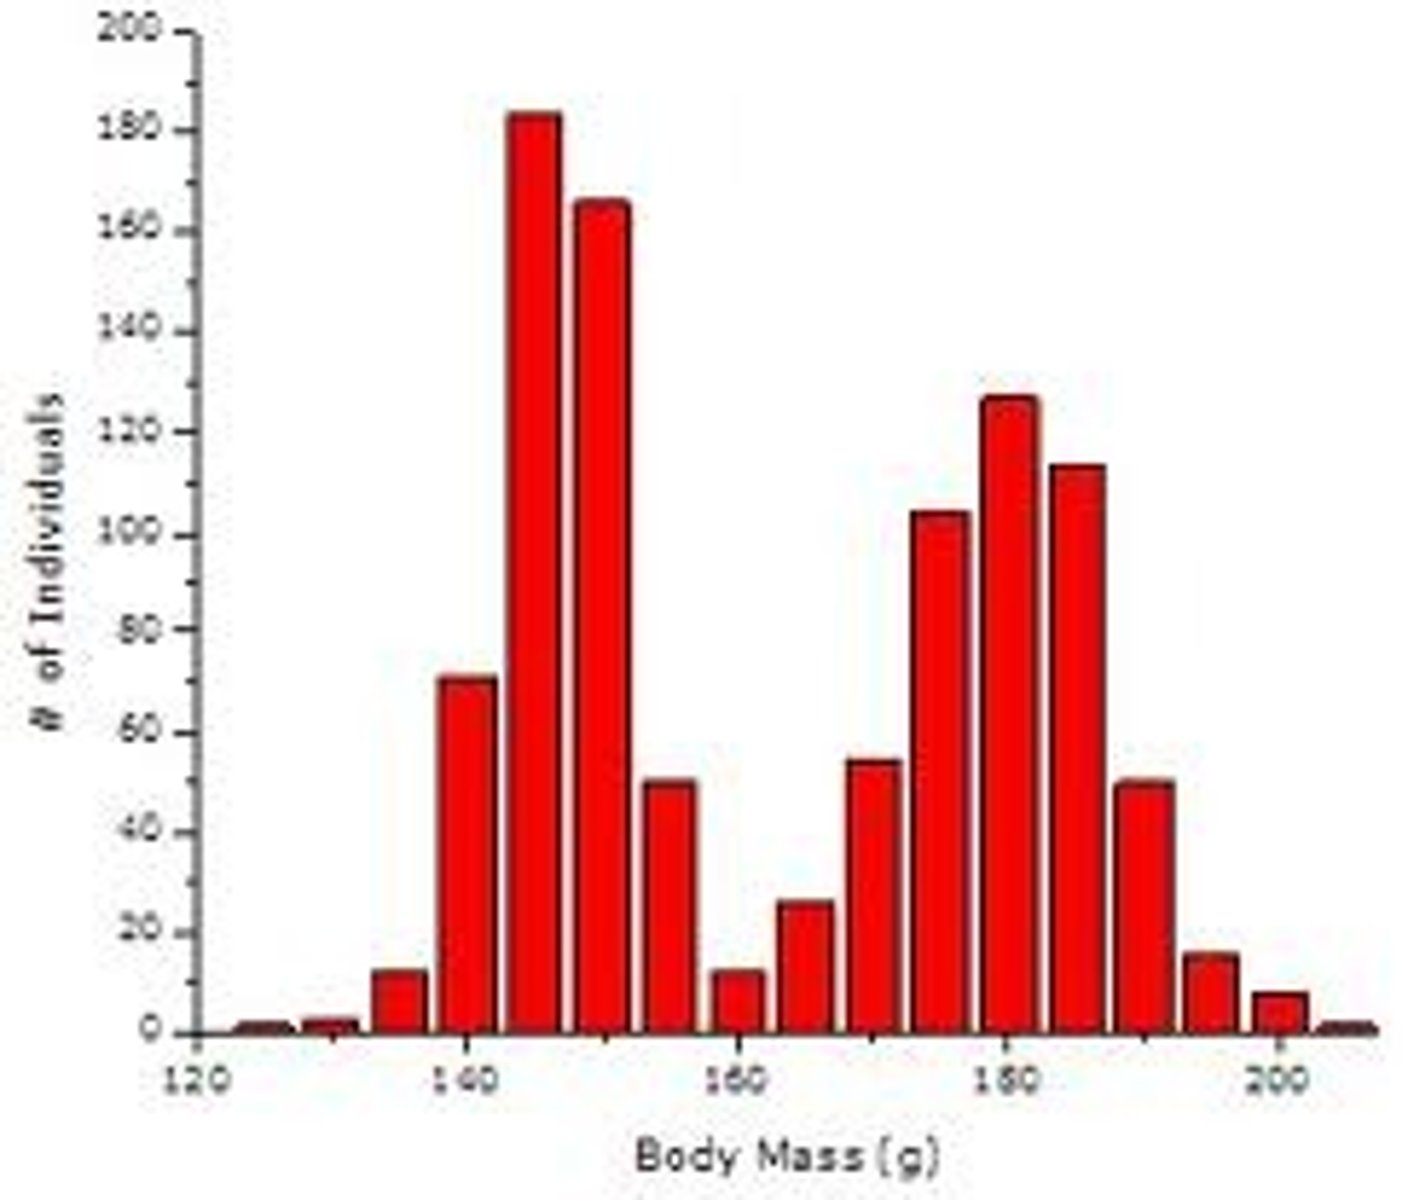
"bimodal" distribution
a distribution with two modes, which are represented by two big bumps in the associated histogram
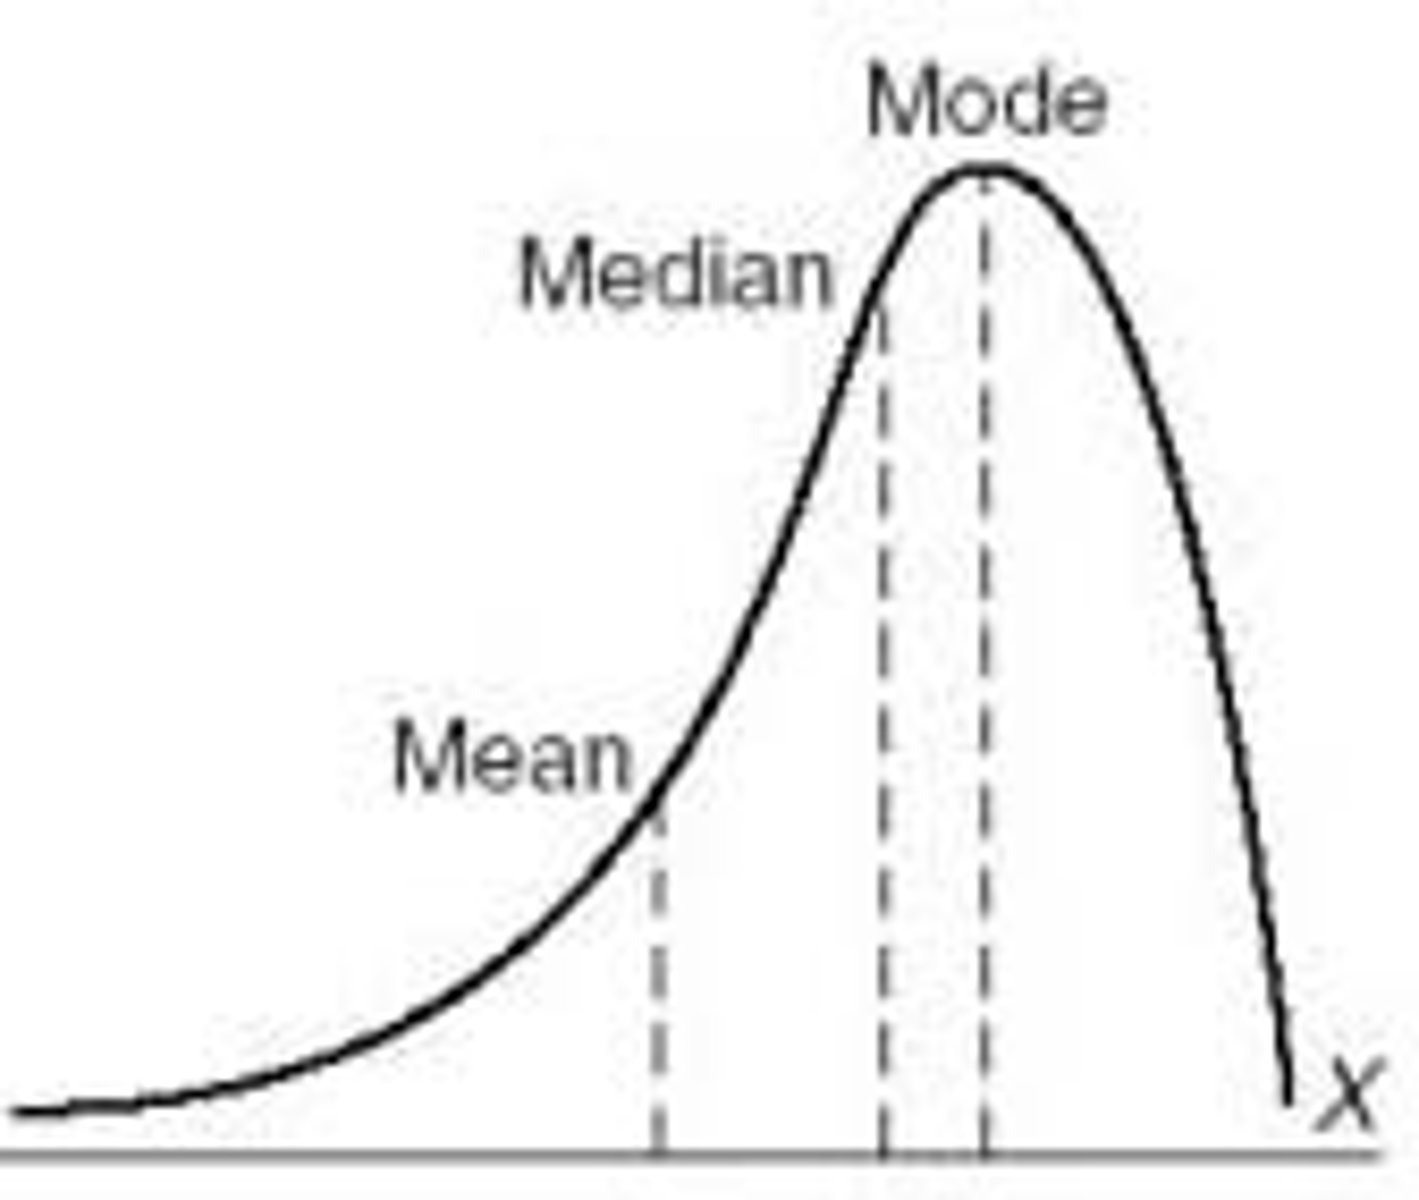
"skewed left" distribution
a distribution with a tail extending to the left, where most of the observations are clustered around the higher values
"skewed right" distribution
a distribution with a tail extending to the right, where most of the observations are clustered around the lower values
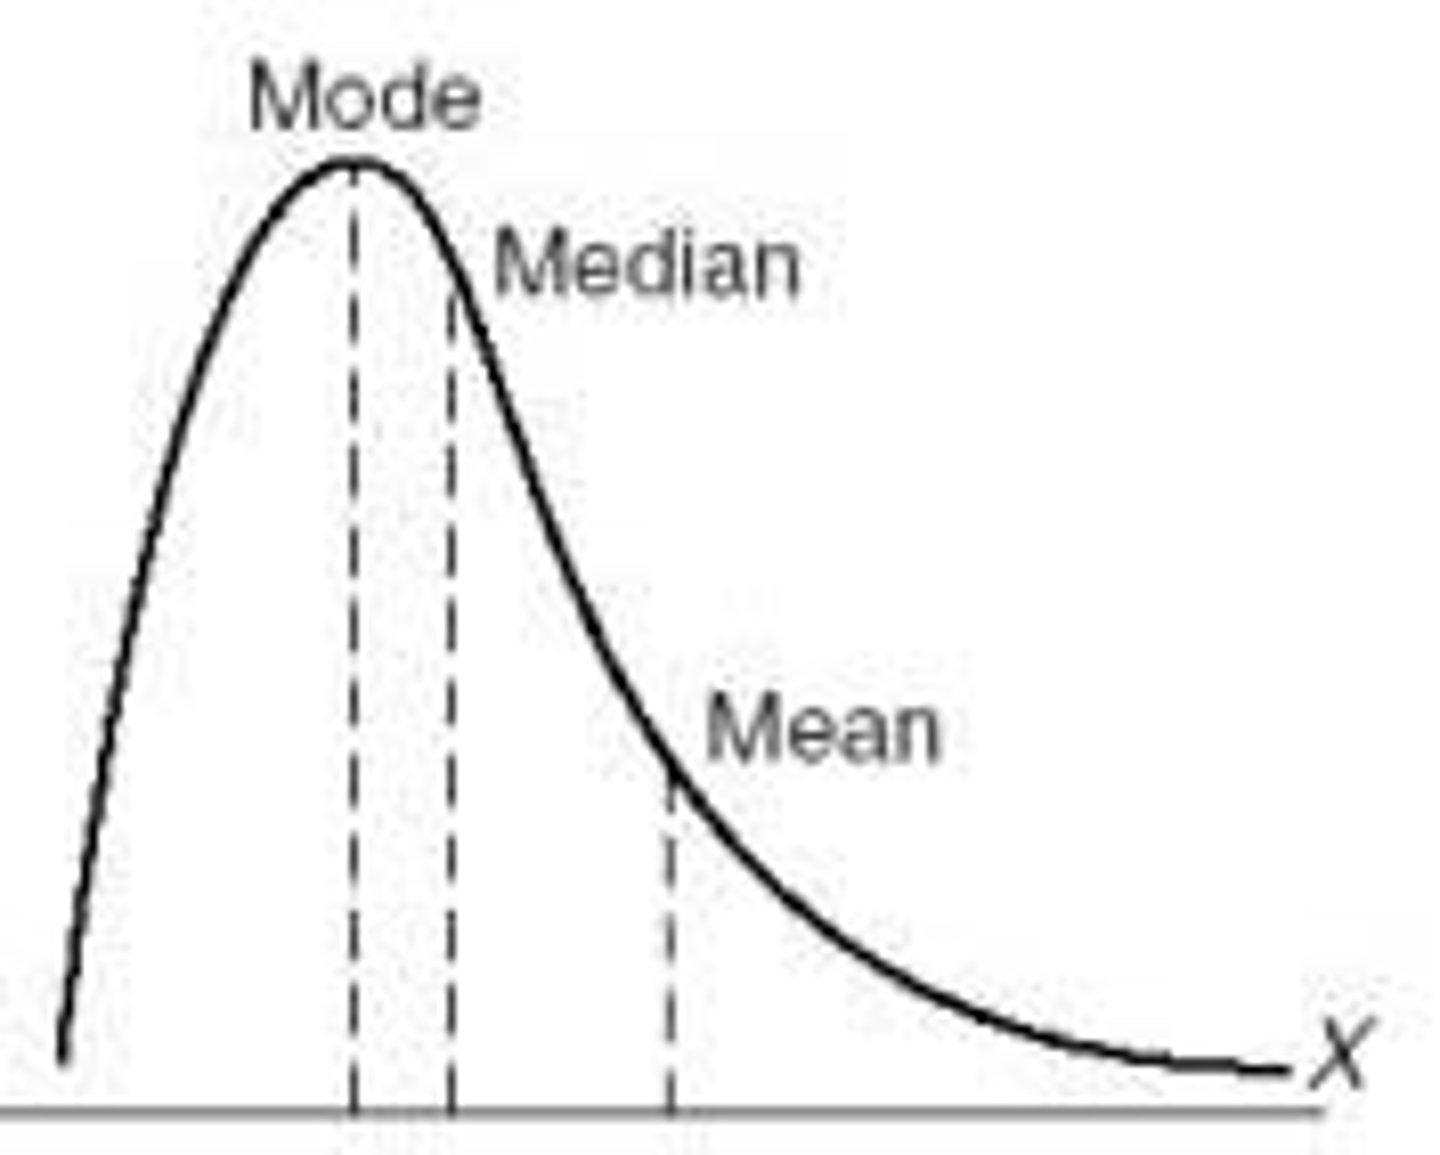
mean
the average of the observations (x bar)
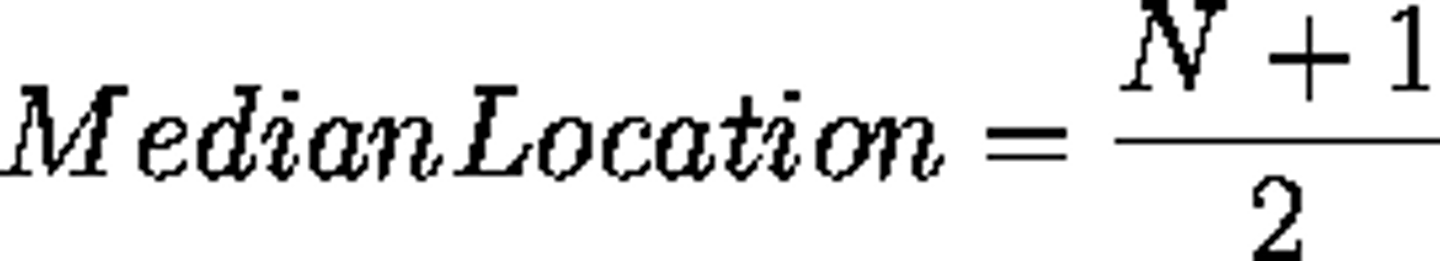
median
the middle observation
mode
the most common observation
position formula
a formula used to find the position of the median on the data set
Is the mean resistant to outliers?
No, it is highly susceptible to outliers
Is the median resistant to outliers?
Yes, the median is resistant to outliers.
Is the mode resistant to outliers?
Yes, the mode is resistant to outliers.
Range
the difference between the largest and smallest values in a data set
Variance
(s) the average of the squared deviations from the mean
Standard deviation
the square root of the variance, expressed in linear units.
Can the standard deviation be negative or zero?
No, never negative, only zero when all of the numbers are the same.
What percentage of observations fall within one standard deviation of the mean?
68%, empirical rule
What percentage of observations fall within two standard deviations of the mean?
95%, empirical rule
What percentage of observations fall within three standard deviations of the mean?
99.7%, empirical rule
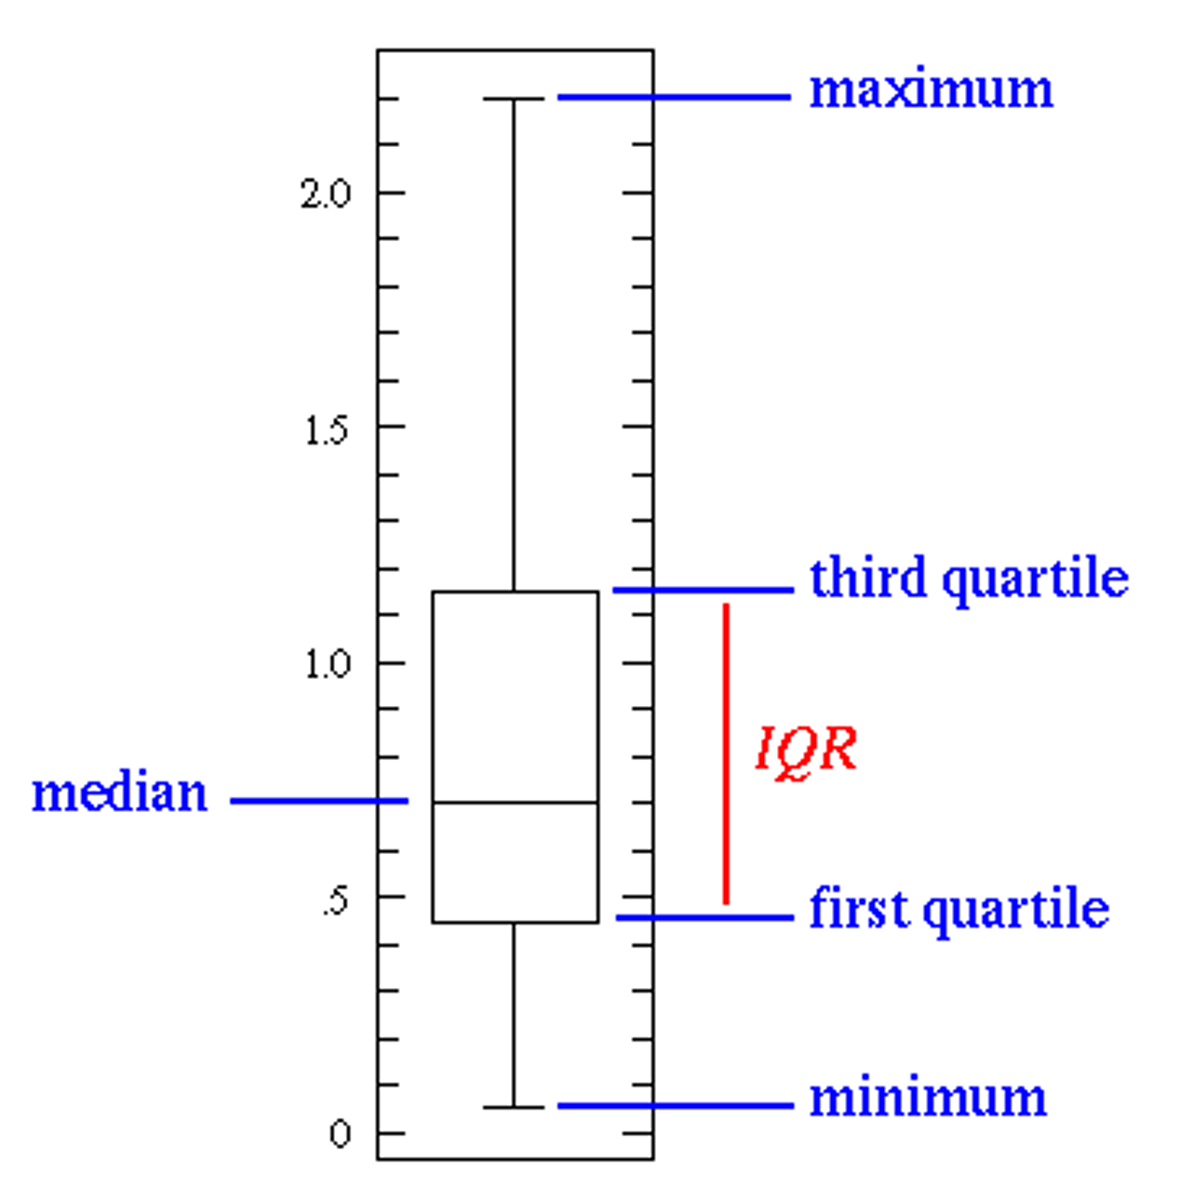
Lower quartile (Q1)
the 25th percentile; the median of the lower half of the data set; 25% of the data is lower than this value
Upper quartile (Q3)
the 75th percentile; the median of the upper half of the data set; 75% of the data is lower than this value
Is the range resistant to outliers?
No, the range is strongly affected by outliers.
Interquartile range (IQR)
a measure of spread; describes how spread out the central 50% of data is; (Q3-Q1)
Five number summary of positions
the minimum value, lower quartile, median, upper quartile, and maximum value
Boxplot
a graphical way to present the five number summary of positions
What do the asterisks at the end of the whiskers in a boxplot stand for?
outliers
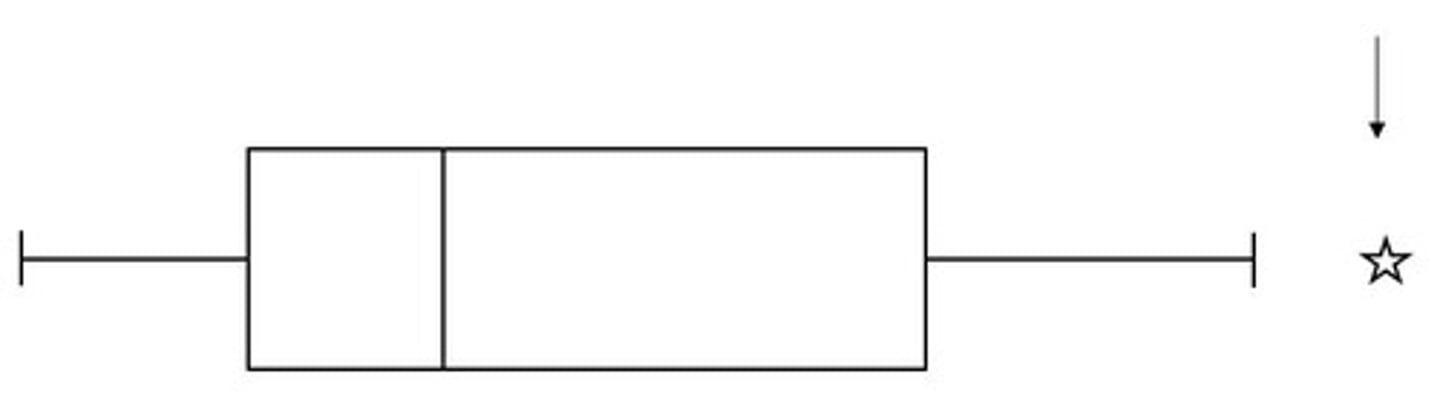
What does a skewed right boxplot look like?
the box is more in the lower numbers
What does a skewed left boxplot look like?
the box is more in the higher numbers
What does a roughly symmetric boxplot look like?
the box is in the middle of the numbers
Explanatory variable
the independent variable, what we manipulate (also called predictor variable; X)
Response variable
the dependent variable, what we're trying to make a statement about (Y)
Contingency tables are used to describe the association between...?
two categorical variables
Scatterplots are used to describe the association between...?
two quantitative variables
Correlation coefficient
r; a quantitative measure that tells us about the strength and direction of a linear relationship between two variables
the correlation coefficient can vary between...?
-1.00 (perfect negative correlation) and +1.00 (perfect positive correlation)
Coefficient of determination
R^2; equal to the square of correlation, tells us what percentage of variability in the y value can be explained by the linear regression on x.
When do we not interpret the vertical intercept of a regression line?
when it would not make sense to have data around x=0
What is the general equation of the least-squares regression line?
yhat= a + bx
In the general equation of the least-squares regression line, what does a mean?
the vertical intercept
In the general equation of the least-squares regression line, what does b mean?
the slope
In the general equation of the least-squares regression line, what does yhat mean?
the predicted equation for a line of best fit in linear regression
Residual
the difference between the observed value and the predicted value; y-yhat
Least squares regression method
a regression method that fits a line to the data by minimizing the squares of the residuals
Does a least-squares regression line pass through the point (xbar, ybar)?
Yes, the LSRL goes through that point.
Extrapolation
Using a trend in a data set to predict future values that lie outside the range of the data
Influential outlier
an outlier that lies so far outside the rest of the data that it causes a major change in the correlation coefficient, coefficient of determination, and the least-squares regression line.
Lurking variable
an extraneous variable that influences the association between the variables we're interested in
Confounding
occurs when the effects of two variables on the response variable are so intertwined that they cannot be separated
Simpson's paradox
when the association between two categorical variables is reversed upon the addition of a third variable into the mix
Experiment
involves dividing subjects up and assigning experimental treatments to them
Observational study
involves simply witnessing what's happening, without assigning treatments to specific groups
Volunteer sample
Sample that consists of people who volunteered to participate, rather than those randomly selected
Convenience sample
Sample that has people who were selected not at random, but rather because selecting them was easy.
Random sampling
a practice in which every set of individuals has an equal chance of being selected because they're chosen by chance.
What are the three methods for delivering a survey?
personal interviews, telephone interviews, and questionnaires
margin of error
one over the square root of n; accounts for the fact that the random sample may not be representative of the whole population
Undercoverage
occurs when the sampling frame is missing certain parts of the population
Nonresponse bias
occurs when some people are unwilling to participate in a survey, and those people may have different positions on relevant issues than those who participated
Response bias
occurs when a person who response to a survey gives false information, either intentionally or unintentionally
Experimental units
the individuals or subjects involved in the experiment
Placebo
a treatment with no active ingredient, given to control for the psychological effects of simply receiving a treatment
Blind study
a study in which the subject does not know which treatment they are getting
Double blind study
a study in which neither the subject nor the person administering the treatment or making the measurement knows which treatment was given
Control group
in an experiment, the group gets either the placebo treatment or no treatment at all
Replications
the number of people to get each treatment
Factors
an experiment's categorical explanatory values (x values, things being changed)
Levels
the different alternatives available for each factor
Treatments
a combination of factors and levels
Matched pairs design
an advanced form of experimentation in which similar experimental units (such as twins) are matched and each receives a different treatment
Cross-over design
an advanced form of experimental design in which the same experimental unit is given different treatments at different times
Block design
an experimental design similar to a matched pairs design, except blocks of three or more experimental units are used (instead of two experimental units)
Cross-sectional study
Takes a 'snapshot' in time, with observations of the here-and-now.
Case-control study
involves a retrospective look at the differences between one group of people who had a positive outcome and another group of people who had a negative outcome.
Prospective study
a forward-looking study in which experimental units are identified and followed into the future
Probability (of a random event)
the proportion of occurrences of that outcome in an extremely long series of independent trials
What does it mean to say that trials are independent?
the outcome of one trial is not affected by the outcome of other trials
Sample space
the set of all possible outcomes
Event
a particular outcome or group of outcomes (a subset of the sample space)
Complement rule
the probability that an event will NOT happen is one minus the probability that the event WILL happen.
Disjoint events
two events that do not share any outcomes in common
Multiplication rule
the probability of two INDEPENDENT events occurring is the product of their probabilities; P(A and B) = P(A) x P(B)
Conditional probability
the probability that one event will occur GIVEN that another has occurred.
How can you read the probability P(A | B)?
The probability that A will occur GIVEN that B has occurred.
False positive
a case in which a test says that the subject has the condition we're testing for when he or she really doesn't