Statistical analysis
1/42
There's no tags or description
Looks like no tags are added yet.
Name | Mastery | Learn | Test | Matching | Spaced | Call with Kai |
|---|
No analytics yet
Send a link to your students to track their progress
43 Terms
Sample?
used to draw conclusion about one or more characteristics of a population
representativeness is important
What is the null hypothesis?
its about the mean in the population
h0
What is the T statistic?
used to determine whether the null hypothesis is rejected or not
Standard error?
uncertainty around estimate
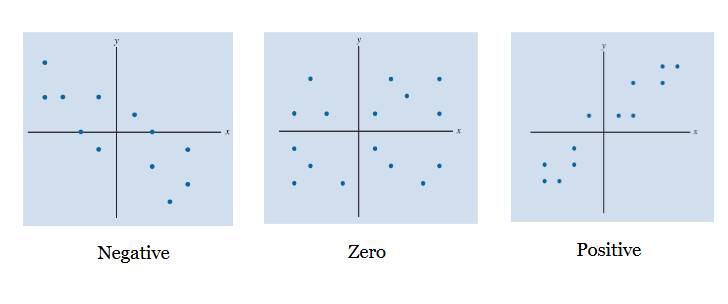
Scatter plot patterns
Correlation patterns
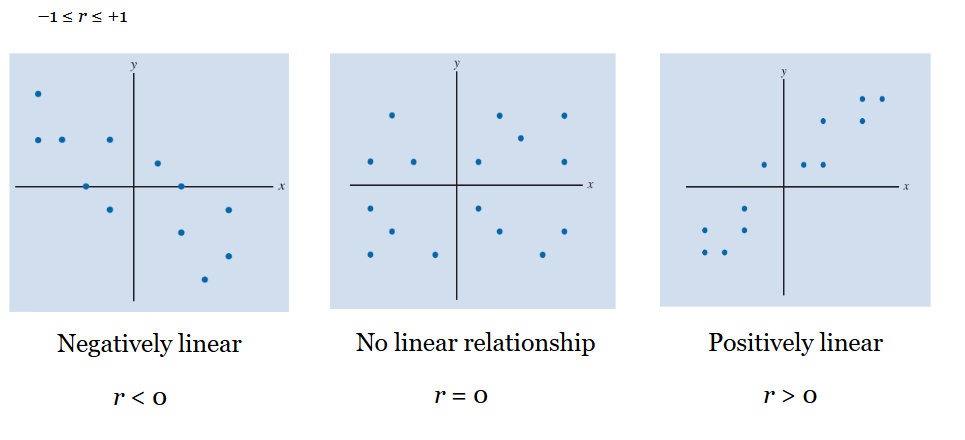
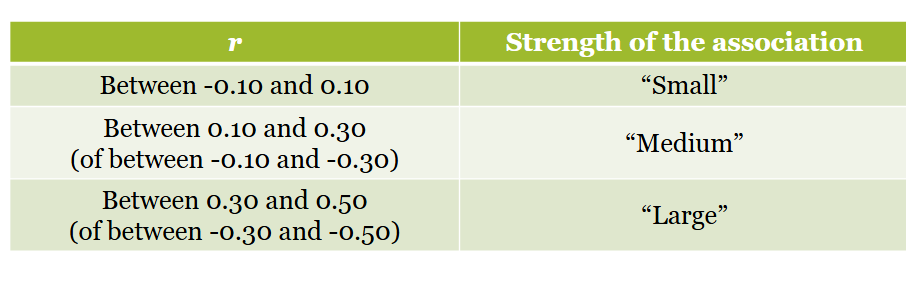
Correlation coefficient
closer to -1: more strongly the variables move in the opposite direction
closer to 1: more strongly the variables move in the same direction
Regression analysis
What is the effect of the IV on the DV
What is the relationship between the sales of my product and the properties of my locations?
DV/Y is predicted by IV/X
DV to be explained
IV the explanator
Ordinary Least Squares/OLS
the line of best fit
a smaller amount of predicting errors
how close are the residuals to the regression line → shows you the line with the least amount of prediction errors possible for a straight line
Linear regression model
make predictions within data or outside of it
can summarise how predictions / average values of an outcome vary across observations defined by a set of predictors
y = value based on fitted line + distance from fitted line
y = β0 + β1x + ε
Y is related to an intercept (constant), a variable x and an error term
β0 and β1 are the parameters
need to be estimated
β1 provides information about how y and x are related to each other → what regression models do
Interpreting linear regressions
Small p-value
evidence for a significant relationship between x & y → interpret the coefficient
Large p-value
no evidence for a significant relationship between x & y → don’t interpret the coefficient
Binary variables
variable that takes either of two values
Process
Transform into a “dummy” or “indicator” variable where one category = 0 and the other = 1 (if not already 0/1 scaled) and include that variable in your model
The 2 categories have numerical values of 0 or 1
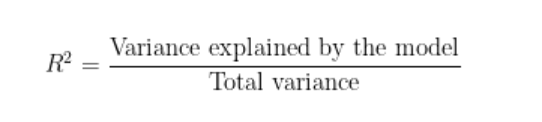
R2/ R squared
Percentage of the variation in y/dv that is explained by x/iv
Between 0% and 100% (e.g. 28%)/ number between 0 and 1 (0.2)
a goodness of fit measure
tells us how much the fit of model is improved
Higher R2 = better the model fits the obs
More variance = data points are closer to the line
line is steeper, reduce variaton
x helps to predict y
Causality
how does the change in X affect Y
if one goes up the other goes down
Correlation is not causation
why is the diff between correlation and causality so important
useful to establish causality to know what the causal effect of the variable is
medical world
policy: impact of policy change, can mean
ways to establish causality
experiments, treatment and control group, measure a certain outcome and compare it
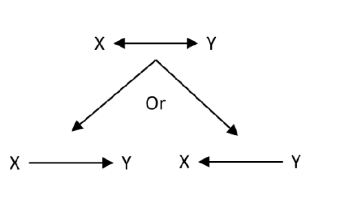
Causal claim
a direction
X is doing something to Y
are associated/correlated/related
Non causal claims
no direction or specification which of X & Y goes first
talking how the variables work together
Reverse causality
Y to X
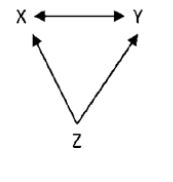
Omitted variable
Z is related to X & Y and plays a big role
Logistic regression
to predict a categorical outcome 1 VS 0
This is better than linear because probabilities are assumed instead of 0 and 1 only
used to predict categorical variables
s line makes sure that we have predictions between 0 and 1
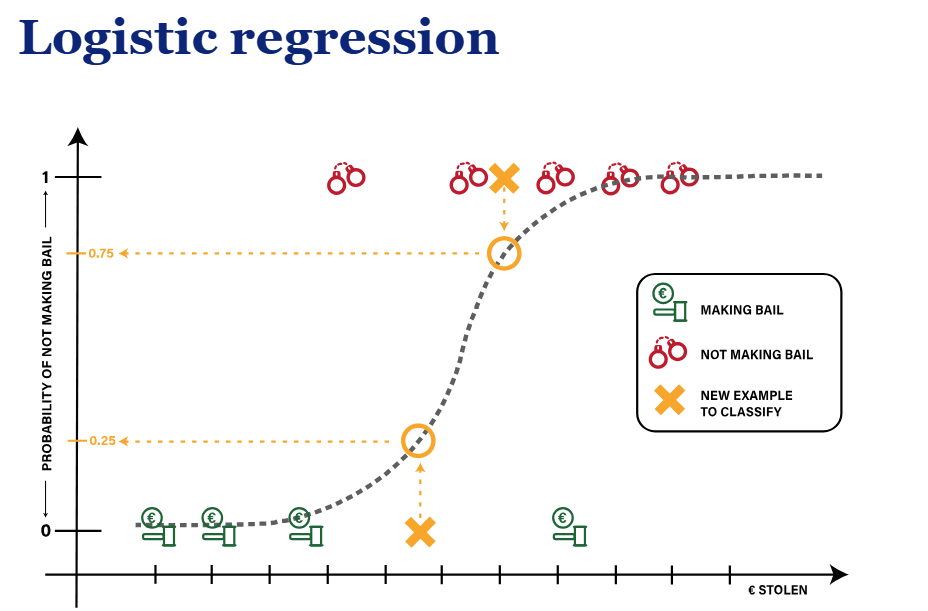
Interpreting logistic regression
1 DV and multiple IVS
Positive: we expect Y=1 to become more likely as X increases
Negative: we expect Y=1 to become less likely as X increases
K nearest neighbours
x and y axis could be anything
Process of KNN
based on characteristics and compare the indi to everybody else in the database, and place them accordingly → look at the neighbours
K = No. of neighbours to consider & the indi is assigned to the most common label amongst the neighbours
make prediction on A, depending on the probability of neighbours at least 50%
based on a circle
K is the basis of the comparison
depends on the domain tho
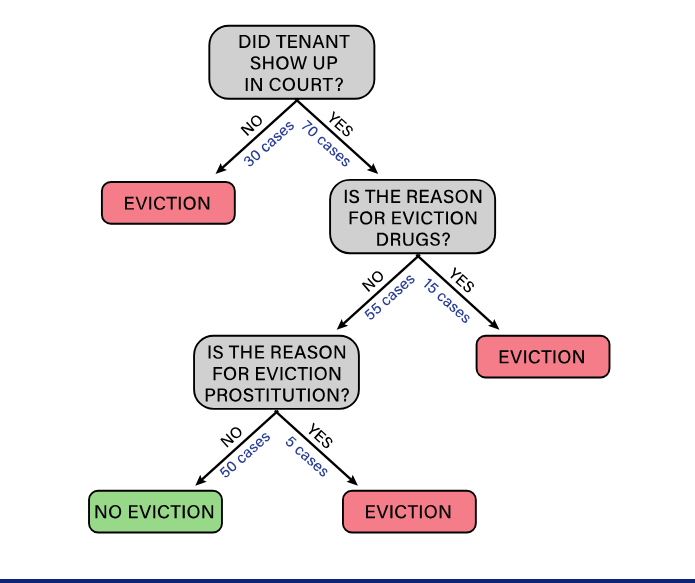
For k we determine the percentage of points that belong to category 1 (e.g., eviction)
At least 50%? → Classify as category 1
The new example is ALWAYS placed after
how large K should be?
depends on the prediction performance of your model
does it change a lot
messing with diff k values what outcome are there
what is the predictive power of a smaller K → can miss patterns: overfitting
too big: can miss trend
trading off process, need to find the balance
SVM?
support vector machines
look for hyperplane line that separates the 2 groups + a border house closest to the line on both sides
goal: make the distance as large as possible and can separate the groups properly → if as far as possible, good job
domain specific
Depends on the characteristics of the data set, needs to be able to separated
Decision tree
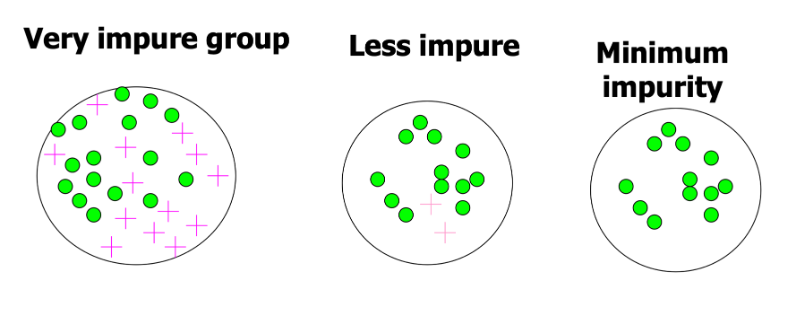
oal of decision tree is go from very impure to minimum impurity
to arrive at the final tree, 1/0
Impurity
measure of heterogeneity, how mix is the data at each step
maximum value (= 0.50) when the observations are evenly distributed among the categories (50% in category 1; 50% in category 0)
Impurity is 0 when all observations belong to 1 category (100% in either category 1 or category 0
It decreases from Impure to Pure
pluses and circles - mixture of both
categories
very impure
50 of each
max impurity
max value of .5
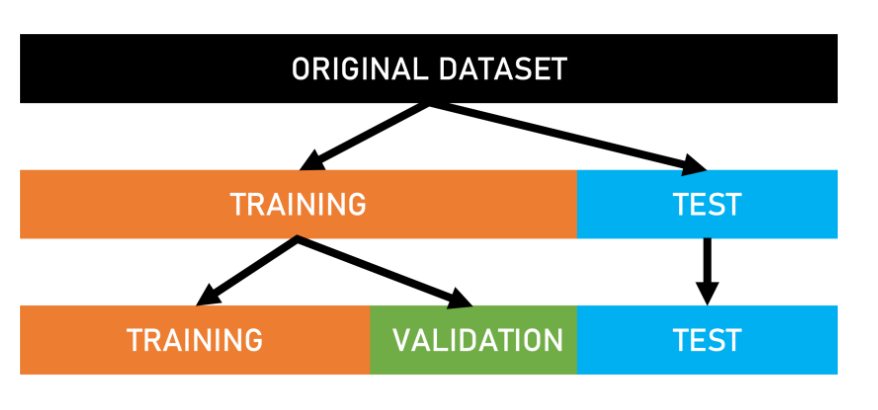
Training and testing
Prediction is probs the most interesting phase
testing set is used for prediction purpose
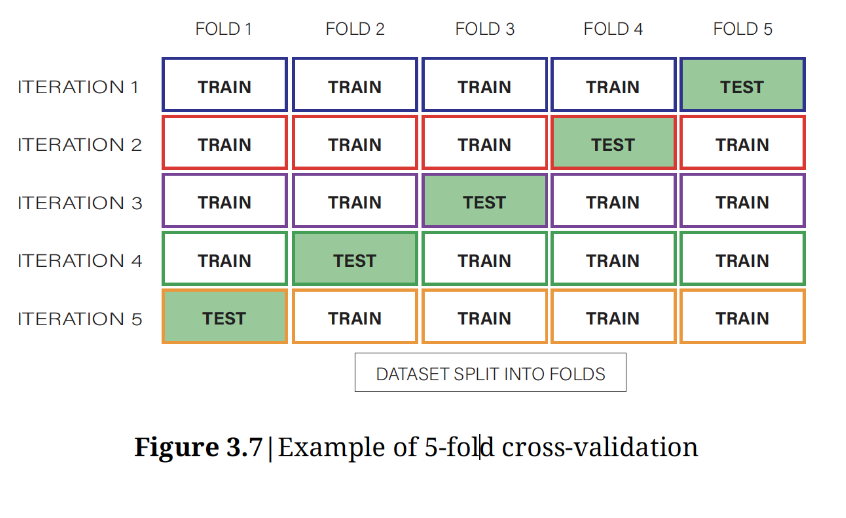
K fold cross validation
way to evaluate the model’s performance
K fold cross validation process
take all available data for training model & split set into k parts
divide dataset in 5 parts
the first 4 is 80, test is used to predict → based on iterations
take one part out and train the model using the remaining k-1 parts
trained model is compared to labels & actual labels with withheld parts
repeated till each k withheld part is done
full use of data for prediction
cross validation is used
determine the optimal parameters of the system
Sensitivity
percentage of true positives within category 1
Specificity
percentage of true negatives within category 0
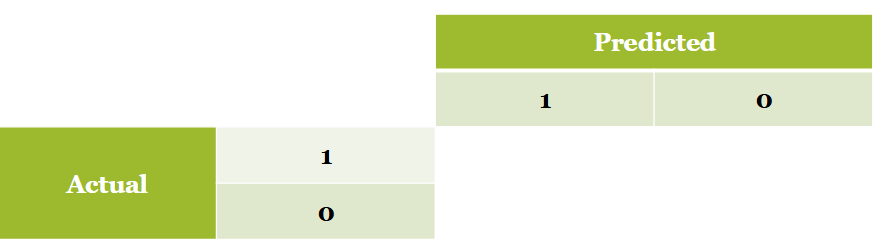
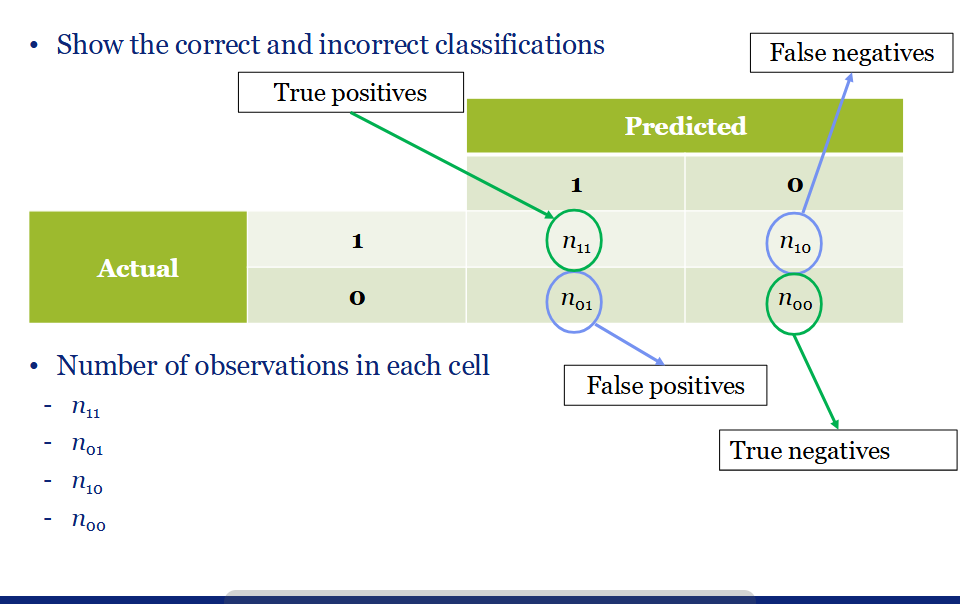
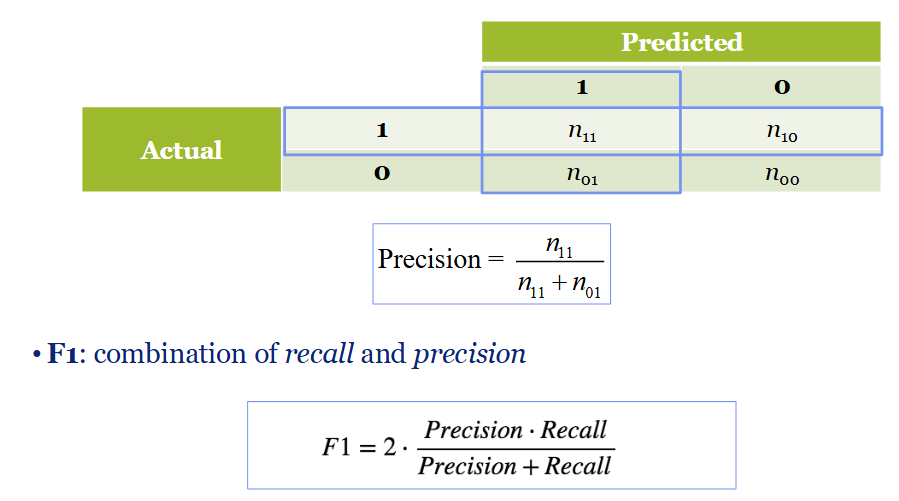
Model evaluation: confusion matrix
it shows the correct and incorrect classifications
looks at the no. of observations in each cell
In practice for confusion matrix
1/0 variable, compare to predicted values
false negative → predicted 0 and when its supposed to be 1
false pos → does not match reality
true neg and pos are the ones we care about good prediction, add them together and divide by total no of obs → accuracy
high accuracy is good for prediction
recall/precision/f1score
checks whether if 1s are predicted well
recall formula
true pos / true pos + false neg
Precision formula
true pos/ true pos + false neg
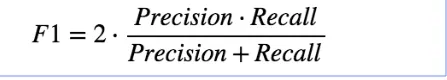
F1 score
used to evaluate performance
a harmonic mean between precision and recall
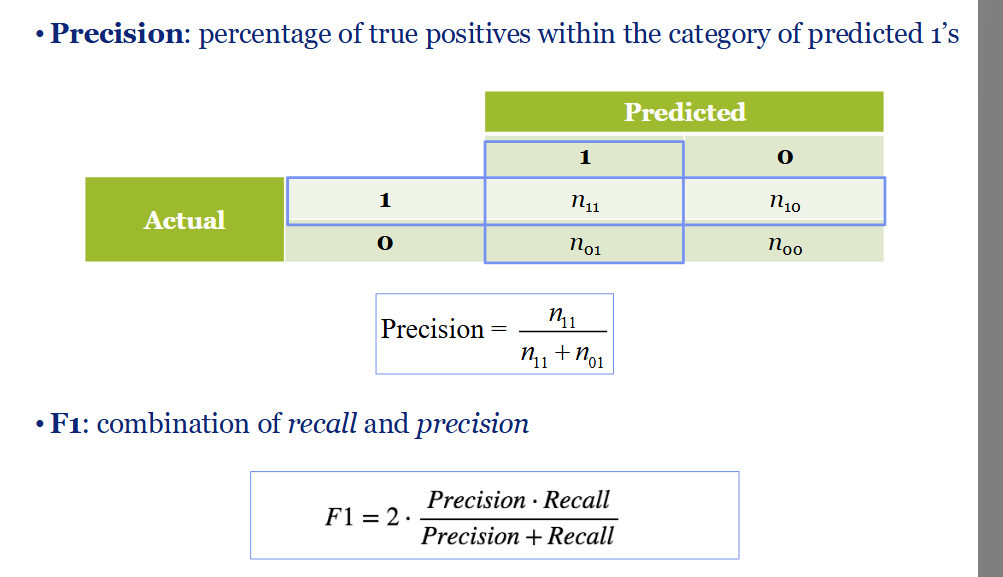
F1 formula
Precision and F1
Precision: percentage of true positives within the category of predicted 1’
the percentage of cases with a specific outcome classified correctly by the system
Process of precision
predicted and actual case outcomes compared
True positive: the known truth of the actual value → need it: MATCHES
True negative: actual value is saying I don’t need it
False neg: actual value is telling is me I need, but model is saying I dont
False pos: what the model predict is not real
Accuracy
general measure of prediction quality
counts the no of correctly predicted observations divided by total number of observations
percentage of true positives and true negatives
Formula
True pos + True neg / all obs in the table
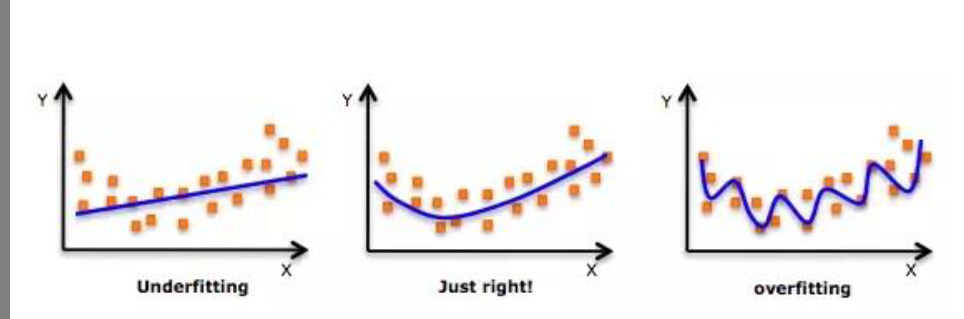
Overfitting
the model explains very well but does not predict we