Unit 8 - Confidence Intervals
1/27
There's no tags or description
Looks like no tags are added yet.
Name | Mastery | Learn | Test | Matching | Spaced | Call with Kai |
|---|
No study sessions yet.
28 Terms
point estimator
a statistic that provides an estimate of a population parameter
ex: p̂
point estimate
the numeric value of the point estimator/statistic (from a sample)
ex: 0.5
C% confidence interval
gives an interval of plausible values for a parameter
write as: point estimate ± margin of error
general formula: statistic ± (critical value * SD of statistic)
interpret confidence interval: “We are C% confident that the interval from [] to [] captures the true [population parameter in context]”
-if procedure repeated many times (get all possible samples), C% of the resulting confidence intervals would contain the pop parameter [thing you're measuring]
-probability that the confidence interval captures μ is either 0 or 1, but we don't know which (either does or doesn’t capture μ)
-"n% confidence interval" -> n% does NOT mean probability/chance
*the difference btwn the point estimate and the true parameter value will be less than the M.o.E. in C% of all samples (will be w/in the interval in C% of all samples)
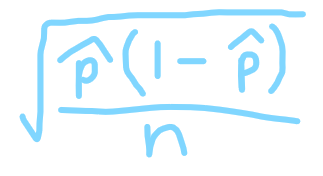
how to get margin of error (population proportion)
what margin of error does/doesn’t account for
critical value (t* or z*) * SD of the statistic (the SE since uses p̂ or x̄)
(margin of error for pop proportion or mean is critical value * SD of statistic)
z* x √[(p̂(1-p̂)/n] ← for pop. proportion
M.o.E. affected by SE (standard error) (z* or t*, n, sx)
-
accounts for random sampling error (variability when take multiple random samples)
DOES NOT account for sample biases (e.g. nonresponse, undercoverage)
confidence level C
gives the overall success rate of the method for capturing the true parameter
interpret confidence level: "If this method of constructing confidence interval was repeated many many times, about C% of the confidence intervals will capture the true [population parameter in context]"
*take many samples of the same size from [this population], the method would yield an interval that captures the true parameter value in C% of all possible samples (of many confidence intervals)
!!! why 95% → large enough to be correct while still keeping precision (don’t want useless/unnecessary #s)
ex: 99% means larger critical value/z-score, so larger margin of error, so wider confidence interval (less risk of incorrect b/c wider interval includes more #s)
-smaller C% confidence level -> smaller z*, smaller M.o.E., narrower confidence interval
-larger C% confidence level -> larger z*, larger M.o.E., wider confidence interval
get confidence intervals of two #s, one w/in shaded area and one outside shaded area
-both intervals same length
-within: contains the pop. parameter
-outside: doesn’t have pop. parameter
SD depends on sample size n; critical value depends on confidence level and sampling distribution of the statistic
incr n (sample size)
decr n (sample size)
-decr SE (the SD), more precise/smaller M.o.E. → narrower confidence interval
-incr SE (the SD), larger M.o.E. → wider confidence interval
-both do NOTHING to confidence level/correctness
Conditions to check before calculating confidence interval for p (population proportion)
Randomness (ex: SRS)
10% condition (n≤1/10*N)
Large Counts condition (np̂ ≥ 10 AND n(1-p̂)≥10)
use p̂ b/c don’t know p (if knew p, wouldn’t be estimating confidence interval)
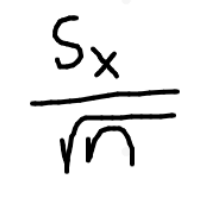
standard error
when the SD of a statistic is estimated from data
(pic for SE of sample proportion - don’t know p, so use p̂ to get SD of statistic)
SE of sample mean is sx/(√n) - don’t know σ, so use sx
z* vs. z-score
how we bound our confidence interval (for pop. proportion)
- and + value (from center, so same value diff sign, ex: -0.1, 0.1)
aka critical value; specifically used as the bounds for a confidence interval
vs.
how many SDs away a value is from the mean for any value
—both use SD away from the mean aka center
!!! 95% confidence from Normal curve, use ‘2’ from empirical rule → actually 1.96 SDs away from mean
question w/ someone claiming a % → check if percentage/proportion is in C% confidence interval. if not, it is not plausible (since interval gives the plausible values of p)
include units for numbers!
confidence interval given (a, b) -> point estimate aka statistic is right in the middle. M.o.E. is the difference btwn this middle # and the endpoint
poll has margin of error r% and C% confidence level, means that the poll used a method that gets an answer within r% of the truth abt the population C% of the time
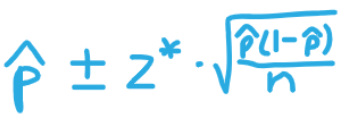
Formula to get C% confidence interval for an unknown proportion p
‘C% of its area is btwn -z* and z*’
p̂ is sample proportion
z* is from C% confidence
n is sample size
right of (±) is the margin of error
❕show work by putting formula and plugging #s
4 Step Strategy to answer Confidence Interval Questions
State - what is the population of interest? What parameter (e.g. p) do you want to estimate? What is your confidence level?
Plan - check conditions
Do - make calculations
Conclude - interpret confidence interval w/ context from the problem
What to do if you don’t know p̂ and need to estimate it
use p̂=0.5
(margin of error is largest when =0.5)
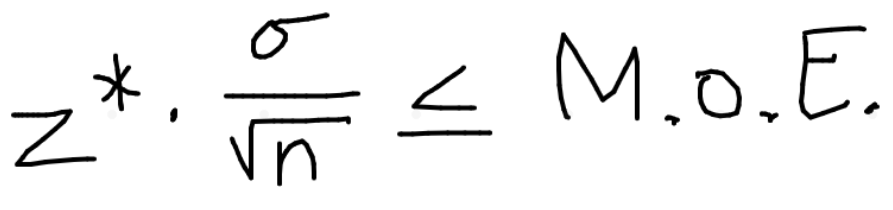
How to get sample size n that will yield a level C confidence interval for a population proportion p w/ a maximum margin of error of M.E.
gives M.o.E. as a percentage (put as decimal), p̂, and C% (use to find z*)
divide both sides by M.E. so just on left, multiply both sides by √n so just on right
square everything and solve for n
always round UP to nearest whole number (since n must be greater than or equal to the # you calculate)

How to get confidence interval w/ calculator for pop. proportion
Interpret confidence interval
[stat] ‘Tests’ [A] '(1-PropZInt)
x for # of successes, n for sample size, C-level for confidence level as decimal
—> get confidence interval, p̂, and n (again)
"We are C% confident that the interval from [] to [] captures the true [population proportion in context]."
How to get z* with calculator
[2nd] [vars] ‘invNorm’
area is the given C% level but as a decimal
rest ALWAYS μ=0, σ=1, Tail: CENTER
t distribution
when we standardize based on the sample standard deviation, sx
-t tells us how far x̄ is from the mean μ
-symmetric w/ 1 peak at 0
-more area in tail (a bit more spread out)
degrees of freedom (df)
there is a different t distribution for each sample size
df = n - 1
!!! population distribution (for mean) not normal → statistic has approximately a tn-1 distribution if the sample size is large enough
incr df (by incr n), shape of t distribution looks closer to standard Normal distribution AND t* closer to z* (roughly approximate each other)
t* → don’t need to know population standard deviation σ (z* does) (why we use t* usually for pop. mean)
t* and z* both critical values (pop mean; pop proportion)
how to get t*
[2nd] [stat] invT
^area is area to the left of the critical value (if C% confidence interval and c is the decimal, then do (1-c)/2)
^df is n-1
t* acts same as z* except it is for constructing confidence intervals for population mean μ
Conditions to check before calculating confidence interval for μ (population mean)
Random (well-designed random sample or randomized experiment)
10% condition (n≤0.1N)
Normal population distribution OR n≥30 OR no strong skewness/outliers of graphed sample data (even if n<30) (at least 1 true so can use t interval for μ) (ex: even if graph of sample data is skewed/has outliers, ok to use t interval if large enough sample size)
^DON’T use t procedures if strong skew/outliers and other two possibilities not true
^don’t use t* critical value if not abt pop. mean; not a random sample; n<30 & distrib of sample data is strongly skewed/has outliers
standard error of sample mean
use sx b/c don’t know σ
how to get confidence interval of μ
x̄ is statistic
t* is critical value based on C% level
sx is sample standard deviation
n is sample size
-right side of formula is M.o.E.
—if given data, plug into stat list, then do [stat] ‘calc’ 1-VarStats to get x̄ and sx
![<p><span>x̄ is statistic</span></p><p><span>t* is critical value based on C% level</span></p><p><span>s</span><sub><span>x</span></sub><span> is sample standard deviation</span></p><p><span>n is sample size</span></p><p><span>-right side of formula is M.o.E.</span></p><p><span>—if given data, plug into stat list, then do [stat] ‘calc’ 1-VarStats to get x̄ and s</span><sub><span>x</span></sub></p>](https://knowt-user-attachments.s3.amazonaws.com/60e49788-89d8-4218-aa19-167c68b5be34.png)
how to find sample size n for pop. mean
use z* (find w/ invNorm) b/c t* relies on knowing sample size n
given M.o.E. (not a proportion (ex: can be 1), plug as is) and SD
round to nearest whole #
flow chart for margin of error of population mean and when to use what
don’t know σ
use t* times sx/√n
know σ
n≥30 → use z* times σ/√n ← use to find n !
n<30 → use t* times σ/√n
how to find confidence level w/ pop. mean
(idk if will use or not)
[2nd] [vars] tcdf
lower is -t*, upper is t*, df is n-1
^only add 1 SE means critical value of t* = 1
how to make margin of error/confidence interval narrower
lower C% confidence level
larger sample size n