Lecture 11 - Confidence and Metacognition I
1/36
There's no tags or description
Looks like no tags are added yet.
Name | Mastery | Learn | Test | Matching | Spaced | Call with Kai |
|---|
No analytics yet
Send a link to your students to track their progress
37 Terms
In the Gaussian case, how do the prior, likelihood, and posterior relate?
the posterior is sharper (more precise) than both the prior and likelihood
combination is more precise
the mean of the posterior lies between the means of the prior and likelihood
a form of average of prior and likelihood but shifted towards more precise signal
the posterior mean shifts toward the distribution with higher precision (smaller variance)
What is the key intuition behind the posterior in Bayesian inference?
the posterior combines prior beliefs with evidence AND when one source (prior or likelihood) is more precise, the posterior is biased toward it
What is different between the brain combining info at one process vs. multi-sensory?
in both:
combining prior info with a likelihood to obtain the posterior
→ in multi-sensory integration, you can think of one modality as being the prior
e.g. McGurk Effect
visual cue, auditory cue, you combine them to reach a perception that is in between
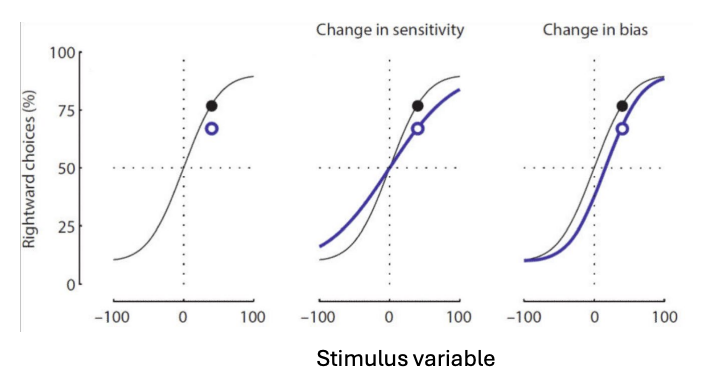
What does the psychometric curve quantify? How does the graph change for changes in sensitivity vs. bias?
curve allows us to quantify the relationship between stimulus and perception
changes in threshold/shifted curve (bias/range of sensitivity)
changes in slope (sensitivity/noise within that range)

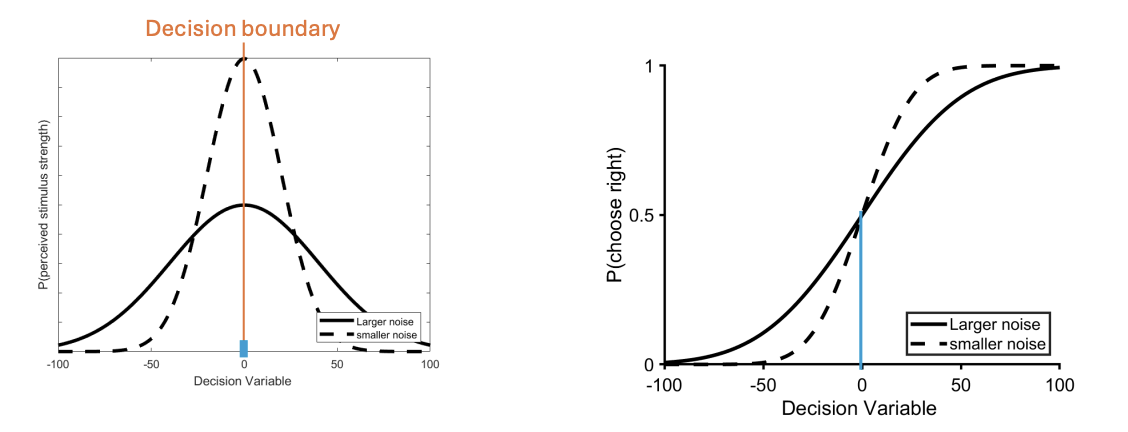
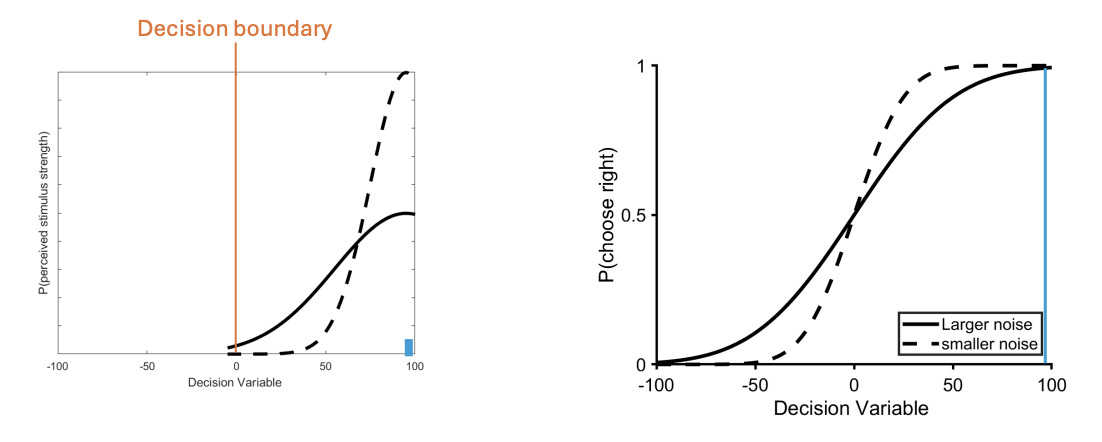
What does this model represent?
on a given instance of the stimulus (x)
subject perceives a noisy sample of stimulus (x^)
stimulus distance from boundary controls the difficulty (closer to boundary = more difficult vs. further from boundary in one direction = easier)
noise (o) controls precision of the perception
wider curve = more errors as more samples fall on the incorrect side of the decision)
What 2 things is accuracy of perception controlled by?
position of original stimulus
the noise
How does changing the bias affect the psychometric function?
leads to offset in curve/shift and no change in slope
How does changing the noise/sensitivity affect the psychometric function?
changes slope of curve
smaller noise leads to a steeper psychometric function
more noise = less steep function
If stimuli has zero evidence, what effect does it have on noise?
For stimuli (blue bar) with zero evidence, both noise conditions lead to similar accuracy (50%)
50/50 chance of choosing either side
If stimuli has some evidence (25%), what effect does it have on noise? Explain what this looks like on graphs.
for stimuli with some evidence, the low noise condition is more accurate as it is less likely that perception falls on the incorrect side of the decision boundary
area of dashed curve (less noise) to the left of boundary is smaller than area of plain curve (more noise)
accuracy is higher for low noise condition when plotting psychometric curve
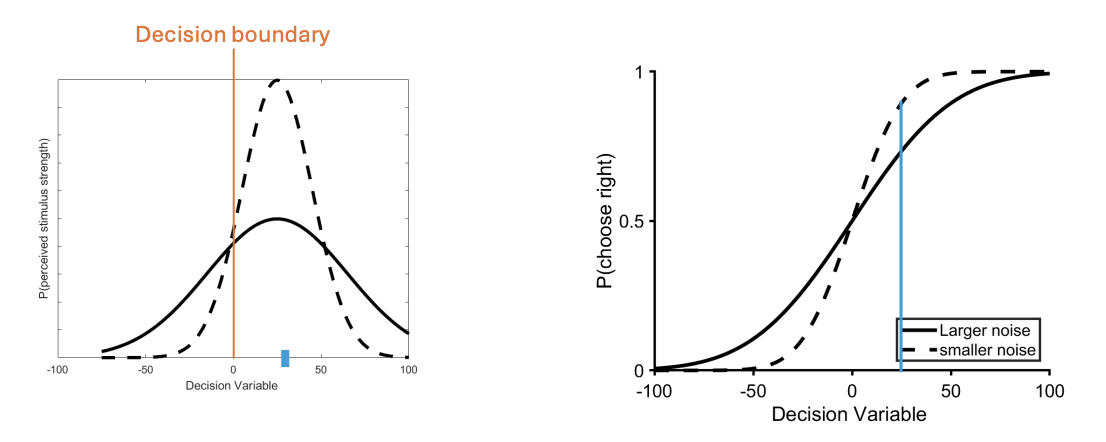
If stimuli has some evidence (50%), what effect does it have on noise? Explain what this looks like on graphs.
for stimuli with some evidence, the low noise condition is more accurate as it is less likely that perception falls on the incorrect side of the decision boundary
area of dashed curve (less noise) to the left of boundary is smaller than area of plain curve (more noise)
accuracy is higher for low noise and we’re almost always choosing correct decision
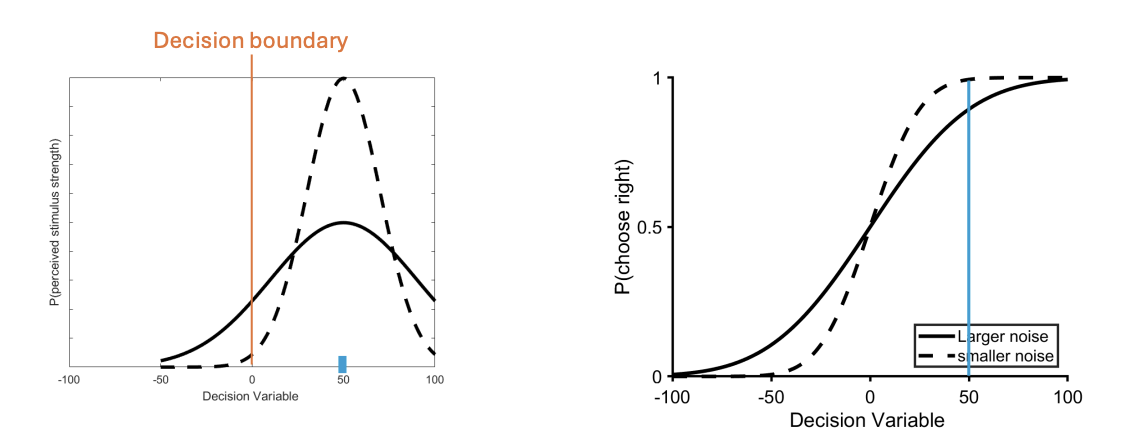
If stimuli has strong evidence (95%), what effect does it have on noise? Explain what this looks like on graphs.
with very strong evidence (95%) behaviour eventually reaches near perfect accuracy for both conditions
How can the psychometric curve determines changes in noise/sensitivity?
smaller noise leads to a steeper psychometric function
What are two similar computations involved in info combination?
combining a prior with a likelihood to get a posterior
combining two sensory streams (multi-sensory integration) to get a posterior
In multi-sensory integration, how can one sensory modality be interpreted in Bayesian terms?
one modality can act as the prior, while the other acts as the likelihood
the brain merges them to form the most reliable posterior perception
What optic flow? What is it important for?
looks like dots/snow coming towards you
involves area MT
using this to ask whether the participant is pointing at direction of motion or off direction of motion
important for role of motion integration
What brain areas does optic flow involve?
area MT and related area medial superior temporal area (MST)
What experiment can we use to integrate vestibular and visual info?
using optic flow
monkey on motion platform
monkey sees optic flow but platform also rotates in direction of motion or against
platform and visual direction are either aligned or not
understand how the brain combines vestibular (inner ear motion) and visual (optic flow) cues to perceive self-motion and heading direction
What occurs to the integration of vestibular and visual when we lesion the vestibular system?
no sense of balance or sense of rotating and lesion is contained to vestibular
but maintain visual ability of task
use only the visual info to perform the task
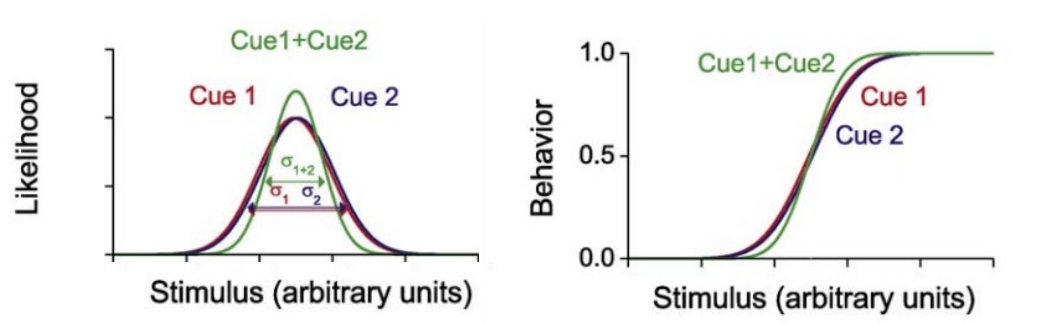
What are 2 example of statistical computations to integrate cues?
cues are coherent with each other so both streams of info tell you same thing
precision improves
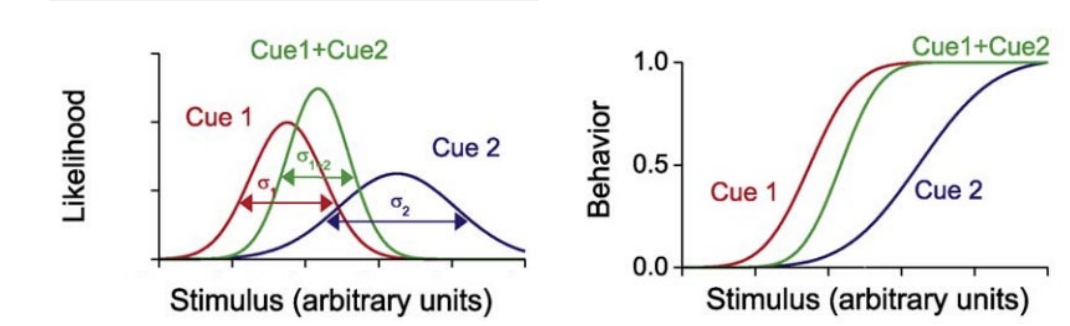
cues are not telling you same thing and you have to combine them together
integrate conflicting info to obtain optimal estimate
What occurs when the two cues provide the same information?
when you combine the 2 cues, the combined estimate in more precise
combined modality psychometric curve is steeper than single modality
What occurs when the two cues have conflicting information?
the mean of the joint estimate is a weighted sum of the single modality estimates (biased to more precise cue)
reduction in the uncertainty of the joint estimate
joint estimate has a new equivalence point with relative precision of the single modality cues
reduction in uncertainty of the joint estimate (combined modality) also leads to a steeper psychometric curve that is biased to one cue
How can apply this confidence and decision making to a hierarchy like we saw for the visual system?
can be applied to hierarchical networks where the posterior of one layer becomes the likelihood and/prior of next layer
What is the hierarchical Bayesian inference for reading?
levels of expectations when reading
sensory (what is the shape) (w)
letter level (w)
word level (went)
sentence level (Jack and Kill went up the hill)
meaning level
we make inferences at each level
bottom up (sensory to meaning) and top down (expectation)
What is hierarchical Bayesian inference for visual system?
low level vs high level inference
seeing what you expect (prior is strong) → ‘see what you expect to see’ (not enough likelihood and perception is dominated by prior)
ambiguous info but strong likelihood and sensory → ‘expect what you see’ (driven by sensory info)
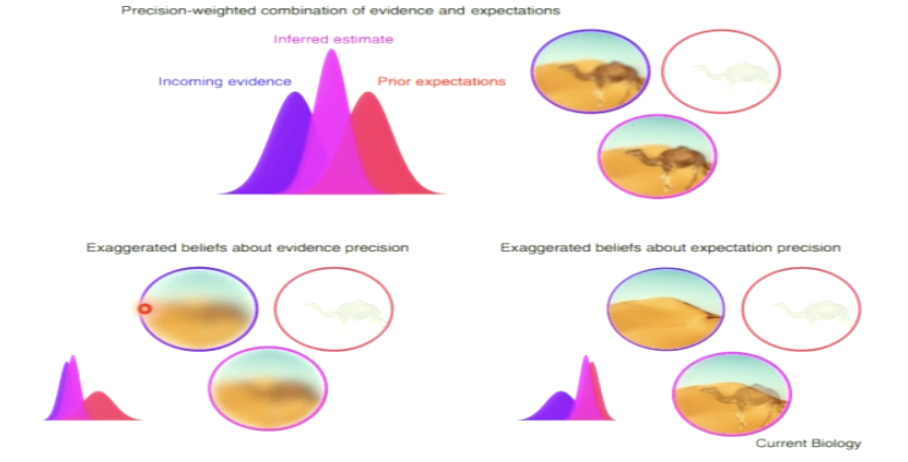
How can we model hallucinations like the ‘light from above’ illusion?
driven by low level priors changing our perception
prior is much stronger to it biases perception
cannot control this
How can we model ‘headache’ illusion
high level priors can have more complex effects
hierarchical processing of perception can lead to hallucinations when top-down expectations (priors) outweigh bottom-up sensory input
Explain: Believing what you see and seeing what you believe?
for visual, we combine our incoming evidence with prior expectations
Why do we use this probabilistic computations?
allows us to estimate confidence
‘if you are really not sure floor is solid, you won’t walk on floor’
combine info and determine if you can rely on previous information
What is active inference? Use example of cheetah and zebra.
sensory perception is not a passive process
our eye movements are not random
looking in bush and see either zebra (safe) or cheetah (dangerous)
need to collect more samples in order to determine what animal it is
What happens when people have 3 mins of free examination of painting?
free examination = gaze looks a lot at faces
what is the age of people = gaze looks at faces
how long has visitor been in hallway = gaze at visitor, kids, etc.
perception is not random, changes based on task
active inference relies on having a model about the scene
What is confidence? What is certainty/uncertainty? What is metacognition?
how certain we are that action is correct one
the degree/probability of belief in a quantity
cognition about cognition, ability to self reflect on thoughts and actions
What is prospective judgment and retrospective judgment?
prospective: judgment before the choice
how well will you do in the test?
retrospective: judgment after the choice
how confident are you that the choice is correct
What is an explicit vs. implicit measure?
explicit = direct measure of confidence estimate
how well did you do on the midterm (ask directly)
implicit = behavioural measure that correlates with confidence estimates (amount of betting on something usually means increases confidence)
Do we use confidence judgments for different types of decisions?
yes!
we build similar uncertainty representations for decisions in different domains
e.g. when is Shakespeare’s birthday
confidence judgment combine prior expectations or knowledge and a choice or an action
e.g. soccer ball in net
What is relationship between uncertainty and confidence?
we have this estimate of uncertainty and it can arise from many different sources (memory based, skill based, general knowledge) and then given that uncertainty computations we choose what is the probability that it is right or left
having computed that measure of confidence, we can use it for something else like communication (convey to others how sure we are)
need to build estimate in order to do behaviour properly
What is the feedback loop for confidence and behaviour?
after producing behaviour it updates our propositional confidence
e.g. high confidence about something, do it: fail, do it: fail, etc. updates confidence to lower it