Spatial Data Science and Maps Final Exam
1/248
There's no tags or description
Looks like no tags are added yet.
Name | Mastery | Learn | Test | Matching | Spaced |
|---|
No study sessions yet.
249 Terms
First Paradigm
Measure phenomena to establish relationships
First
Newton’s light experiment is an example of the _____ paradigm
First Paradigm
Experimentation: observation and measurement
Second paradigm
Use theory to explain systems (even before data exists
Second
The Theory of Relativity is an example of the _______ paradigm
Second Paradigm
Analytical theory: derive/explain with equations
Third Paradigm
Numerical simulation: compute and forecast
Third Paradigm
Use computing to simulate and forecast
Third
Flight Simulator is an example of the ______ Paradigm
Fourth Paradigm
Data-intensive discovery: from large, rich data to new insights
‘The End of Theory’ Argument
With the availability of very rich data that comprehensively describes a given situation, it becomes possible to discover explanations that make sense of/explain our observations
John Snow’s Cholera Map
The Origin of Spatial Analysis and
Spatial Data Science
Geospatial Data Science
Utilizes geographic knowledge and AI approaches to extract meaningful insights from large-scale spatial data.
Geospatial problem specification
Define a clear and testable geographic question, explain its significance, and situate it within broader societal or scientific contexts.
Geospatial data collection & management
Acquire and integrate multi-source geospatial big data, documenting metadata, spatial units, scale and resolution for analysis
Spatial analysis and modeling (with GeoAI)
Develop geocomputational / GeoAI methods on large-scale geospatial data to model geographic phenomena, make predictions, and generate predictive insights
Geovisualization and map-making
Design effective visualizations to communicate results intuitively, facilitate interpretation, and support decision-making to promote communications with diverse audiences
Conclusions and implications for society and
policy
Translate findings into actionable insights by highlighting how environmental factors shape our world to guide future policy actions and better manage risks
Geospatial problem specification
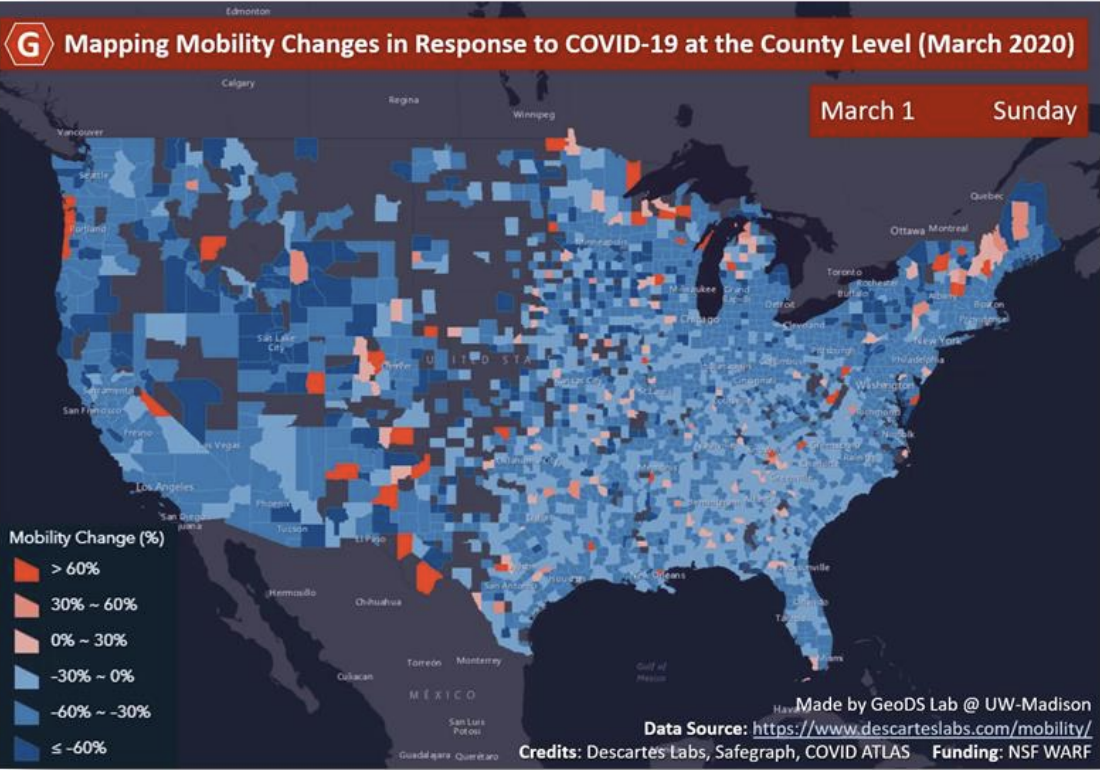
What are human behavior changes in response to COVID-19?
What factors influence the spread of COVID-19?
What implications can be inferred for policy decision-making?
Human mobility variables
Stay-at-home variables
Socioeconomic variables
Geospatial data collection & management
SafeGraph dataset
States, counties, census tracts
Spatial analysis and modeling (with GeoAI)
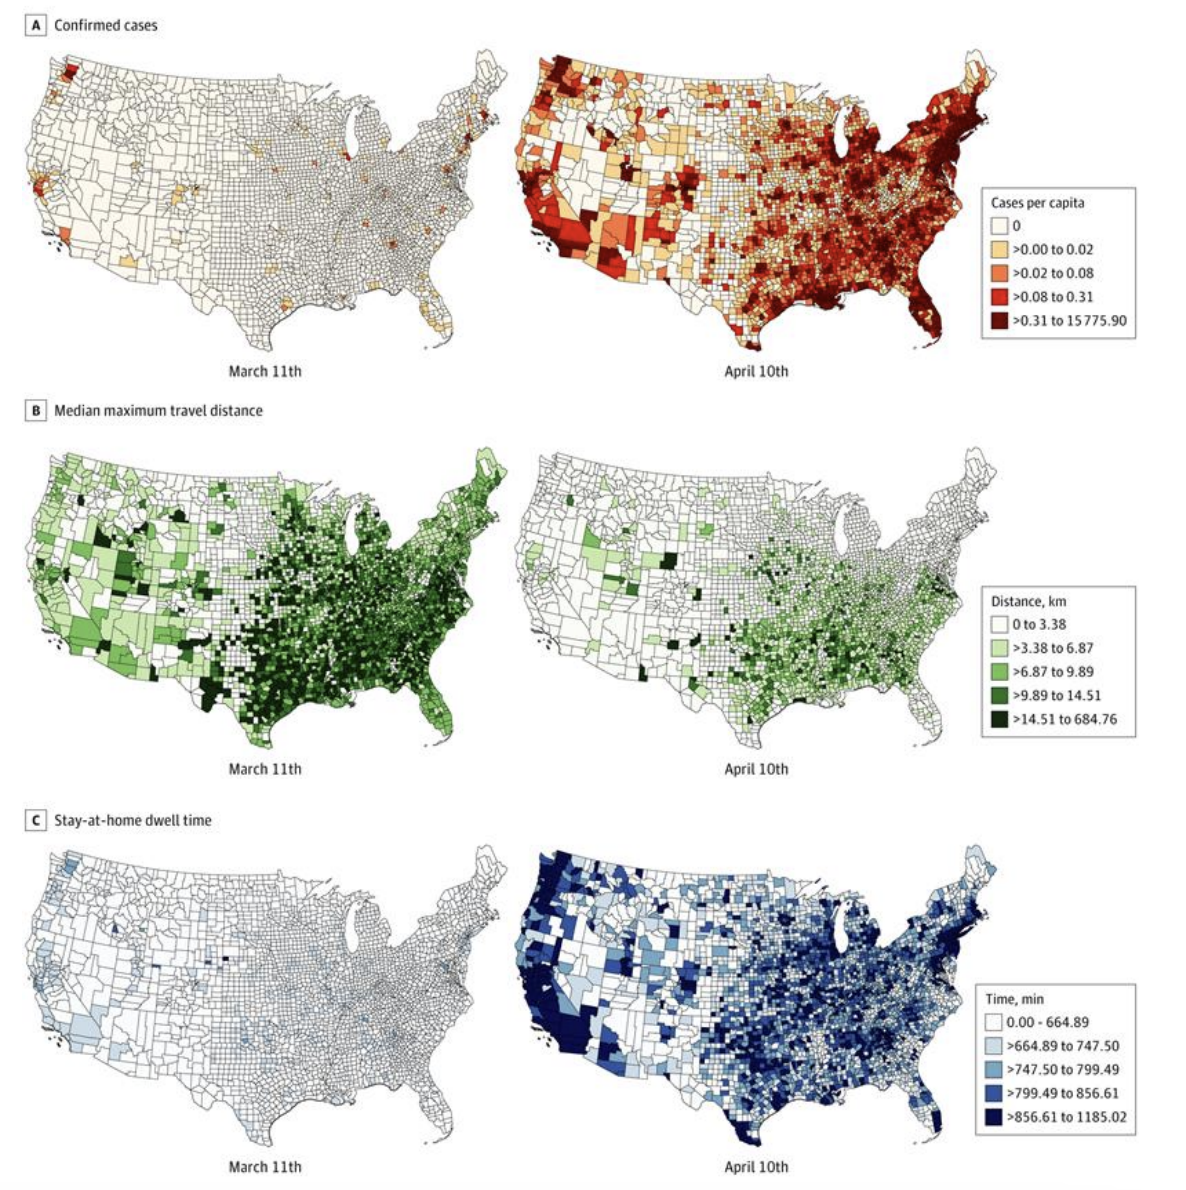
Geovisualization & map-making
Conclusions & implications for society & policy
Stay-at-home mandates were associated with the reduced spread of COVID-19 when they were followed
Policy makers need to take spatial heterogeneities (e.g., age, race) into account
Absolute Location
The place where something is located
Absolute Location
Latitude: 33.996, Longitude: -81.026
Absolute Location
“At the fountain in front of UT Tower”
Relative Location
The location of something in relation to others
Relative Location
“My office locates at the RLP building, next to the WCP building”
Relative Location
“I am driving into Austin on I-35, about 10 miles out”
Space Location
highlight geometrics (positions, shapes, distances), machinereadable
Space Location
A building is represented as a polygon
Place Location
space + meaning/experience, human-like
Place Location
Home vs. house
Cartographic Scale
The ratio of a distance measured on a map to the corresponding distance on the ground
Cartographic Scale
Representative fraction (RF) = map distance:ground distance (most maps between 1:1 million and 1:1000
Analytical Scale
Resolution = your measuring stick
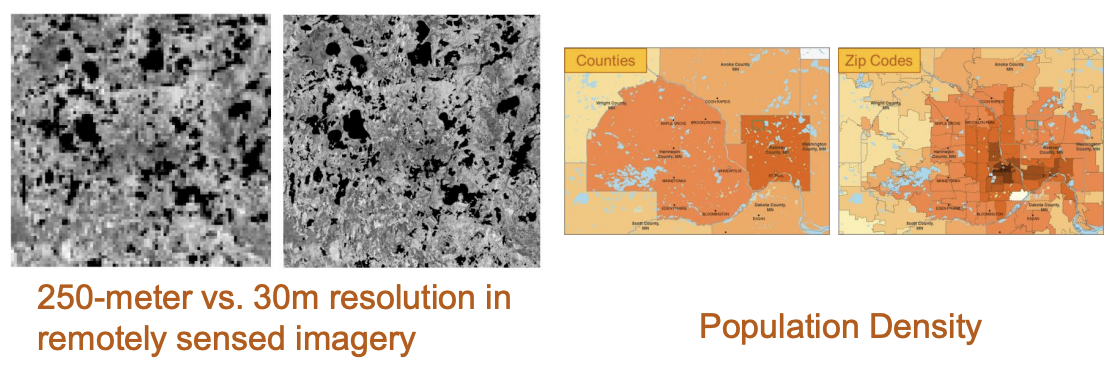
Spatial Resolution
The grain of measurement (1 meter, 1 km)
Temporal Resolution
interval size (1 minute, 1 hour)
Spatial Resolution
“What kind of area is being reported?”
Temporal Resolution
Refers to how often a system records data (imagery) in same area
Most often, it means orbit repeat cycles
Some systems have fixed, some not
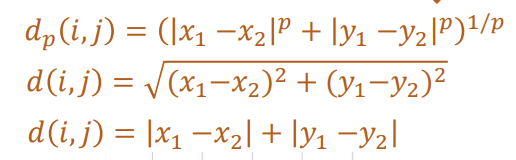
Cost Distance
the notion of an alternative family of distance metrics
Planar distance
Euclidean distance (p=2)
Manhattan distance (p=1)
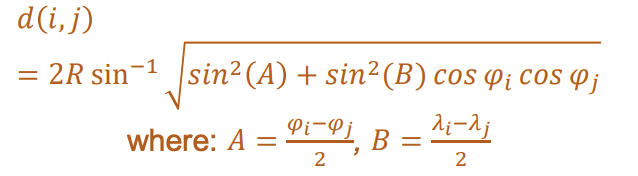
Geodesic Distance
R is the radius of the spherical Earth (e.g., 6378.137 kms)
𝜑𝑖 and 𝜑𝑗 refer to latitude
𝜆𝑖 and 𝜆𝑗 refer to longitude
Distance Decay
The interaction between two locales declines as the distance between them increases
Topology
geometric properties that do not change with shape: adjacency (touches), connectivity, containment
Vector Data Models
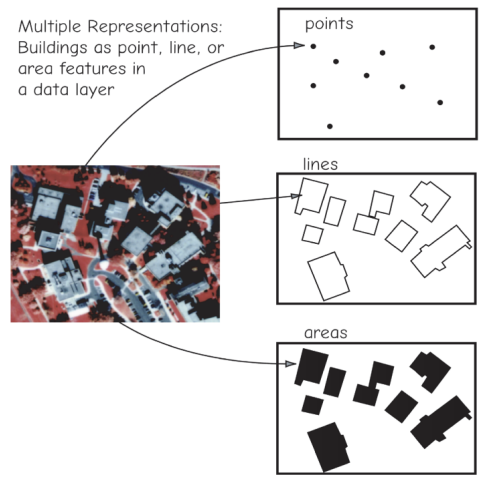
Vector Data Models
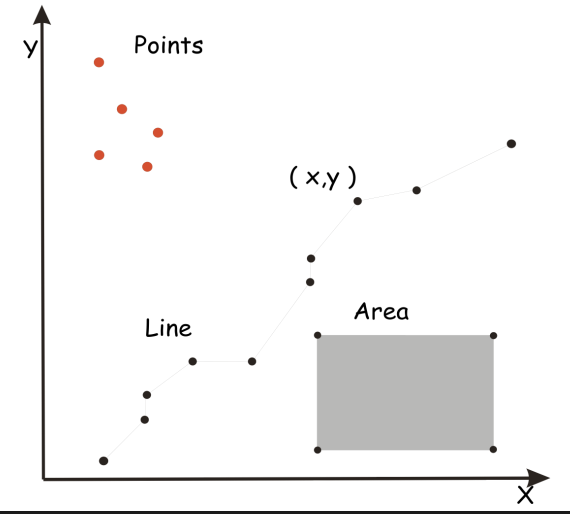
Vector Data Models
Data structure: usually complex
coordinate conversion: simple
analysis: preferred for network analyses
spatial precision: limited only by positional measurements
display and output: maplike, with continuous curves, poor for images
Raster Data Models
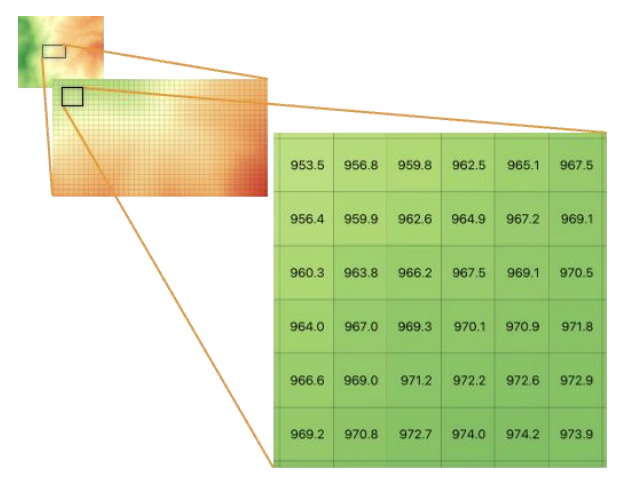
Raster Data Models
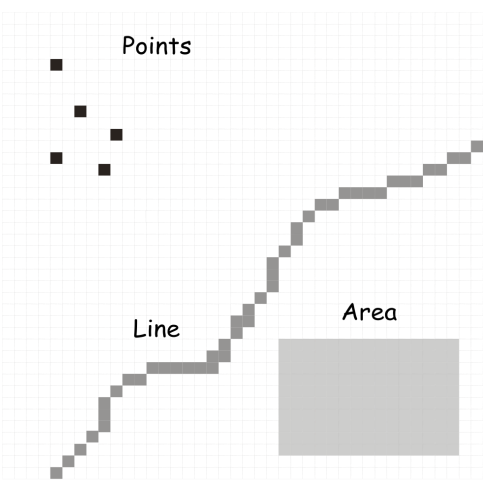
Raster Data Models
data structure: usually simple
coordinate conversion: may be slow due to data volumes, and require resampling
analysis: easy for continous data, simple for many combinations
spatial precision: floor set by cell size
display and output: good for images, but discrete features may show “stairstep” edges
Raster Data Models
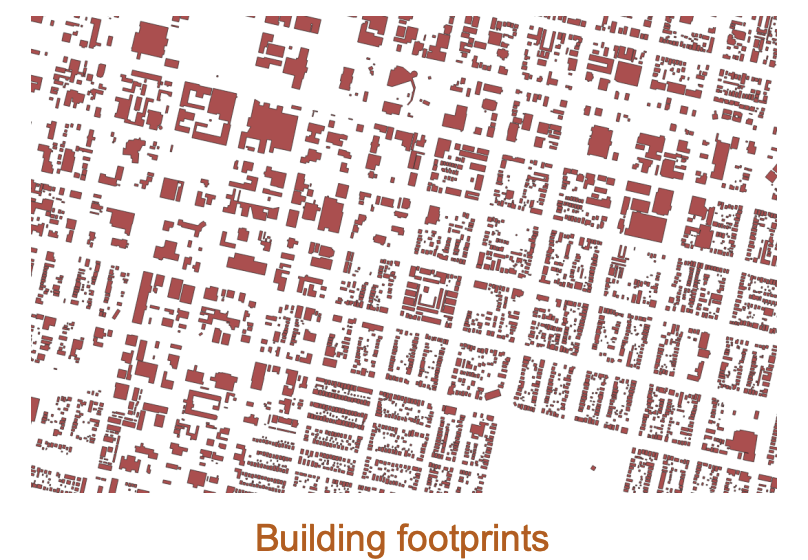
For the geographic pattern shown below, which data model is more appropriate: Vector or Raster?
Vector Data Models
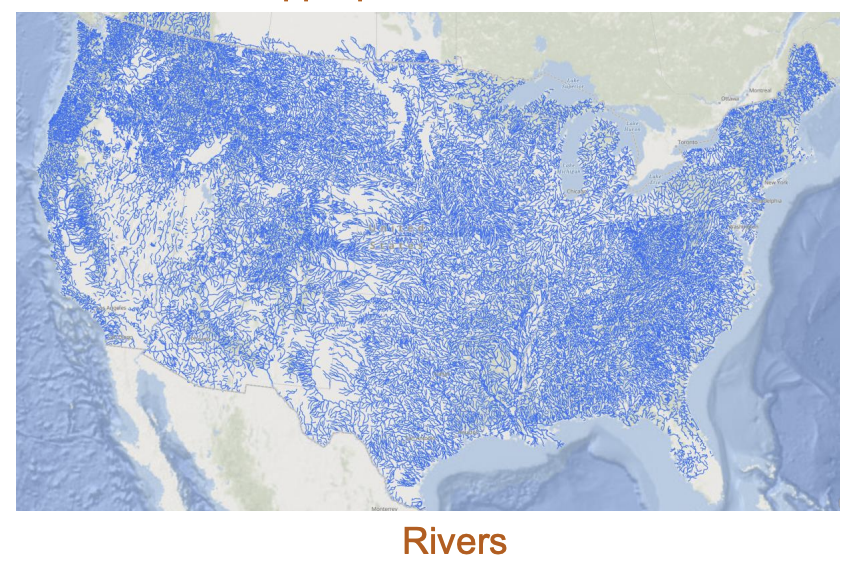
For the geographic pattern shown below, which data model is more appropriate: Vector or Raster?
Raster Data Models
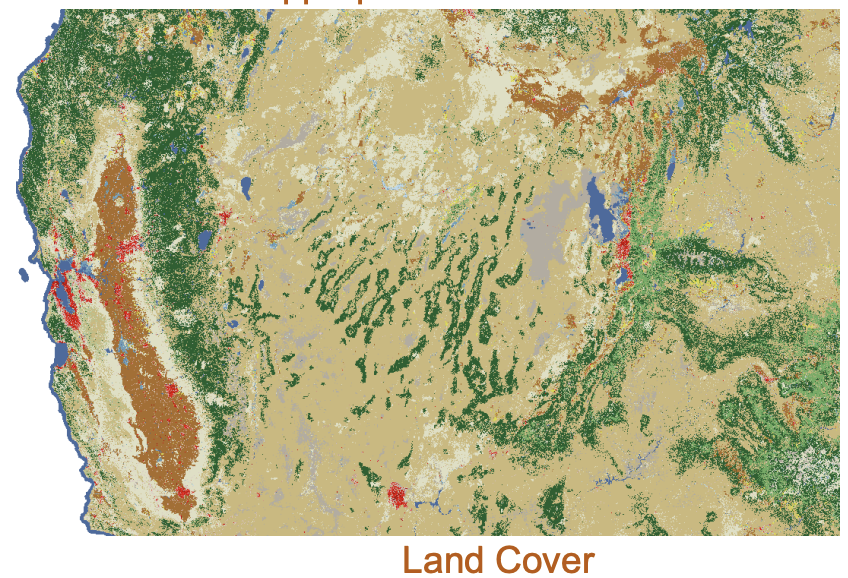
For the geographic pattern shown below, which data model is more appropriate: Vector or Raster?
Vector Data Models
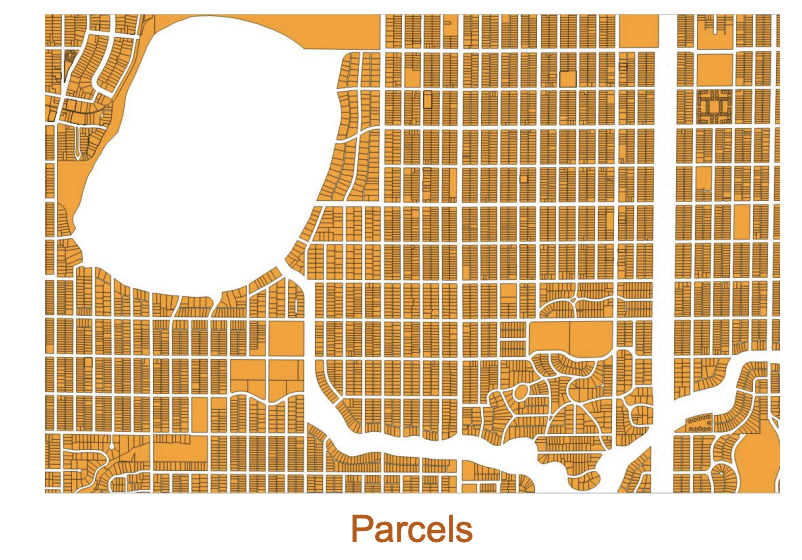
For the geographic pattern shown below, which data model is more appropriate: Vector or Raster?
Vector Data Models
For the geographic pattern shown below, which data
model is more appropriate: Vector or Raster?
Raster Data Models
For the geographic pattern shown below, which data model is more appropriate: Vector or Raster?
Vector Data Models
For the geographic pattern shown below, which data model is more appropriate: Vector or Raster?
Nominal
When values vary in name
Categorical (labels)
No ordering/ranking information
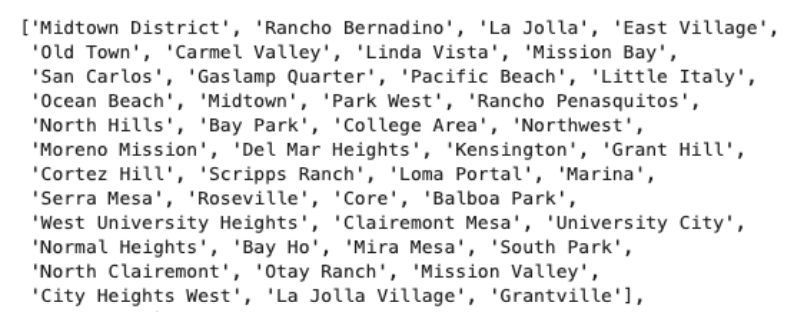
Nominal
The “neighborhood” variable
Ordinal
When implied rank order
Categorical <-> quantitative
Can be compared
No ‘how much’ information in between (no +/-)
Ordinal

Interval
When values can be compared by gaps
quantitative
measured along a numerical scale
equal intervals (can +/-)
no “true zero”
zero is not the lowest
×/÷ makes no sense
Interval
“Temperature: 80°is 60°warmer than 20°but is not four times as warm”
Ratio
When values can be compared by taking proportions
quantitative
measured along a numerical scale
equal intervals (+/-/×/÷ applicable)
“absolute zero”
most spatial data
Ratio
U.S. Population Density: Nominal, ordinal, interval, or ratio?
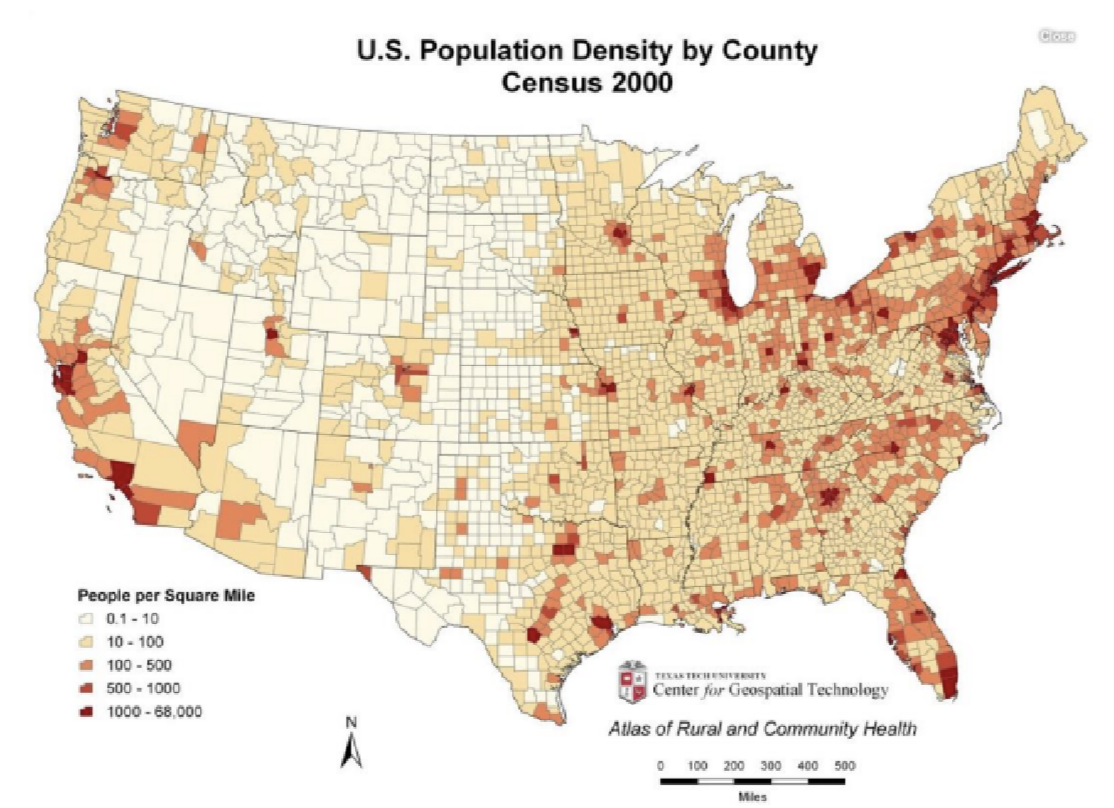
Nominal
Landcover class: nominal, ordinal, interval, or ratio?
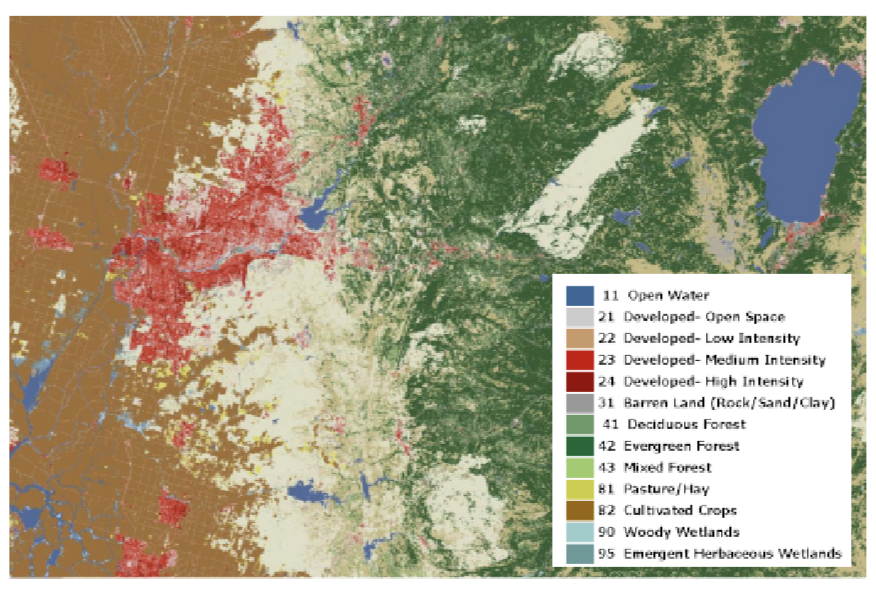
Ordinal
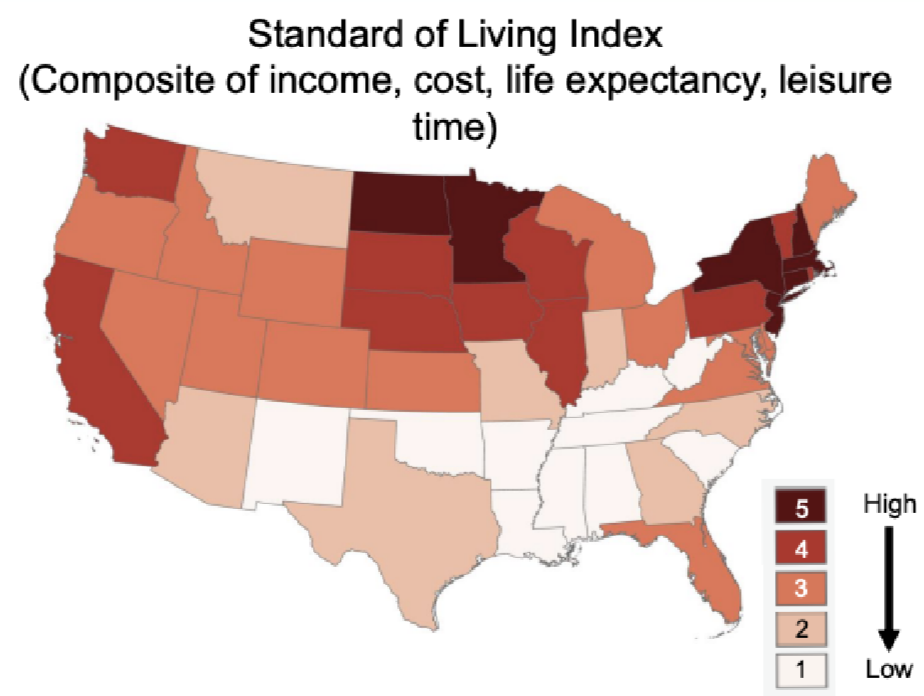
Nominal, ordinal, interval, or ratio?
Primary Data
First-hand data
More reliable
Control over collection method
Time and cost intensive
Secondary Data
Second-hand data
Comparatively less reliable
No control over collection method
Time and cost effective
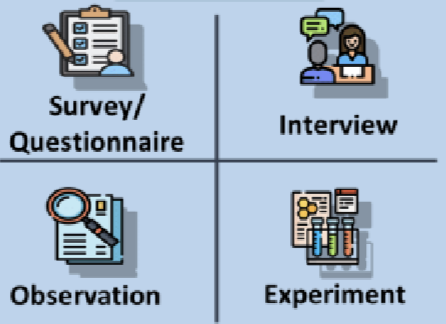
Primary Data
Data Collection Method
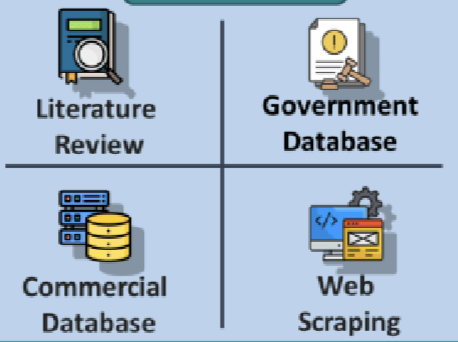
Secondary Data
Data Collection Methods
User-generated content (UGC)
content produced by users and made publicly available on the platform
User-Generated Content (UGC)
can be utilized to capture public opinions and further be leveraged to understand place-based contexts and sociocultural perceptions
can be produced in an economical yet effective manner, and individuals as sensors largely expand the data coverage within cities
User-Generated Content (UGC)
Examples: social media posts, crowdsourced GPS trajectories, smart-card and cell phone-based location data
User-Generated Conetn (UGC)
Ethical considerations: bias, geoprivacy, licensing/copyright, varying data quality
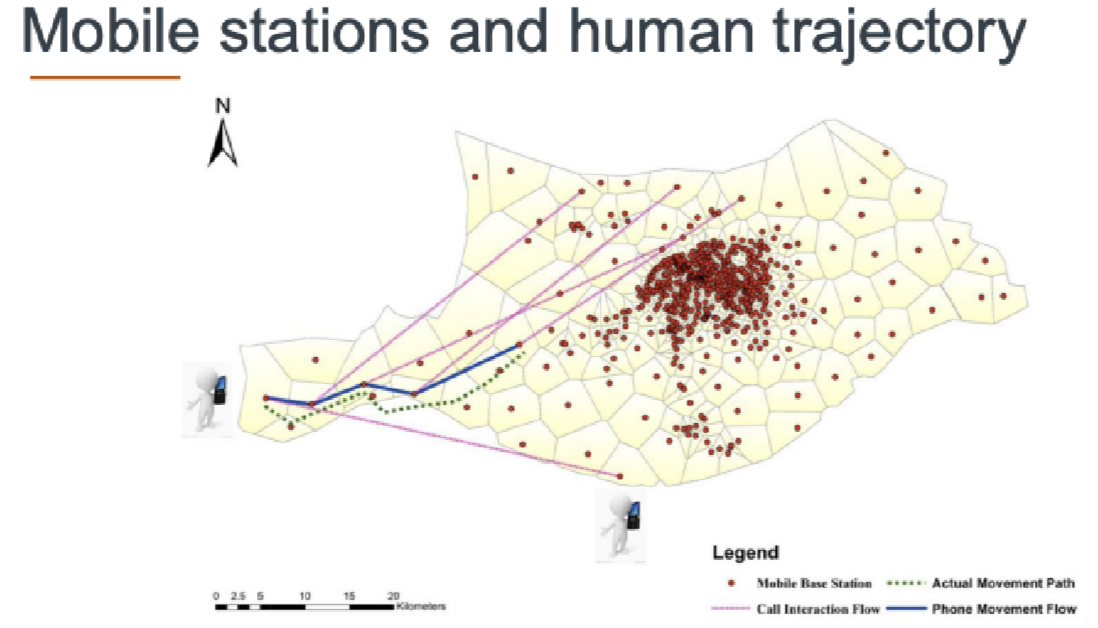
Cell Phone Data
has been widely used to monitor human mobility patterns
Cell Phone Data
Common information: device counts, OD flows, distance traveled, stay-at-home share, dwell time
Cell Phone Data
Uses: commuting patterns, resilience, disaster response, epidemiology
Cell Phone Data
Ethical issues: geographic coverage, sampling bias, geoprivacy; analyze at appropriate scale
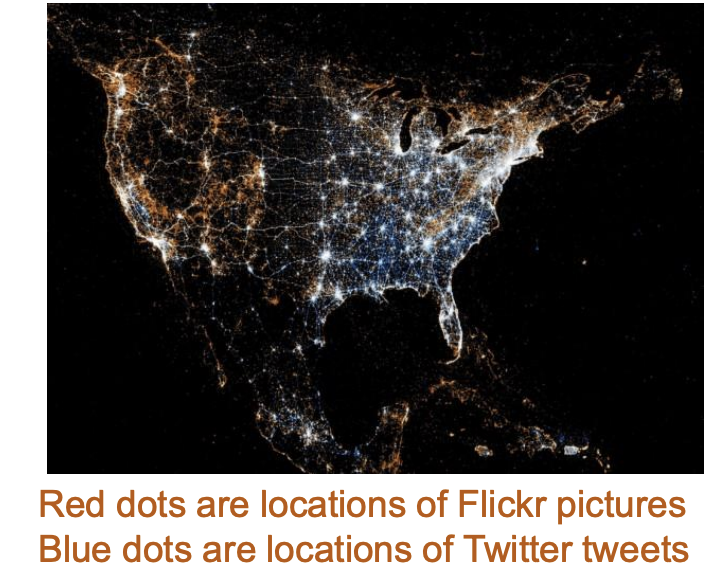
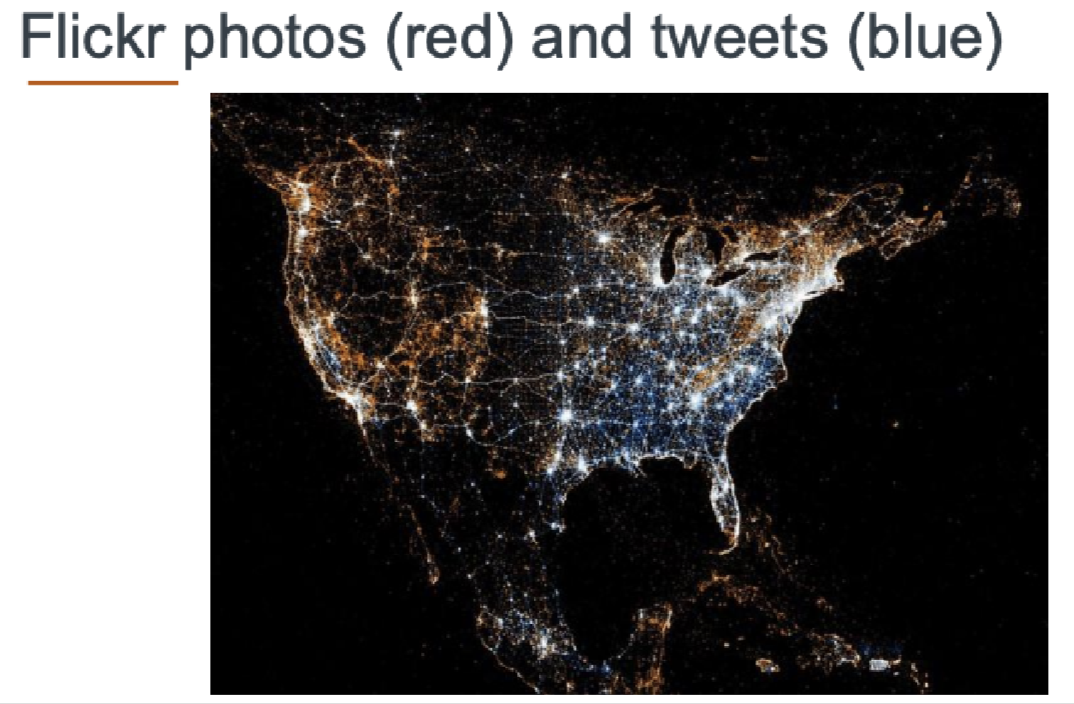
Geotagged Social Media Data
GPS-assigned social media posts: texts, photos, videos
Geotagged Social Media Data
Notable platforms: Twitter/X, Flickr, Facebook, Yelp, Youtube, …
Geotagged Social Media Data
Ethical issues: small rate, bias and representativeness, geoprivacy
Geotagged Social Media Data
Cell Phone Data
Trajectory Data
ordered (x,y,t) sequences from devices/vehicles
Trajectory Data
Measures: speed, stop/move, route choice, accessibility
Street-View Imagery
Represent real-world scenery including natural scenes and man-made landscapes from a pedestrian perspective and allow users to navigate the realistic streetscape remotely
Characteristics:
High Coverage and Volume
Relatively Low Data Bias
Cost-effectiveness and time-effectiveness
Eye-level Scenery
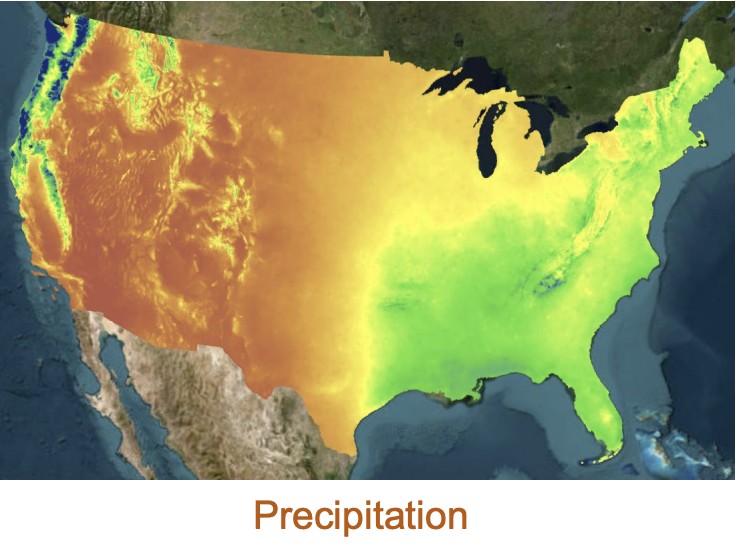
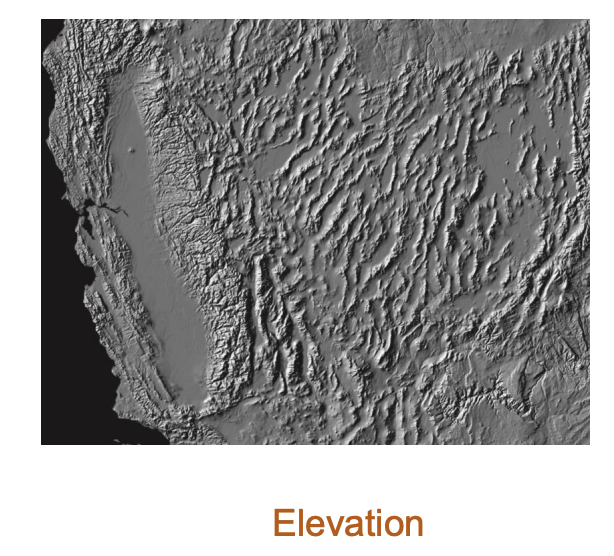
Remote Sensing Imagery
Measuring Earth’s surface without contact using sensors on satellites, aircraft, drones, or ground platforms
Remote Sensing Imagery
Characteristics: consistent, repeatable observations over large areas and long time periods for environmental and urban analysis
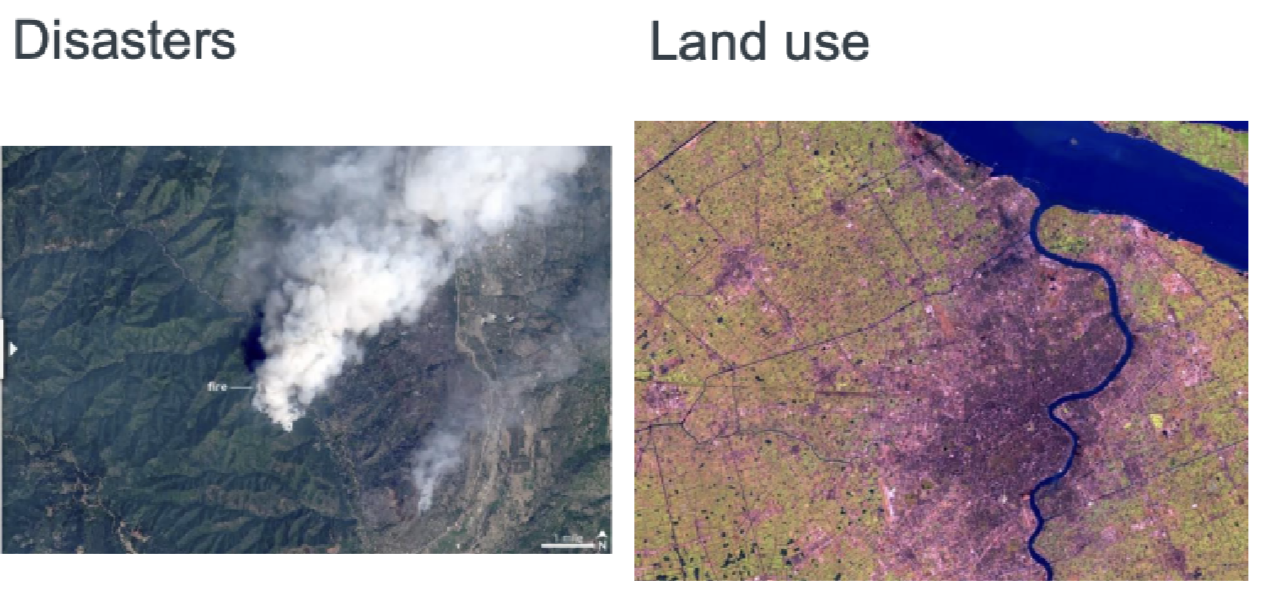
Remote Sensing Imagery
Uses: land cover & change, heat islands, flood mapping, vegetation health
Remote Sensing Imagery
Volunteered Geographic Information
Geospatial content generated by non-professionals using mapping systems available on the Internet, offers possibilities for government agencies at all levels to enhance their geospatial databases
Volunteered Geographic Information
Characteristics: rapid updates, local knowledge, wide coverage, supports public/private operations
Volunteered Geographic Information
Citizens create/edit maps (e.g., OSM)
Broad, timely coverage
Local knowledge
User-Generated Content
Broader umbrella (includes social media, app logs)
People may not intentionally generate data
Tobler’s First Law of Geography
Everything is related to everything else, but near things are more closely related than distant things
Correlation
A statistical measure (expressed as a number) that describes the size and direction of a relationship between two or more variables
Correlation
does not automatically mean that the change in one variable is the cause of the change in the values of the other variable