5.5 Break-even analysis
1/5
There's no tags or description
Looks like no tags are added yet.
Name | Mastery | Learn | Test | Matching | Spaced | Call with Kai |
|---|
No analytics yet
Send a link to your students to track their progress
6 Terms
Contribution
the sum of money that remains after all direct and variable costs have been taken away from sales revenue
Contribution per unit
The proportion of the selling price for each unit of product that will go toward paying off total fixed costs
Total contribution
The quantity of product needed to go towards paying off total fixed costs
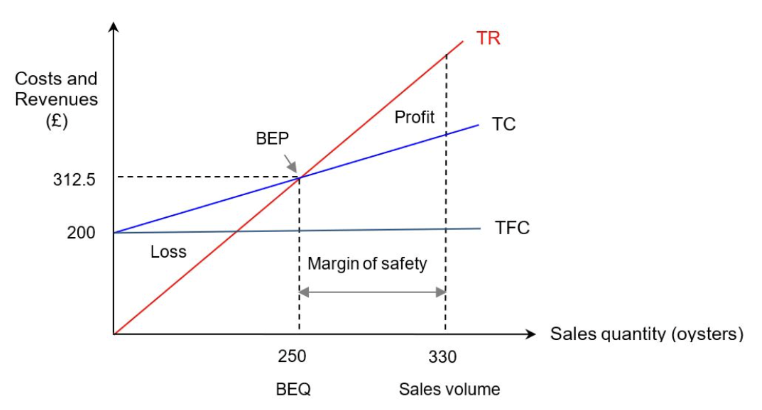
Break-even chart
x-axis : Sales quantity, y-axis : cost and revenue
Target profit quantity
(Fixed cost + Target Profit) / (Price - Average variable cost)
limitations of break-even chart as a decision making tool
Involves assumptions that:
All cost functions are linear
Sales revenue function is linear
All output will be sold
Not useful to a dynamic business environment due to its static nature.
Ignore other quantitative and qualitative factors.