MACRO EXAM 1 (prep from slides)
1/200
Earn XP
Description and Tags
CHAPTERS 2, 3, 4,5,6,7,8,9,10,11
Name | Mastery | Learn | Test | Matching | Spaced |
|---|
No study sessions yet.
201 Terms
Economics
focuses on the behavior and interactions of economic agents.
The study of choices “in the ordinary business of life”
toolkit to understand your decisions and the decisions of others
Microeconomics
Studies individual decisions (consumption, production, etc)
Macroeconomics
Studies aggregate economic phenomena ( Economic growth, inflation, etc)
Cost- Benefit Principle
Compare the costs and benefits of a choice
Choose only if the cost is less than the benefits
This choice generates economic surplus
Willingness to pay
The most I am willing to pay reveals the benefit of the choice
Opportunity Cost
The next best alternative you have to give up to get it
Marginal Benefit(MB)
The extra benefit from one extra unit
Marginal Cost(MC)
The extra cost from one extra unit
Economic surplus
If something is worth doing, keep doing it until your marginal benefits is at least as large as your marginal costs.
Interdependency Principle
Your choice depends on everything and everyone else
Between your individual choices
-Buy a new car — eat out?
Between economic actors
- Buy a white SUV— one less white SUV left for others
Between markets
- Gas price (increases) —> EV?
Through time
- Buy a car now? Next year?
Diminishing MB
MB of each additional unit is smaller than MB of previous unit
Law of demand
The tendency for quantity demanded to be higher when price is lower.
Higher price —> lower quantity demanded
Demand curve
shows how many units I buy for each level of price
Marginal benefit curve shows MB associated with each quantity
Price equals
Marginal benefits ( rule makes them identical)
Downward-sloping demand curve
Reflects diminishing marginal benefit
Law of demand: the tendency for quantity demanded to be higher when the price is lower.
Price change
Causes a movement along the demand curve
Shift in the demand curve: Think about demand for ice cream
What will happen if price falls?
What if temperature rises?
If prices fall or temperature rises, the demand curve shifts to the right. Buy more ice cream at the same price
Shift in the demand curve: Think about demand for ice cream.
What will happen if the temperature falls?
If the temperature falls, the demand shift left, and people buy less ice cream at the same price.
What are Key demand shifters?
Income
Preferences
Price of related goods
Expectations
Congestion and network effects
The type and number of buyers
Demand shifters: Income
In general, quantity demanded for each price(increases) when income(increases)
Demand curve shifts to the right as income (rises)
Normal goods
A good for which higher income causes an increase in demand
Inferior good
A good for which higher income causes a decrease in demand
Examples: Fast-food meals, non-organic fruits and vegetables
Demand shifters 2: Preferences
Changes in your preferences can shift your demand curve
Example:
life altering event
marketing, influencers, and fashion cycles
social pressure
Season/Weather
complementary Goods
Go well with each other.
When the price of one good (increases), the demand for another good (decreases)
Example: Iphone and Iphone cases
Substitute Goods
Are alternative to each other
When the price of one good(increases), the demand for another good(increases)
Example: Coca-Cola Pepsi
Expectations
Whats going to happen in the future can influence your current demand.
Network Effect
More useful because other people use it
Example: Instagram, Snapchat, Facebook
If more people use such a good, your Demand (increases)
Congestion Effect
Less valuable because other people use it
Example: North Avenue during rush hour
If more people use such a good, your demand (decreases)
Increase in demand
A shift of the demand curve to the right.
An increased quantity is demanded at each and every price.
Decrease in demand
A shift of the demand curve to the left.
A decreased quantity is demanded at each and every price.
Demand curve shifts right
Consider the US bicycle market. Illustrate how the demand curve for bicycles will be affected by shifting accompanying graphs.
Bike lane expands nationwide
Demand curve shifts left
Consider the US bicycle market. Illustrate how the demand curve for bicycles will be affected by shifting accompanying graphs.
Subway system improves significantly
Demand curve shifts right
Consider the US bicycle market. Illustrate how the demand curve for bicycles will be affected by shifting accompanying graphs.
Gov’t announces to impose tariffs on bicycles next year
Movement along the demand curve
If the only thing changing is the price of the good itself
changes in price cause changes in quantity demanded
Change in quantity demand
caused only by a change in the price of the good itself. This is movement along the demand curve.
Change in demand
Caused by factors other than the good’s price( like preferences, income, price of related goods, or special occasions)
This is a change in demand
Consumers are buying less candy because cookies are on sale
This is a change in quantity demand
Consumers are buying more candy because its on sale.
Law of supply
The tendency for quantity to be higher when the price is higher.
Higher prices leads to more supply
Movements along the supply curve
if price changes, market supply changes to the point on the curve
price change causes a movement along the supply curve
Key supply shifters
Input prices
Productivity and Technology
Prices of related outputs
Expectations
The type and numbers of sellers
Productivity growth
Producing more output with fewer inputs.
often driven by technological change
New oven with three times more baking racks
Production capacity increases
The supply of baked goods increase
Industrial robots in an automobile factory
Robots make production more efficient
The supply of vehicles increases
Complements-in-production
Are made together
Donut holes and donuts
Your supply of a good (increases) when the price of another good(increases)
Substitutes-in-production
Are alternative use of your resources
Wheat or corn on your farm
Your supply of a good(decreases) when the price of another good(increases)
If new sellers enter the market
Total quantity supplied at each prices increases
supply curve shifts to the right
If sellers exit the market
Total quantity supplied at each price decreases
supply curve shifts to the left
Equilibrium
A stable situation with no tendency for change.
A market is in equilibrium when the quantity supplied equals the quantity demanded.
Equilibrium Quantity
The quantity demanded and supplied in EQBM
Equilibrium Price
The price at which the market is in EQBM
Surplus Pushes the Price down
As price falls
The Quantity demanded rises
The Quantity Supplied falls
Shortage
When quantity demanded exceeds quantity supplied.
The price is below the equilibrium price
A shortage pushes the price up
Surplus
When quantity demanded is less than quantity supplied
Whenever the price is above the equilibrium price, a surplus pushes the price down.
Gains from trade
Efficiency
Access to cheaper/better quality products
Economies of scale
Competition, innovation, knowledge spillovers
Varirty
Comparative Advantage
The ability to do a task at a lower opportunity cost
Absolute advantage
The ability to do a task using fewer inputs..
Tells you who is best at a task, Not who should do the task.
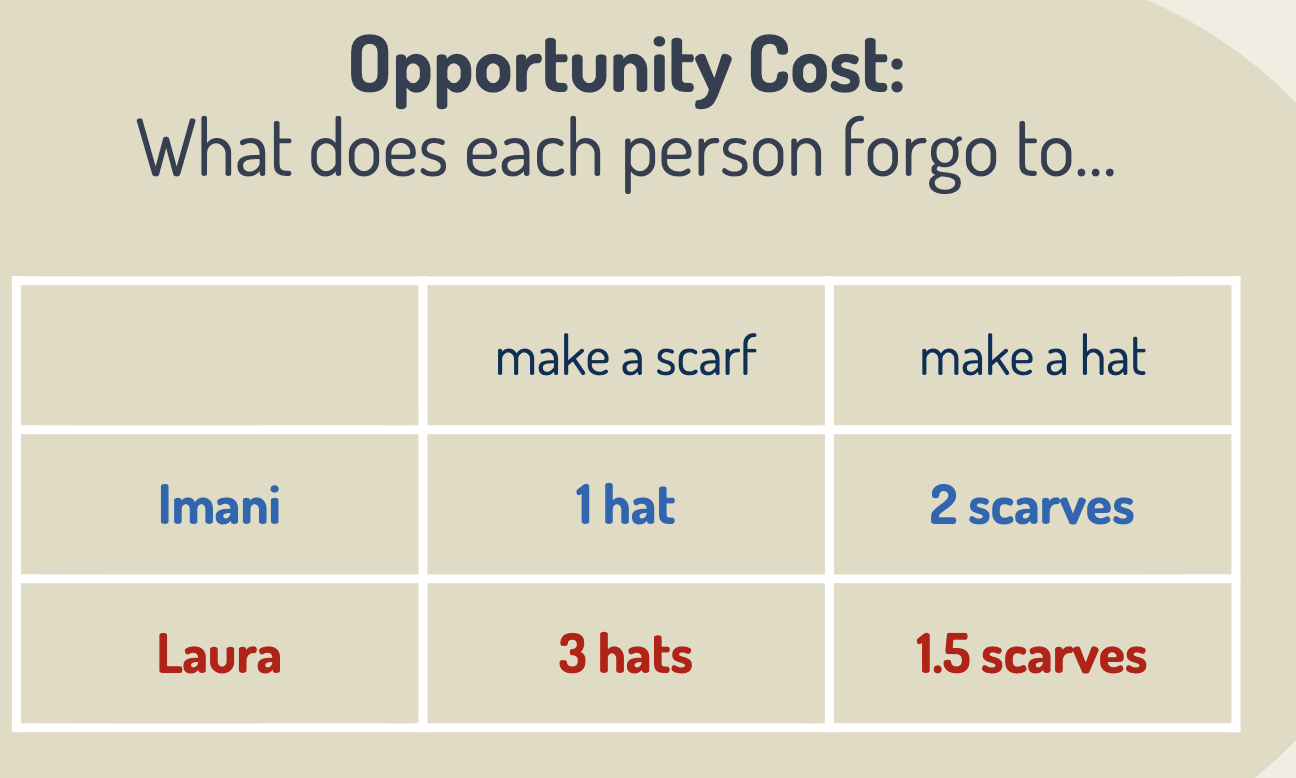
Who has a comparative advantage in the production of hats
Laura
Abundant inputs
Sell what you have a lot
Abundant inputs are determined by
Geography, climate, and natural resources
Specialized skills
Countries with similar inputs may have different production techniques.
Unique skills, production methods, or expertise can lower opportunity costs.
Mass Production
Benefits of mass production
(Sometimes called economies of scale)
specialized skills
A source of comparative advantage
Economic Surplus
Consumer surplus+ producer surplus
World supply
Total quantity of a good supplied by all manufactures around the world, at each price.
World Demand
Total quantity of a good demanded by all buyers around the world, at each price.
World price
The price that a product sells for in the global market.
Imports
Domestic consumers are the winners, and domestic sellers are the losers.
Exports
Domestic consumers are the losers, and domestic sellers are the winners
Effect of imports
Domestic price falls
Domestic quantity demanded rises, and domestic quantity supplied falls
Economic surplus rises overall
Effect of exports
Domestic price rises
Domestic quantity demanded falls, and domestic quantity supplied rises
Economic surplus rises overall
GDP
Gross Domestic Product: The market value of all final goods and services produced within a country in a given year.
Market Value
Common unit is necessary—> value each product at its market price.
market price x quantity
Circular flow of income and Resources
Households and businesses are interconnected through input/output markets
Input market
Households sell labor and businesses buy labor
Output Market
Households buy products and buisnesses sell products.
Y=
GDP
C=
Consumption
I=
Investment
G=
Government purchases
NX=
Net Exports
Consumption
household spending on final goods and services.
Clothes, shoes, food, gas, internet bill, haircuts, cars.
Rent and imputed rent (for house owners)
Investment
Spending on new capital, assets that increase the economy’s productive capacity.
Any long-lasting good used in a business
Research and development spending, office furniture, equipment
Government purchases
Government purchases of goods and services
spending on schools, highways, military
Excluded transfer payments: payments that transfer income from one person to another
Net exports
Spending on exports minus spending on imports
Exports
goods or services produced domestically and purchased by foreign buyers.
Imports
goods or services produced overseas and purchased by domestic buyers.
Value added
the amount by which the value of an item is increased at each stage of production.
total spending
Y=C+I+G+NX
Total output
Y={value added
Total income
{(labor income + capital income)
Limitations of GDP
Market prices (cannot equal) Our values
Non-market activities are excluded
The shadow economy is missing
Environmental degradation isn’t counted.
Leisure doesn’t count
GDP ignores distribution
GDP ignores distribution
GDP measures the size of pie, not how they are distributed.
Leisure doesn’t count
GDP counts the benefit of work but omits the cost of work
Extra work—> less time to spend with family or friends
Environmental degradation isn’t counted
Natural resources have no value until transformed into something else
GDP ignores the costs of environmental degradation
Example: Forest→ Lumber
New cars → pollution
The shadow economy is missing
Economic activities out of view of the government are missing
Non-market activities are excluded
Doing your own laundry
cooking your own meals
raising and taking care of your child(or pet)
Market prices (cannot equal) our values
GDP is the market value of all final goods or services
benefit > price if you enjoy economic surplus
Nominal GDP
GDP measured in today’s prices
Useful for analyzing what GDP is right now, based on the prices you face right now.
What is the nominal GDP for this year and last year?
Last year, your local grocery store sold milk for $3.40 per gallon. This year, that same gallon of milk is priced at $4.20
Last year’s nominal GDP will use $3.40 per gallon.
This year’s nominal GDP will use $4.20 per gallon.
Real GDP
GDP measured in constant prices
excludes the effects of price changes
measures the real change in production.
focuses on changes int he quantity produced