TS Chapter 9
1/69
Earn XP
Description and Tags
Thinking Skills Chapter 9 For Foundation Students September Intake 2023 Chapter 9 = Ase Paradigm
Name | Mastery | Learn | Test | Matching | Spaced | Call with Kai |
|---|
No analytics yet
Send a link to your students to track their progress
70 Terms
What does ASE stand for?
Analysis, Synthesis, Evaluation
What does the ‘A’ in ASE stand for?
Analysis
What does the ‘S’ in ASE stand for?
Synthesis
What does the ‘E’ in ASE stand for?
Evaluation
ASE
“We cannot solve our problems with the same thinking we used when we created them”
Who spoke this line?
Albert Einstein
ASE
“IF you only have a hammer, you tend to see every problem as a nail”
Who spoke this line?
Abraham Maslow
ASE
According to this, What is the definition of Analysis?
Breaking down a problem into its components to gain a deeper understanding of its nature and interrelationships.
ASE
According to this, What is the definition of Synthesis?
Combining information, ideas, or solutions to form new insights or generate innovative approaches.
ASE
According to this, What is the definition of Evaluation?
Assessing the effectiveness, feasibility, and impact of potential solutions to make informed decisions.
######################################################################
If you see this, just press Yes. This is a TRIAL TEST
ASE
@
@
Pareto Chart
Ishikawa Diagram
SWOT Analysis
Morphology Chart
PUGH Evaluation Matrix
Benchmarking
@
Yes
ASE
@
1) Pareto Chart
2) PUGH Evaluation Matrix
3) Morphology Chart
4) Ishikawa Diagram
5) SWOT Analysis
@
Which of the methods is/are used in ‘Analysis’ category?
1, 4 and 5
ASE
@
1) Pareto Chart
2) PUGH Evaluation Matrix
3) Morphology Chart
4) Ishikawa Diagram
5) SWOT Analysis
@
Which of the method is/are not used in ‘Analysis’ category?
2 and 3
ASE
@
1) Pareto Chart
2) PUGH Evaluation Matrix
3) Morphology Chart
4) Ishikawa Diagram
5) SWOT Analysis
@
Which of the method is/are used in ‘Synthesis’ category?
3
ASE
@
1) Pareto Chart
2) PUGH Evaluation Matrix
3) Morphology Chart
4) Ishikawa Diagram
5) SWOT Analysis
@
Which of the method is/are used in ‘Evaluation’ category?
2
ASE
The difference between Analysis and Synthesis is:
@
_______________ involves putting things together.
_______________ involves taking things apart.
@
Fill the second blank
ANALYSIS
ASE
The difference between Analysis and Synthesis is:
@
_______________ involves putting things together.
_______________ involves taking things apart.
@
Fill the first blank
SYNTHESIS
ASE
Ali received many complaints about his recent bicycle product. After some checking, He identified a total of 10 problems with his bicycle.
Which of the ASE method did Ali use?
Analysis
ASE
Ali identified 10 problems in his recent bicycle product. He then searched for possible other items to replace the former one, to make the bicycle lighter, faster and quieter.
Which of the ASE method did Ali use?
Synthesis
ASE
After many complaints, Ali had a few possible modifications to his bike. Ali then asked a few of his designers and technician to assess and explore in-depth about each possible modification. After some time, the team had decided the best modification for Ali’s bicycle product. Ali agreed upon reviewing their reasonings with each modification.
Which of the ASE method did Ali use?
Evaluate
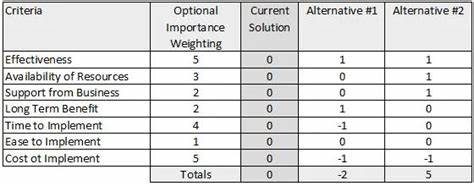
ASE
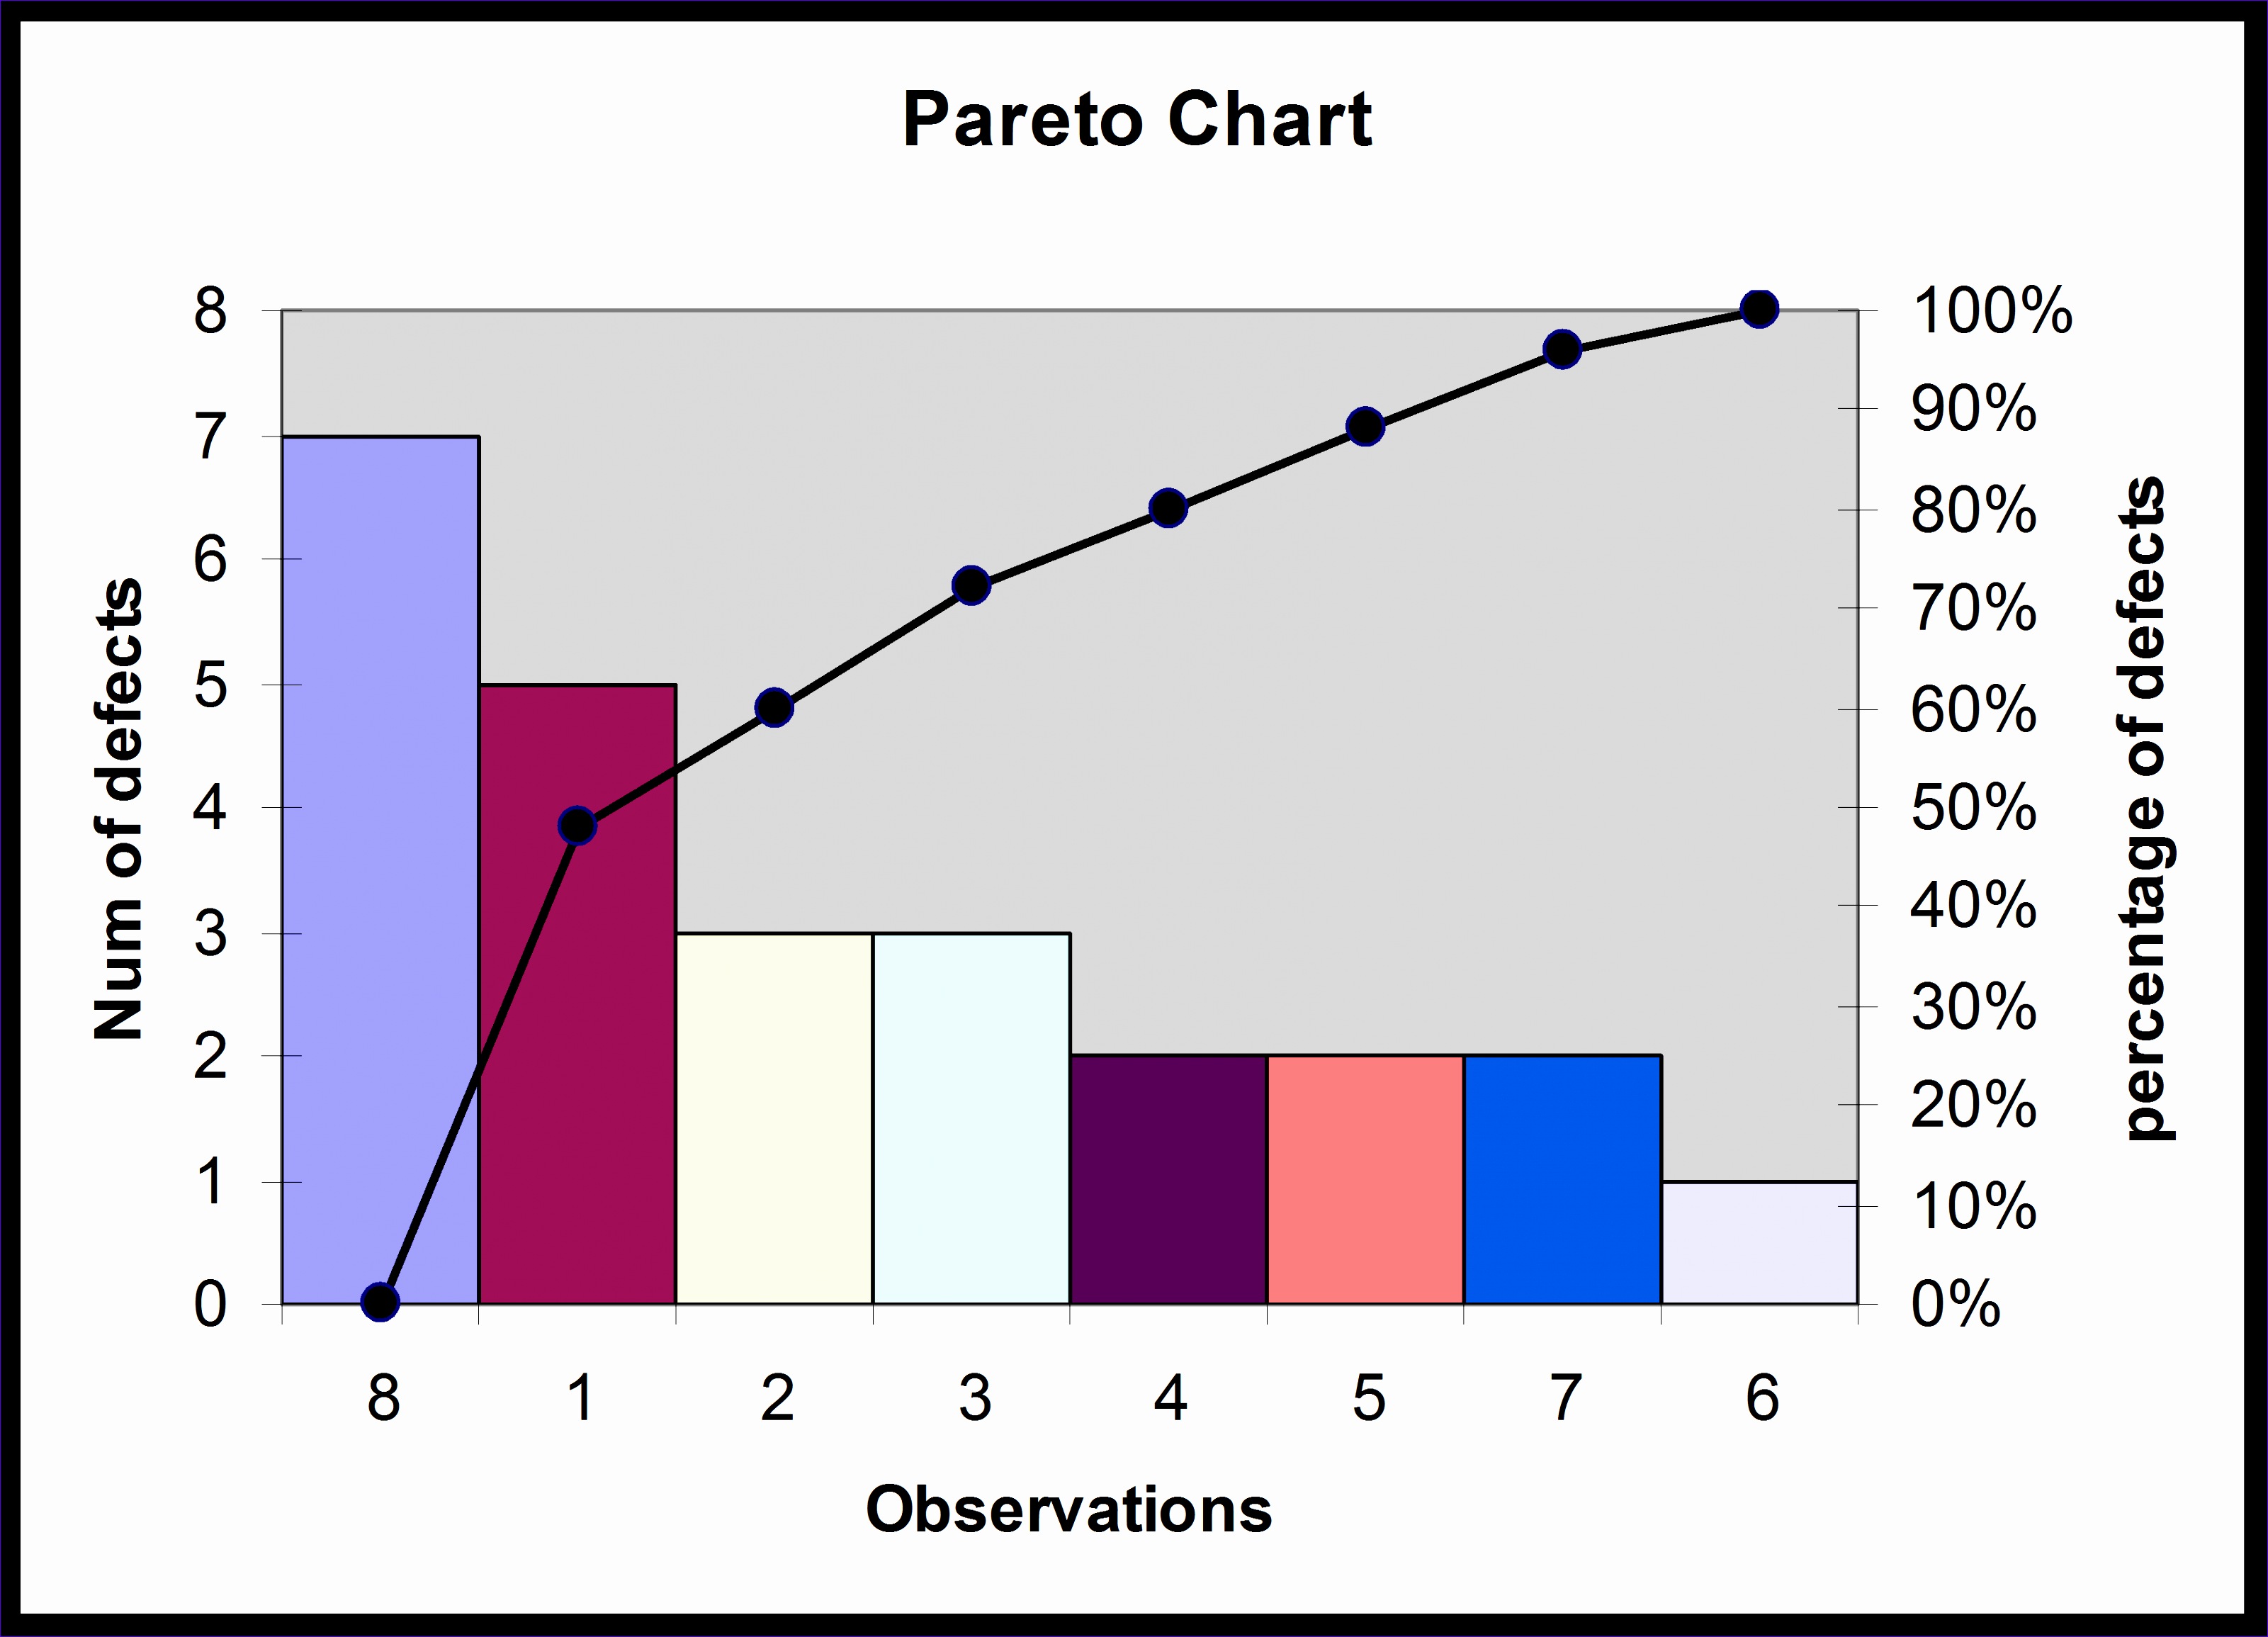
What does this image refer to?
Pareto Chart
ASE
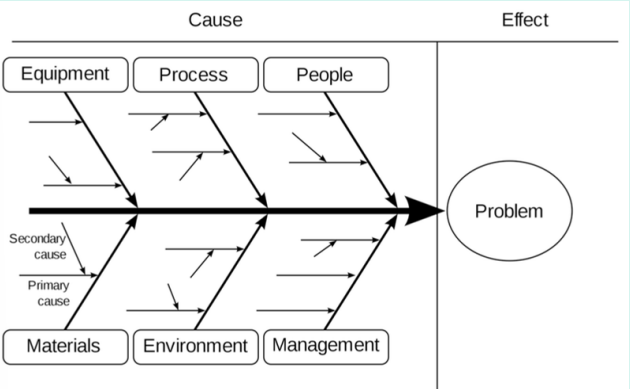
What does this image refer to?
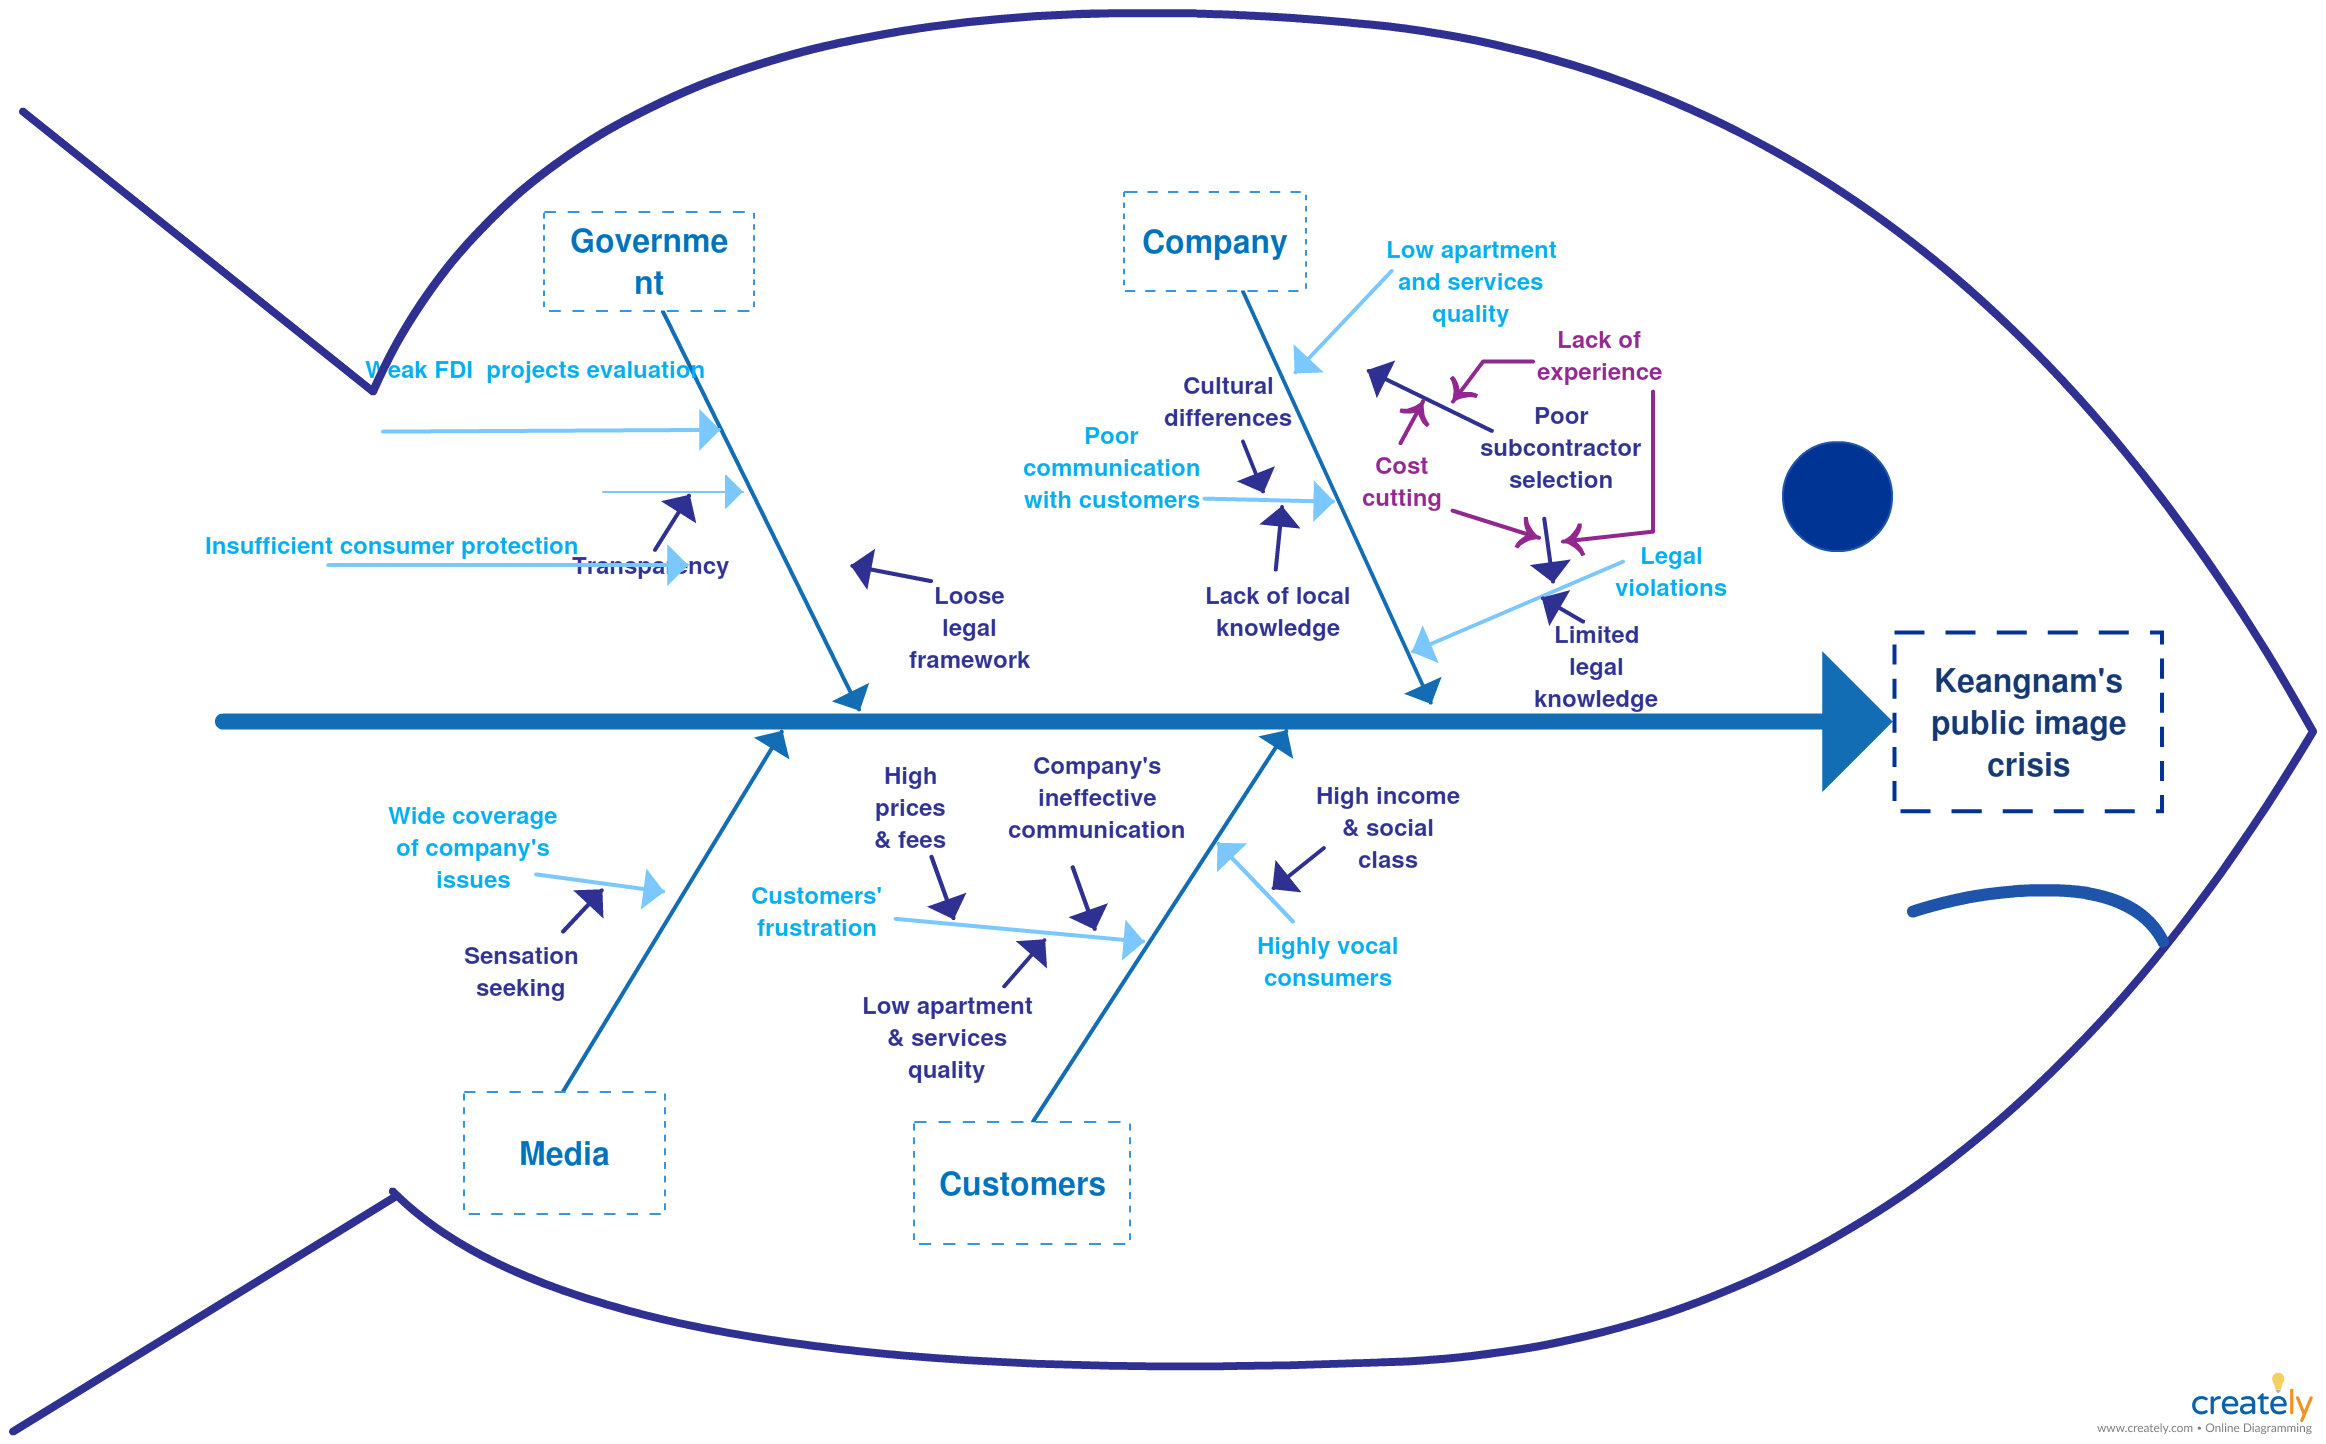
Ishikawa Diagram
ASE
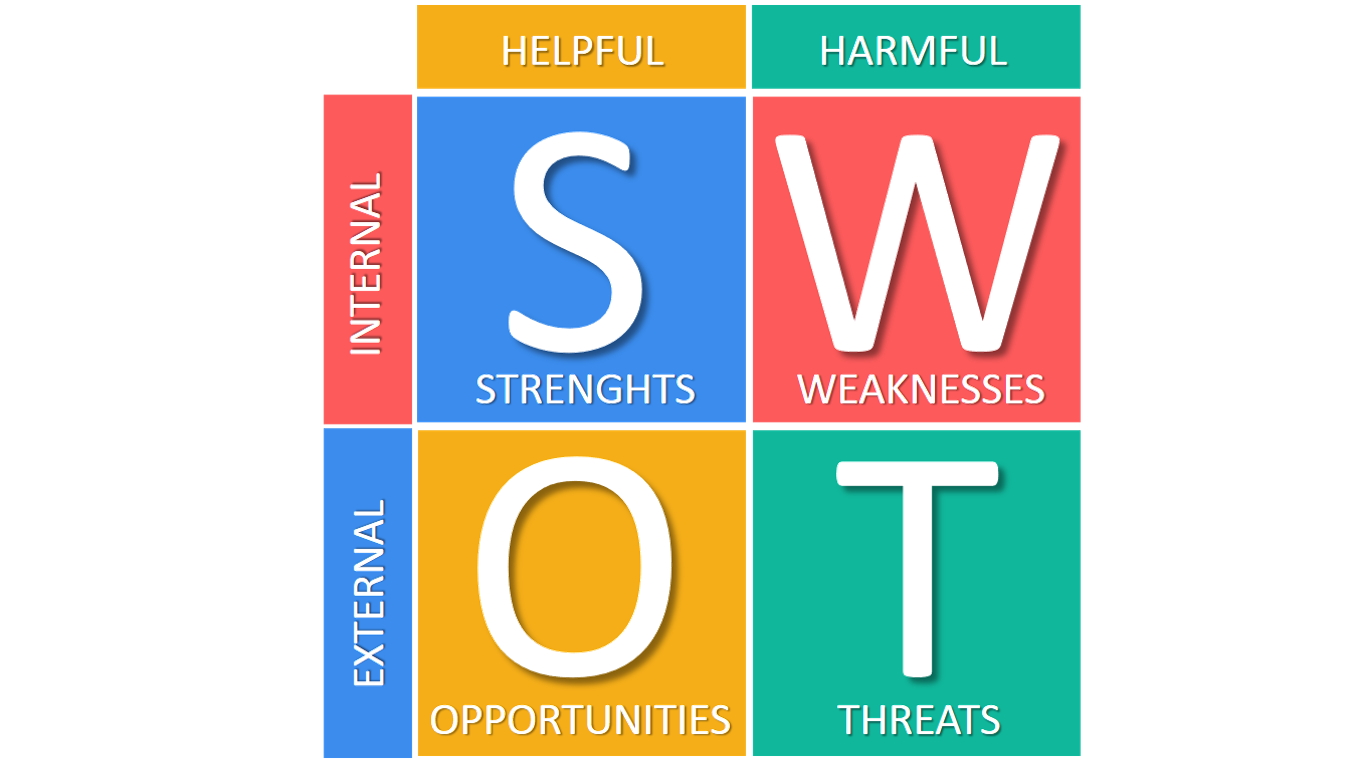
What does this image refer to?
SWOT Analysis
ASE
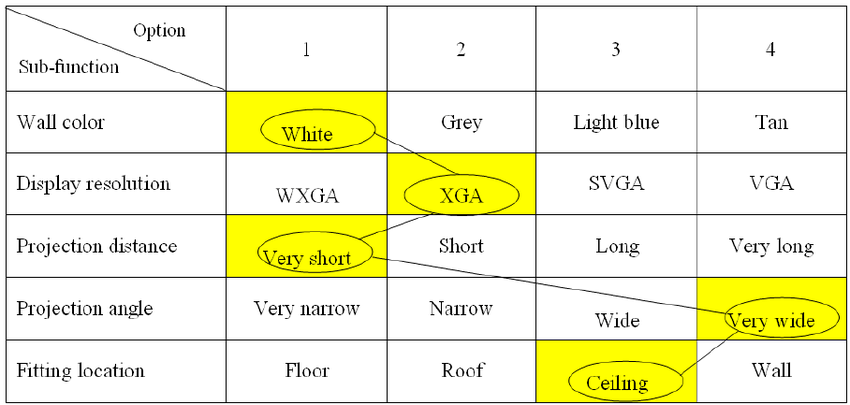
What does this image refer to?
Morphology Chart
ASE
What does this image refer to?
PUGH Evaluation Matrix
ASE - ANALYSIS
What technique does people use to find the most important cause to a problem?
Pareto Analysis
ASE - ANALYSIS
What technique is used to see potential changes that would bring the biggest benefit?
Pareto Analysis
ASE - ANALYSIS
The Pareto chart uses a __________________________ to identify and separate the vital causes of problem.
Bar graph or Histogram
ASE - ANALYSIS
What is the other name for Pareto Principle?
80/20 rule
ASE - ANALYSIS
“In 80/20 rule, suggests that 80% of _______________are typically caused by 20% of the _______________.”
Fill the first blank.
problems
ASE - ANALYSIS
“In 80/20 rule, suggests that 80% of _______________are typically caused by 20% of the _______________.”
Fill the second blank.
factors
######################################################################
If you see this, just press Yes. This is a TRIAL TEST
Pareto Chart
This diagram is useful to show problems/causes in a simple comparative graphical presentation.
It focuses attention to the problem/factor based on priorities.
Ishikawa Diagram
It helps identify and categorize many potential causes of problems or issues.
identifying root causes.
SWOT Analysis
Identify proficiencies and shortcomings.
ASE - Analysis
@
1) Identify & categorize many potential causes of problems.
2) Focuses attention to the problem/factor based on priorities.
3) Identify Proficiencies and Shortcomings.
4) Show problem/causes in a simple comparative graphical presentation.
5) Identifying root causes.
@
Which are the reasons for using Pareto Chart?
Yes
ASE - Analysis
@
1) Identify & categorize many potential causes of problems.
2) Focuses attention to the problem/factor based on priorities.
3) Identify Proficiencies and Shortcomings.
4) Show problem/causes in a simple comparative graphical presentation.
5) Identifying root causes.
@
Which are the reasons for using Pareto Chart?
2 and 4
ASE - Analysis
@
1) Identify & categorize many potential causes of problems.
2) Focuses attention to the problem/factor based on priorities.
3) Identify Proficiencies and Shortcomings.
4) Show problem/causes in a simple comparative graphical presentation.
5) Identifying root causes.
@
Which are the reasons for using Ishikawa Diagram?
1 and 5
ASE - Analysis
@
1) Identify & categorize many potential causes of problems.
2) Focuses attention to the problem/factor based on priorities.
3) Identify Proficiencies and Shortcomings.
4) Show problem/causes in a simple comparative graphical presentation.
5) Identifying root causes.
@
Which are the reasons for using SWOT Analysis?
3
######################################################################
If you see this, just press Yes. This is a TRIAL TEST
ASE - Analysis
There are 6 steps to create a Pareto Chart
1) Define the Problem
2) Data Collection
3) Categorize Data
4) Count Occurence
5) Calculate Cumulative Frequency
6) Plot the Data
Which step is MarryBrown on as of the statement?
1)
MarryBrown’s market percentage is getting lower and lower every year. Thus, the heads of departments have executed a few board meetings. After a while, they found the problem, which is the menu remains unchanged for a long time. Meetings after meetings have made the company decide to add a new food in the menu list.
2)
MarryBrown is adding Burrito with different spices in its menu list. After some meeetings with the cooks, they have decided to make 4 variations of Burritos. The names given are ‘Burrito Rahmah’ , ‘Burrito Rahmah Spicy’ , ‘Burrito Chicken’ and ‘Burrito Chicken Spicy’.
3)
MarryBrown has decided to make 4 variations of Burritos. The company listed all 4 burritos into 2 distinct group. One group, namely the ‘Budget’ group, aims to deliver Burritos to as many customers as possible. Another group, as they called ‘Luxury’ group, aims to provide maximum satisfaction to its customers in return for their additional prices.
4)
MarryBrown has decided to make 4 variations of Burritos. They released a tweet on ‘X’ website to attract its follower. After a week, the company issued a vote in X that can be accessed and voted by all users of X (Twitter). The result stated that ‘Burrito Rahmah’ got 111 votes, ‘Burrito Rahmah Spicy’ won with 444 votes, ‘Burrito Chicken’ got 222 votes and ‘Burrito Chicken Spicy’ got 333 votes.
5)
MarryBrown has decided to make 4 variations of Burritos. They released a tweet on ‘X’ website to attract its follower. After a week, the company issued a vote in X that can be accessed and voted by all users of X (Twitter). After the voting, the voting department arranged all four of the categories in descending form. It was done so that they know what might sell the highest amount. Therefore, the company can profit from fulfilling the specific demands of the customers.
6)
MarryBrown has decided to make 4 variations of Burritos. They released a tweet on ‘X’ website to attract its follower. After long process of voting and arrangement, finally the heads of department for MarryBrown social media created a Pareto Chart and plot the necessary details based on the data received. The department’s motive of this Pareto Chart is to simplify the data so that the explanations to other committees would be easier.
Yes
ASE - Analysis
There are 6 steps to create a Pareto Chart
1) Define the Problem
2) Data Collection
3) Categorize Data
4) Count Occurence
5) Calculate Cumulative Frequency
6) Plot the Data
Which step is MarryBrown on as of the statement?
@
MarryBrown’s market percentage is getting lower and lower every year. Thus, the heads of departments have executed a few board meetings. After a while, they found the problem, which is the menu remains unchanged for a long time. Meetings after meetings have made the company decide to add a new food in the menu list.
@
1
ASE - Analysis
There are 6 steps to create a Pareto Chart
1) Define the Problem
2) Data Collection
3) Categorize Data
4) Count Occurence
5) Calculate Cumulative Frequency
6) Plot the Data
Which step is MarryBrown on as of the statement?
@
MarryBrown is adding Burrito with different spices in its menu list. After some meeetings with the cooks, they have decided to make 4 variations of Burritos. The names given are ‘Burrito Rahmah’ , ‘Burrito Rahmah Spicy’ , ‘Burrito Chicken’ and ‘Burrito Chicken Spicy’.
@
2
ASE - Analysis
There are 6 steps to create a Pareto Chart
1) Define the Problem
2) Data Collection
3) Categorize Data
4) Count Occurence
5) Calculate Cumulative Frequency
6) Plot the Data
Which step is MarryBrown on as of the statement?
@
MarryBrown has decided to make 4 variations of Burritos. The company listed all 4 burritos into 2 distinct group. One group, namely the ‘Budget’ group, aims to deliver Burritos to as many customers as possible. Another group, as they called ‘Luxury’ group, aims to provide maximum satisfaction to its customers in return for their additional prices.
@
3
ASE - Analysis
There are 6 steps to create a Pareto Chart
1) Define the Problem
2) Data Collection
3) Categorize Data
4) Count Occurence
5) Calculate Cumulative Frequency
6) Plot the Data
Which step is MarryBrown on as of the statement?
@
MarryBrown has decided to make 4 variations of Burritos. They released a tweet on ‘X’ website to attract its follower. After a week, the company issued a vote in X that can be accessed and voted by all users of X (Twitter). The result stated that ‘Burrito Rahmah’ got 111 votes, ‘Burrito Rahmah Spicy’ won with 444 votes, ‘Burrito Chicken’ got 222 votes and ‘Burrito Chicken Spicy’ got 333 votes.
@
4
ASE - Analysis
There are 6 steps to create a Pareto Chart
1) Define the Problem
2) Data Collection
3) Categorize Data
4) Count Occurence
5) Calculate Cumulative Frequency
6) Plot the Data
Which step is MarryBrown on as of the statement?
@
MarryBrown has decided to make 4 variations of Burritos. They released a tweet on ‘X’ website to attract its follower. After a week, the company issued a vote in X that can be accessed and voted by all users of X (Twitter). After the voting, the voting department arranged all four of the categories in descending form. It was done so that they know what might sell the highest amount. Therefore, the company can profit from fulfilling the specific demands of the customers.
@
5
ASE - Analysis
There are 6 steps to create a Pareto Chart
1) Define the Problem
2) Data Collection
3) Categorize Data
4) Count Occurence
5) Calculate Cumulative Frequency
6) Plot the Data
Which step is MarryBrown on as of the statement?
@
MarryBrown has decided to make 4 variations of Burritos. They released a tweet on ‘X’ website to attract its follower. After long process of voting and arrangement, finally the heads of department for MarryBrown social media created a Pareto Chart and plot the necessary details based on the data received. The department’s motive of this Pareto Chart is to simplify the data so that the explanations to other committees would be easier.
@
6
ASE - Analysis
What is the popular nickname for Ishikawa Diagram?
Fishbone Diagram
ASE - Analysis
@
The Ishikawa diagram resembles a fish's skeleton, with the "__________" representing the problem or effect, and the "__________" representing the various factors or causes contributing to it.
@
Fill the first blank
Head
ASE - Analysis
@
The Ishikawa diagram resembles a fish's skeleton, with the "__________" representing the problem or effect, and the "__________" representing the various factors or causes contributing to it.
@
Fill the second blank
Bones
######################################################################
If you see this, just press Yes. This is a TRIAL TEST
ASE - Analysis
In Ishikawa Diagram, the Main Causes is put as the ‘Spine’. These main cases dive deep into specific causes, which is put as the ‘Branches’. We put the Main Problem in the ‘Head'
ASE - Analysis
These are the steps of creating an Ishikawa Diagram
Define the Problem → Identify Major Categories→ Brainstorm Causes →Create the Diagram → Document Causes
ASE - Analysis
There are 5 steps of creating an Ishikawa Diagram. What is the first step?
Define the Problem
Identify Major Categories
Brainstorm Causes
Create the Diagram
Document Causes
Yes
ASE - Analysis
In Ishikawa Diagram, the Main Causes is put as the ‘__________’. These main cases dive deep into specific causes, which is put as the ‘__________’. We put the Main Problem in the ‘Head'
Fill the first blank.
Spine
ASE - Analysis
In Ishikawa Diagram, the Main Causes is put as the ‘__________’. These main cases dive deep into specific causes, which is put as the ‘__________’. We put the Main Problem in the ‘Head'
Fill the second blank.
Branches
ASE - Analysis
There are 5 steps of creating an Ishikawa Diagram. What is the first step?
Define the Problem
ASE - Analysis
There are 5 steps of creating an Ishikawa Diagram. What is the second step?
Identify Major Categories
ASE - Analysis
There are 5 steps of creating an Ishikawa Diagram. What is the third step?
Brainstorm Causes
ASE - Analysis
There are 5 steps of creating an Ishikawa Diagram. What is the fourth step?
Create the Diagram
ASE - Analysis
There are 5 steps of creating an Ishikawa Diagram. What is the final step?
Document Causes
ASE - Analysis
What does ‘S’ means in SWOT Analysis?
Strengths
ASE - Analysis
What does ‘W’ means in SWOT Analysis?
Weakknesses
ASE - Analysis
What does ‘O’ means in SWOT Analysis?
Opportunities
ASE - Analysis
What does ‘T’ means in SWOT Analysis?
Threats
ASE - Analysis
SWOT stands for
1) S = Strengths
2) W = Weaknesses
3) O = Opportunities
4) T = Threats
Which of these are the internal factors?
1 and 2
ASE - Analysis
SWOT stands for
1) S = Strengths
2) W = Weaknesses
3) O = Opportunities
4) T = Threats
Which of these are the external factors?
3 and 4
ASE - Analysis
For ____________________ in SWOT Analysis, you can control or improve. Examples include your skills, knowledge, habits or resources.
Internal Factors
ASE - Analysis
For ____________________ in SWOT Analysis, you cannot control it but you can influence or respond to it. The examples includes Trends, events, competitiors, or changes.
External Factors
ASE - Synthesis
Synthesis, contradict to Analysis, is to combine the elements to produce something new
Press True if you understand now
True
ASE - Synthesis
Below is the description of the 3 steps of creating a Morphology Chart for Synthsis.
@
“List all the potential solutions to the problem”
@
Which step?
Break Down the Problem
ASE - Synthesis
Below is the description of the 3 steps of creating a Morphology Chart for Synthsis.
@
“Combine components from previous step to create new and innovative solutions that address the problem”
@
Which step?
Generate Option
ASE - Synthesis
Below is the description of the 3 steps of creating a Morphology Chart for Synthsis.
@
“Select the preferable solution based on criteria established on the analysis and evaluation stages”
@
Which step?
Choose a Solution
ASE - Evaluation
PUGH Evaluation Matrix
What are the 3 main evaluation symbols of a certain improvement?
+, - and 0
ASE - Evaluation
In PUGH Evaluation Matrix. ‘+’ means
The alternative is better than the baseline
ASE - Evaluation
In PUGH Evaluation Matrix. ‘-’ means
The alternative is worse than the baseline
ASE - Evaluation
In PUGH Evaluation Matrix. ‘0’ means
The alternative is equally feasible as the baseline
ASE - Evaluation
In PUGH Evaluation Matrix. ‘S’ means
The alternative is equally feasible as the baseline
Extra =
ASE - Evaluation
Why is PUGH Evaluation Matrix called the ‘PUGH’?
It was named after its inventor, Stuart Pugh