PSYC 210 - Introduction to Statistical Analysis
1/37
Earn XP
Description and Tags
Flashcards made regarding the main concepts!
Name | Mastery | Learn | Test | Matching | Spaced | Call with Kai |
|---|
No study sessions yet.
38 Terms
Sampling Distributions
Plotting a statistic based on repeated sampling in a population.
What are the population symbols?
Mu (population mean)
Sigma (population standard deviation)
N (population size)
What are the sample symbols?
X bar (sample mean)
s (sample standard deviation)
n (sample size)
Mean of the means (grand mean) from sampling distribution is..
An unbiased estimate of the population parameter
Sampling Distribution of the Mean
Mean of all samples repeatedly collected from the population and plotted as a distribution
AKA an estimation of the population mean
Standard Error (𝜎𝑥̄)
how wrong your sample mean might be on average from the true population mean.
A larger SE means your sample mean could be further from the true mean, so there is more uncertainty.
Standard score
AKA Z-score
Standard Deviation
how far, on average, each data point is from the mean.
Effect Size
Even if your result is statistically significant, the effect may be tiny. The effect size tells us about whether the difference or relationship is meaningful in REAL LIFE.
Variance
The average amount of spread of data from the mean in SQUARED UNITS (s²)
Sum of Squares
Sum of all squared standard deviations from the mean, used to find variance and standard deviation (SD).
Degrees of Freedom
How many numbers are free to vary
Higher df: more sample size, better estimates of SD and variance
Confidence Interval
range of values where the true population mean or the true difference between means lie
95% CI → if you repeated your experiment many times, 95% of the calculated intervals would contain the true mean.
Wider CI → more uncertainty → larger SE or smaller sample size
Narrower CI → more precision → smaller SE or larger sample size
Type I Error
u think ur treatment has an effect but it doesnt
Type II Error
treatment has an effect but u conclude that it doesnt
If we have population mean and standard deviation we can use…
a Z-test
If we don’t have population standard deviation, we can use…
one sample t-test
If we don’t have population sample and standard deviation, we can use…
two samples independent t-test
hypothesis for dependent measures t-test
mu dbar = 0
mu dbar does not equal 0
what two measures of variance does anova compare
variance of the group means around the grand mean (between) vs variance of individual scores around their group mean (within)
between-group variance
how spread apart each group’s mean score is
(the difference between the classroom averages)
within-group variance
how spread apart each individual score in the group is
(the difference between students in the classroom)
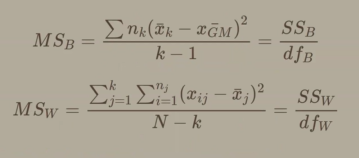
what is mean squares between (MSB)
variance between group means, how far apart the group means are from each other
what is mean squares within (error)
MSwithin measures the average variance inside each group.
It represents the “error” or noise—how much individual scores fluctuate around their own group mean.
what does it mean if MSB is low
groups are similar = supports the null hypothesis
what does it mean if MSB is high
groups aren’t similar = supports the alternative hypothesis
how to calculate df within
n-k
Fratio formula
MSb/MSw
how to calculate df between
k-1
Steps for solving a One way ANOVA?
1) define hypothesis (null: mu1 = mu2 = mu3, alt. hypothesis: not h0)
2) solve for between-group sum of squares
(SSbetween = Sigma (sample size) [xbar - xGM]²)
3) solve for within-group sum of squares by adding together all variance
4) find the degrees of freedom for within and between group
5) solve for mean of squares
MSbetween = ssbetween/df between
MSwithin = sswithin/df within
6) solve for f-ratio: MSbetween/MSwithin
ANOVA IN BRIEF (for reference)
r²
how much of the variation in one variable can be explained by the other
Spearman correlation coefficient
Measures the relationship between ranks (ordered data).
Works when data isn’t normally distributed or when you only care about order, not exact values.
➢Point-biserial correlation coefficient
to measure one variable that is continuous (on an interval or ratio scale of measurement) and a second variable that is dichotomous (on a nominal scale of measurement)
Phi correlation coefficient
to measure two dichotomous variables.
Univariate outlier
Weird on either predictor or response variable
Regression outlier
Weird for the regression model (large residual)
Influence
Weird on predictor variable and weird on response variable and has a large residual