POB II - Lectures 22 & 23
1/46
There's no tags or description
Looks like no tags are added yet.
Name | Mastery | Learn | Test | Matching | Spaced |
|---|
No study sessions yet.
47 Terms
K-selected organisms
Invest more in few offspring so each has a high chance of survival
Maintain high reproductive rate at high population density
Competitive species with stable populations
Live near carrying capacity in predictable environment
Tend to be slow developing, long-lived, & large-bodied
r-selected organism
Produce many offspring each with a low chance of survival
Maximum reproductive success in uncrowded environment (low density)
Populations are below carrying capacity—little competition
Common in unpredictable, disturbed, unstable environments
Tends to be short-lived, rapidly developing & small-bodied
Factors that determine population growth
Births, deaths, immigrants, emigrants
Exponential growth
Growth in ideal & unrestricted conditions
Population increases from the starting population (N) size at each time point by a constant proportion (r)
Simplest model of population growth
J-shaped growth curve
𝚫𝑵/𝚫𝒕 = 𝑩 − 𝑫
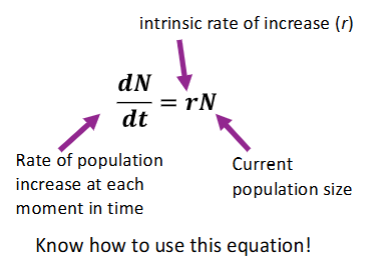
Intrinsic rate of increase
r variable in population growth
The per capita rate at which an exponentially growing population increases in size at each instant in time
Determines how fast the population grows
Ex. higher r with the same N means more individuals produced per generation
Exponential growth in biology
Introduced species when unchecked (ex. invasive species)
Species when recovering from a catastrophe (ex. protected species)
Why have humans not reached a carrying capacity?
Can alter environment with the purpose of increasing carrying capacity
Overcome density-dependent growth regulation
Intelligence, society, communication (ex. domestication, agriculture)
Migration and public health, sanitation, antibiotics
Demographic transition
Humans specifically
Shift from high birth & death rates to low birth & death rates
Causes: health care, sanitation, education, social change, agriculture
Carrying capacity (K)
Maximum population size that can be supported
Determined by limited resources:
Energy
Shelter, refuge from threats
Nutrient availability, water
Suitable nesting sites
Disease, waste accumulation
Why? Increase size, fewer access to resources
Logistic growth
The per capita rate of population growth approaches zero (levels off) as the population size near K
As populations become larger/denser:
Individuals need sufficient resources to reproduce or per capita birth rate will decrease
Starvation/disease may increase causing per capita death rate to increase
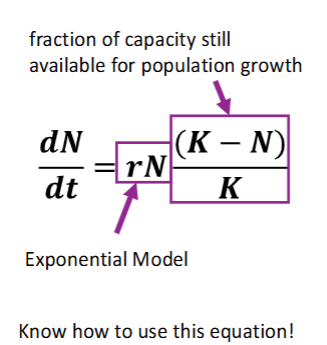
Birth rate must decrease OR death rate must increase (or both)
When population approaches carrying capacity (hint: limiting population)
Density dependent factors
Population regulation
Factors that alter birth or death rates as population increase
Birth & death rates increase/decrease with density
As a population grows: resources available per individual decrease, risks of predation, disease, parasites increase
Only factors that can consistently cause population to decrease/increase
Density independent factors
Population regulation
Factors that alter population size regardless of density
Birth and death rates do not change with density
All individuals of a population equally likely to be affected
Outcome is the same regardless of population size or density
Lead to unpredictable & abrupt population changes
Most often abiotic
Competition
Density-dependent regulation
More individuals means more competition for resources
Fewer resources lowers growth, survival, fecundity
Intrinsic factors
Density-dependent regulation
More individuals = physiological changes
Even when resources are abundant, high density conditions increase stress
Hormonal changes suppress growth & reproduction
Stress suppresses immune function & increases disease vulnerability
(ex. small mammals)
Territoriality
Density-dependent regulation
Individuals divide & defend resources
Secures sole access to resources
Not enough territories = decrease in population
Smaller territory size, smaller population density
Toxic wastes
Density-dependent regulation
More individuals, more waste accumulated
Can kill individuals
(ex. yeast produces toxic ethanol)
Disease
Density-dependent regulation
More individuals, increased likelihood disease transmission
Predation
Density-dependent regulation
More individuals, easier food for predators
Predator-prey cycle
Predator & prey are density-dependent regulators of each other
No competition: predator exponential growth
No predator: prey exponential growth
Signature cyclical graph: one increases, other decreases, one high, one low
Competition
The density-dependent factor that regulates predators
Predation
The density-dependent factor that regulates prey
Population dynamics
Spatial & temporal variation in population size as a result of abiotic & biotic conditions
Influenced in immigration & emigration
Emigration
Population-level response to ecological pressures
Allows escape from density-dependent regulation: competition, aggression, resource scarcity
Ex. density determines wolf population at regional level, pack size is determined by food availability
Dispersal
Population-level response to ecological pressure
Animals move and separate due to pressures
Active dispersal
Mobile animals are stimulated to move
Ability to move far depends on species & type of barrier
Factors: crowding, temperature changes, food availability/quality, photoperiod
Passive dispersal
Non mobile organisms disperse
Involves gravity, wind, water, or animals
Dispersal distance depends on the dispersal agent
Animals can assist with passive dispersal
Ex. seeds and dogs
Migration
The intentional & directional movement of animals between two regions or habitats
How migration occurs
Position tracking relative to the sun & stars
Sensing of magnetic fields
Why migration occurs
Better resources
Milder climate
Safer for raising offspring
When migration occurs
Daily, seasonal
Metapopulation dispersal
Foraging
Ex. zooplankton migrating from surface at night to depths in the daytime to avoid predators, birds leaving for the winter for food & nesting sites
Species-area curve
Biodiversity pattern that shows that the larger the geographic area of a community is, the more species it has
Island biogeography
Attempts to explain species-area relationship, explanation can apply to ANY HABITAT
Island equilibrium model
MacArthur & Wilson
Balance between immigration rate & extinction rate determines equilibrium number of species
As number of species increases, immigration decreases (fewer potential colonizers from the source & limited niche space)
As number of species increase, extinction increases (not enough resources to sustain everyone!)
Q - equilibrium number of species
Composition can change even when it stabilizes at Q
Island distance
The factor that primarily impacts immigration
Close islands
Easier to get to, more immigrants can colonize
Will support more species at equilibrium
Higher colonization
Island size
This factor primarily impacts extinction
Larger islands
More resources & habitat diversity, more species can coexist
Lower extinction
Equilibrium number of species (Q)
The stable number of species that an island ecosystem can support reached when rate of immigration equals rate of extinction
Population connectivity
Movement between populations maintains gene flow
Populations can be connected in complex patterns depending on dispersal ability & landscape
Metapopulation
A population broken into subpopulations connected by dispersal across an inhospitable matrix
Sub-populations occupy discrete patches of suitable habitat in a sea of unsuitable habitat
Patches vary in size, quality, & isolation (determines if a location can support sub-populations & human individuals move between locations)
Regional extinction
The thing dispersal among patches prevents because individuals are able to find places to survive
Mainland-island dynamics
One-way metapopulation
Dispersal establishes new self-sustaining populations
Colonization happens in one direction: from the source
Size & isolation
Other factors that determine species richness (think of other habitats rather than islands)
Source-sink
Type of metapopulation
Dispersing population in not self-sustaining
Population dies out when occupying suitable habitats
Landscape connectivity
How much the landscape facilitates or impedes movement
Population connectivity
Connected populations = gene flow
Genetic diversity can tell us how recently & how much subpopulations are interacting
Populations that interact more often share more genetic diversity
Populations that do not interact do not share genetic diversity
Important to maintain healthy ecosystems & resilient species (reduce inbreeding, stability of population through immigration and extinction, adaptations)