2.3 - environmental threats to our planet
1/56
Earn XP
Description and Tags
Name | Mastery | Learn | Test | Matching | Spaced | Call with Kai | Chat |
|---|
No analytics yet
Send a link to your students to track their progress
57 Terms
2.3.1
definition of the quaternary period
covers the last 2.6million years
often called - ice age - due to Antarctica
2.3.1
explain the climate change from the beginning of quaternary period to now
temperatures fluctuated wildly
overall gradually cooled
cold spikes = glacial episodes - ice age
now = interglacial episode
average temp today - higher than most of quaternary period
2.3.1
explain medieval warming period
lasted from 950 to 1250AD
some regions - temp equals today
overall temp = lower than today
2.3.1
explain little ice age
following the medieval warming period
1300 - 1870
europe and north america = colder winters
rivers + seas around UK froze
2.3.1
explain modern warming
todays’ temperature increasing
compared to average temp in 20th century - increased in last few decades
2.3.1
main evidence for climate change
increase of average surface air temp by 1’C - last 100 years
warmest ocean temp since 1850
average rise in sea levels - 20cm since 1900
2.3.1
evidence for climate change - global temperature data
over 1000 ground weather stations + satellite info → map global temp
increased by 0.6’C by 1950
LIMITATION - weather station - not evenly distributed (Africa) - reliable?
data - only till 1880
2.3.1
evidence for climate change - ice cores
oxygen, CO2 and methane = found in ice cores
estimate past temp = 800,000 years
compare to present level
scienctists - drill deep into ice in Antarctic + Greenland - extract thousand year old ice
reliable
2.3.1
evidence for climate change - tree rings
one tree ring = year of growth
narrow rings = cool + dry past climate conditions
wider rings = warmer + wetter past climate conditions
2.3.1
evidence for climate change - paintings + diaries
suggest evidence of climate change through observations
price increases in grain in Europe
sea ice - prevent landing in Iceland
people - emigrating - crop failure
winter ‘Frost Fair’ - frozen River Thames
art = much colder winter landcspes - 17th century
cave paintings - draw animals - 11,000 + 40,000 years ago
subjective and hard to date
2.3.2
explain how variations in energy from sun caused climate change
sunspots = dark patches on sun’s surface
caused by outburst of magnetic energy
scientists - more sunspots = more heat is given off by Sun
BUT - solar output = barely changed - cannot be responsible for climate change from 1970
2.3.2
explain how changes in the earth’s orbit caused climate change
distribution of sun’s energy = varies due to change in earth’s orbit.
Axial tilt - spins on tilted axis
angle of tilt changes - gravitational pull from moon
angle of tilt - large = higher average temp
Precession - ‘wobble’
as the earth spins during its rotations - it wobbles
Eccentricity - earths orbit around sun
not fixed + changes over time
almost circular to slightly elliptical
cold period = circular
warm period = elliptical
2.3.2
explain how volcanic activity caused climate change
huge quantities of ash, gas + liquid → into atmosphere
sulphur dioxide + water vapour = volcanic aerosol
this reflects sunlight away - reduces global temp
wind - carries material far away - reduced temp experienced somewhere else
2.3.2
what is natural greenhouse effect
natural occurring phenomenen
keeps Earth warm enough for life to exist
sun’s infrared heat rays - enter Earth’s atmosphere
heat - reflected from Earths surface
natural layer of atmosphere + greenhouse gases = some heat is trapped + some heat reflected
2.3.2
what is enhanced greenhouse effect
natural causes = not responsible for current rise in temp
human activity = cause
increased layer of greenhouse gases - 77% CO2, 14% methane, 8% NOs, 1% CFCs
less of sun’s energy = escape atmosphere - temp increases
2.3.2
name some human activities that contribute to enhanced greenhouse effect
CO2 - burning fossil fuels, deforestation
Methane - cattle rearing, rice paddy fields, decomposition in landfill
NOs - exhaust fumes, agriculture + industrial processes
2.3.3 - global
social impact of sea level rise
600 million people = live coastal areas - 10m above sea
environmental refugees - increase due to flooding
migration + overcrowding - low risk areas - Asia
2.3.3 - global
economic impact of sea level rise
agricultural land - lost to sea - Bangladesh
world cities - affected - global finacial hubs - London + New York
transport infrastructure - destroyed
investment in coastal defences - increased pressure from sea level rise
tourism - loss in income - beaches = flooded/eroded
2.3.3 - global
environmental impact of sea level rise
33% - coastal land + wetlands - lost in 100 years
bleaching in coral reefs - loss of biodiversity
mangrove forests - natural barrier - destroyed in storms
fresh water sources polluted - salty seawater
2.3.3 - global
social impact of extreme weather events
drought - affect farm + water supplies
diseases - skin cancers + heatrstoke - temp increase
winter deaths decrease - winters become milder
2.3.3 - global
economic impact of extreme weather events
increase into investment - prediction + protection
repair + damage costs - $9.7 billion in 2010 pakistan
crop yields - decrease - 12% in South America - trade
2.3.3 - global
environmental impact of extreme weather events
Forests = forest fires, more pests, disease
food shortages - animals such as oranguatans
flooding south asia - increase rice yields
2.3.4 - main climate regions
Polar
LATITUDE - poles 90’N + S of equator
Characteristic:
cold air from polar cell - sinks → high pressure
spin of earth - dry, icy winds
2.3.4 - main climate regions
Temperate
LATITUDE - 50-60’N + S of equator
Characteristic:
two air cells meet - one warm from Ferrel + one cold from Polar
low pressure = created
warm air meets cold air along a weather front
frequent rainfall
UK
2.3.4 - main climate regions
Subtropical
LATITUDE - 30’N + S of equator
Characteristic:
Hadley + Ferrel cells meet = high pressure
belt of desserts - Sahara
daytime temp = more than 40’C
2.3.4 - main climate regions
Tropical
LATITUDE - at equator - 0’
Characteristic:
Hadley cells meet - belt of low pressure
air rises rapidly
regular heavy rainfall + thunderstorms
Malaysia - south east asia
2.3.4
how does global circulation work
three large scale circular movement of air = cells
act in each hemisphere
take air from Equator - move it towards the poles
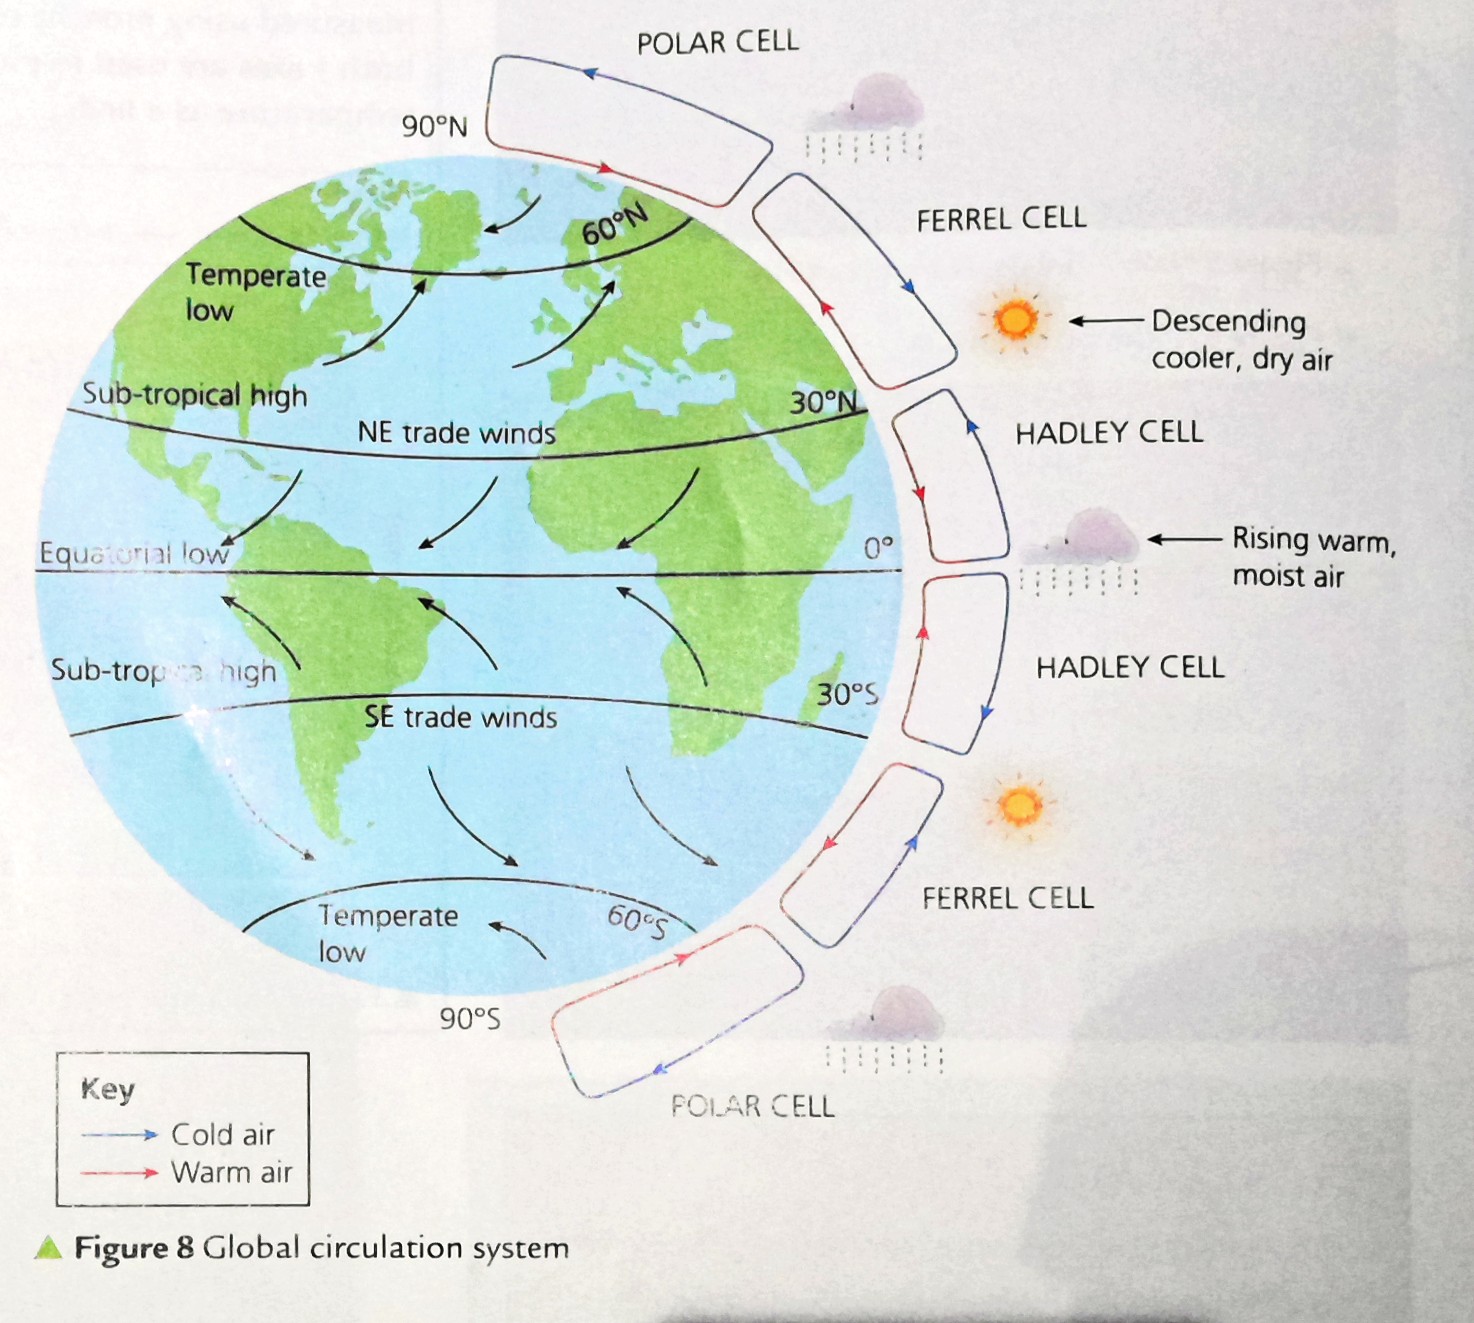
2.3.4
explain Hadley Cell
largest cells
where - equator to 30’ N and S
How - wind meets near equator - warm air rises = thunderstorms
drier air flows out towards 30’N - before sinking over subtropical areas
2.3.4
explain Ferell cell
middle cell
where - edge of hadley cell - 30’ to 60’ N + S
how -
air in this cells joins the sinking air from Hadley
travels across mid-latitude regions
until air rises along the border of cold air with polar cell
2.3.4
explain polar cell
smallest + weakest cell
where - edge of ferrel cell to poles at 90’
how
air sinks over higher latitudes at poles
flows towards mid-latitudes
where it meets with ferrel cell and rises
2.3.4
what does high pressure cause
air cools - denser and falls towards the ground → high pressure
cool air warms - as it reaches earth’s surface
cause clouds to evaporate
heavy rain at equator = most moisture gone by time air reaches subtropics
clear skies, dry hot weather
2.3.4
what does low pressure cause
causes warm air to rise → cools + condenses = clouds
precipitation occurs = rain, sleet etc
day + night = similar temp because cloud cover reflects solar radiation during day and traps it at night
2.3.4 - explain
extreme weather conditions around the world
temperature
coldest place
Vostok, Antarctica
-89.2’C
height of 3500 m
only polar cells exist here - cold air sinks - producing high pressure
causes dry icy winds - spin of earth
very cold - the sunlight does not concentrate here
polar climate
2.3.4
extreme weather conditions around the world
temperature
hottest place
Libya
57.8’C
32’N of equator
desert climate
hadley + ferrel cells meet => high pressure due to sinking dry air
2.3.4
extreme weather conditions around the world
precipitation
driest place
Aswan Egypt - average rainfall - 0.861mm er year
close to tropic of cancer
hadley + ferrel cells meet => high pressure → sinking dry air
high pressure - surface level
2.3.4
extreme weather conditions around the world
precipitation
wettest place
puerto lopez - annual rainfall = 13m
equator
rising air in hadley = rises, cools, condenses = rain
low pressure - at surface level
2.3.4
extreme weather conditions around the world
windiest place
commonwealth bay - Antarctica
exceed 240km/hour
average annual = 80km/hour
polar climate - polar cells
storms = katabatic winds - carry air from high ground due to gravity
NEW ZEALAND:
polar and ferrel cells meet at 60’S - rising air - low pressure
space left is fill by westerly winds + the easterlies coming from the poles
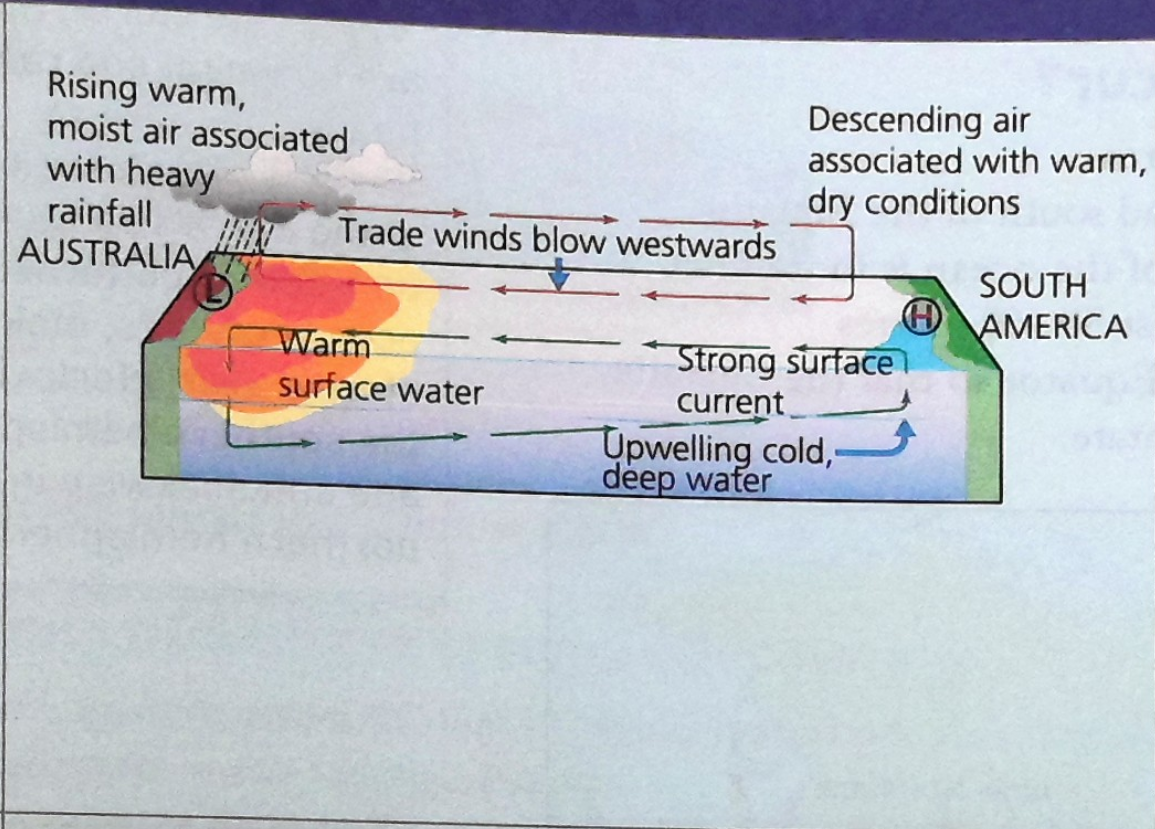
2.3.5
what happens during a normal weather event?
trade winds over Pacific push warms waters towards western pacific - australia
warm air rises - over coast of australia
cools + condenses = rainfall
east pacific = air descends = high pressure
colder water - near surface bc warm water moves west
good conditions for fishing
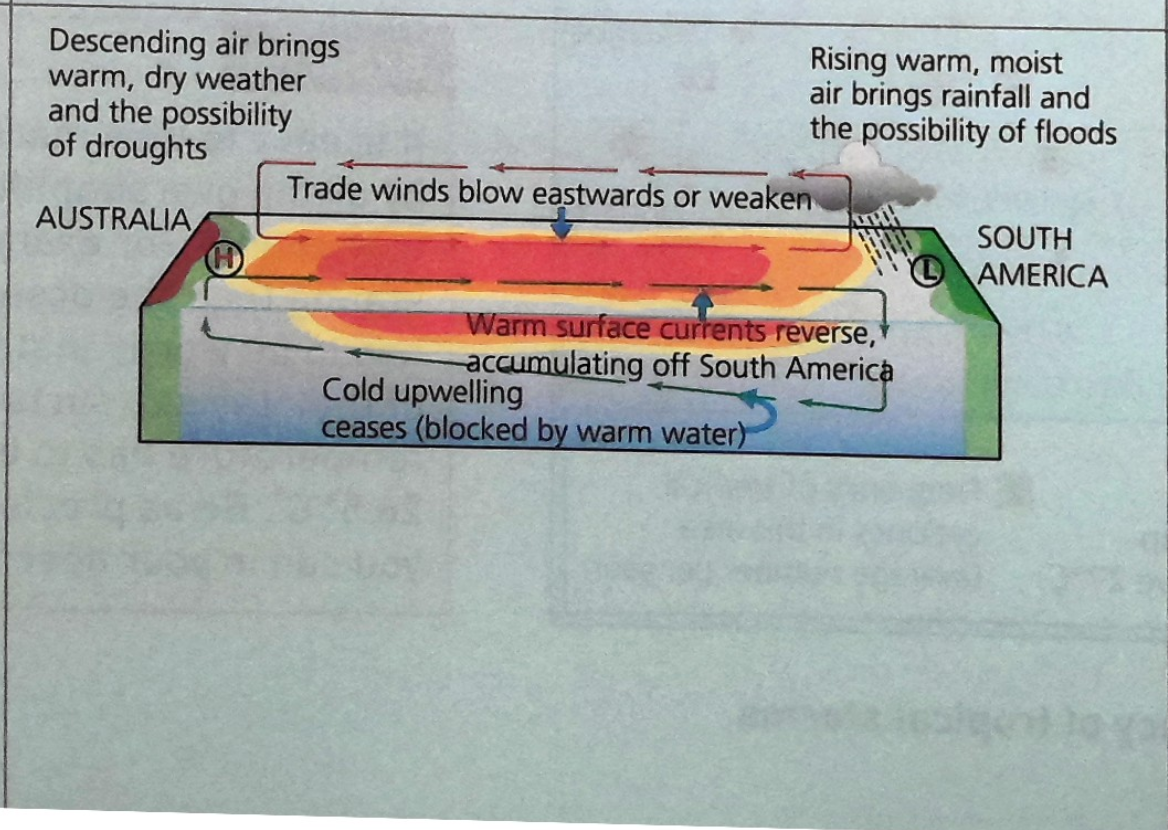
2.3.5
what happens during the el nino weather event
trade winds weaken, stop or reverse in west pacific
accumulated water in australia - moves back towards east pacific → 30cm sea level rise in peru
prevents cold water from rising + reduces fish stocks
increase in water temp in peru - rising warm water, low pressure, more rainfall → risk of flood
descending air over australia - high pressure dominates - stable, dry conditions → droughts
2.3.5
what happens during the la nina weather event
happens usually after el nino
more exaggerated version of normal event
australia - flooding
sea temp - cold around peru
2.3.5
what are tropical storms
low-pressure system in tropics
with winds - move in a spiral around a central point (eye of the storm)
winds = powerful
rain = heavy
develop into tropical cyclone
2.3.5
where do tropical storms occur
5 & 15’N and S of equator
temp of ocean surface = more than 26.5’C
ocean depth = 50-60m
500km away from equator - coriolis effect can make weather system rotate
2.3.5
explain some causes of tropical storms
LOW LATITUDE - 5 - 30’N, S of Equator
temperatures - higher here - air is heated more quickly, rises = low pressure system
Coriolis effect - system can rotate and spin
OCEAN TEMP = 26.5’C - depth - 60m
provides heat + moisture - warm air rises rapidly
LOW WIND SHEAR
wind is constant, so clouds can rise to high altitudes without being torn apart
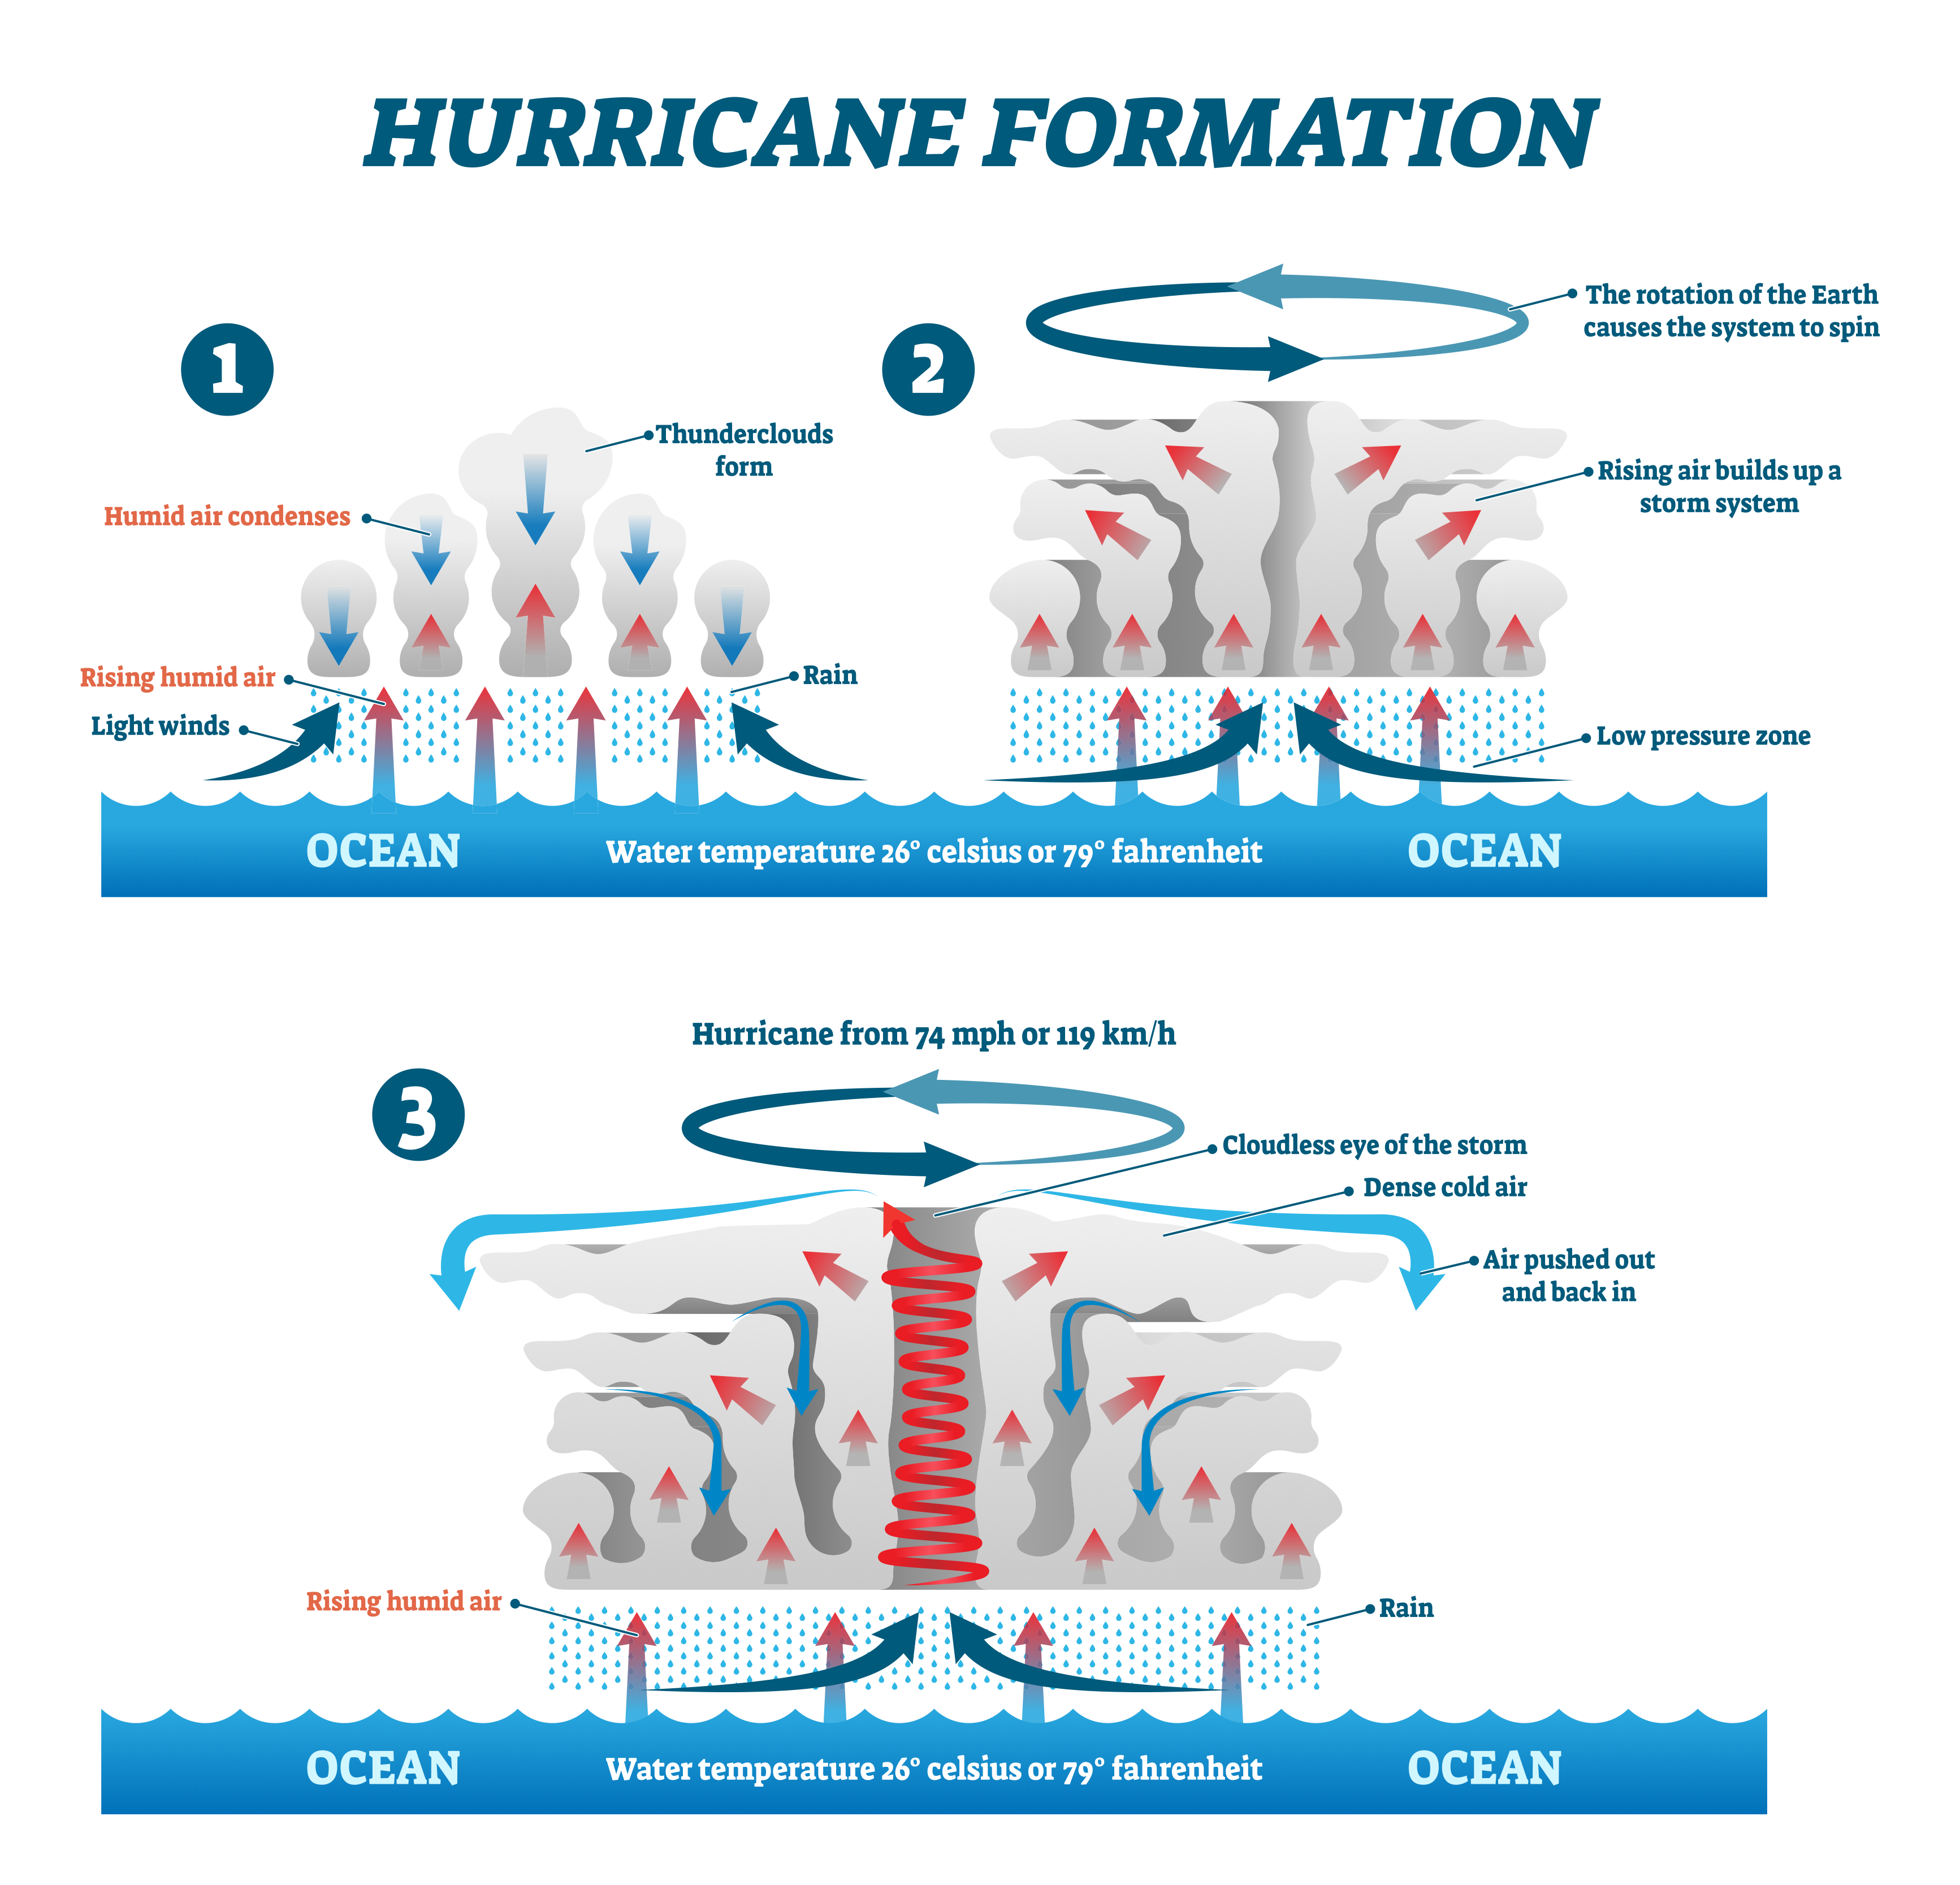
2.3.5
explain the formation of tropical storms
Air = heated above the surface warm tropical oceans → rises rapidly under low-pressure conditions
rising air draws up more airing large volumes of moisture from the ocean = strong winds.
Coriolis effect → the air to spin upwards around a calm central eye of the storm.
As the air rises, it cools and condenses to form large, towering cumulonimbus clouds = generate heavy rainfall
Heat is given off = the air cools + powers the tropical storm.
Cool air sinks into the eye → there is no cloud → drier, clear and much calmer.
tropical storm travels across the ocean bc of prevailing wind.
When the tropical storm meets land = no longer fuelled by the source of the moisture and heat from the ocean → loses power and weakens.
2.3.5
frequency of tropical storms over time
80 per year
most powerful = western pacific
june to nov - northern hemisphere
nov to april - southern hemisphere
energy released by hurricane - increased by 70% in last 30yrs
during el nino = less hurricanes in atlantic, more tropical cyclone in east of south pacific
2.3.5
what are droughts
prolonged period of time - unusually low rainfall
not enough rainfall to support people or crops
2.3.5
where do droughts occur
sahel region of Africa
middle east - affected by war + conflict
regions that are already dry - australia, parts of us, china
2.3.5
what is intertropical convergence belt
low pressure belt - encircles the earth around equator
where the trade winds from northeast and southeast meet
earth tilts - cause ICTZ to migrate between tropics of cancer + capricorn
2.3.5
physical factors that cause drought
dry, high-pressure weather system
el nino = descending air + high pressure over Australasia → drought
global temp increase - more water is lost from surface by evaporation
ITCZ may not move s far north/south as usual - depriving regions (africa) of rainfall
2.3.5
human factors that cause droughts
excessive irrigation
deforestation - reducing transpiration
overgrazing - exposing soil to wind erosion
dam building - regions downstream of water
intensive farming
2.3.5
frequency of droughts over time
met office predicts - extrme drought once in decade for UK
2013 report from NASA - warmer global temp = less rainfall , more droughts
2.3.6 - case study
intro for drought in australia
2002 - 2009
worst drought in 125 years
big dry
2.3.6 - case study
causes for the drought in australia
geographical location - subtropical area - experiences dry, sinking air → clear skies + little rain
2006 - rainfall - 40-60% below normal - over most of Australia south - Tropic of Capricorn
el nino - rainfall decrease - drier than normal
murray-darling river basin = 2 million people - lot of pressure to supply water to residents + agricultural
2.3.6 - case study
social consequences of drought in australia
People in rural areas with a lack of water and opportunity move to the cities, putting greater pressure on the population of cities.
Rural suicide rates soared, especially among young men.
2.3.6 - case study
responses to drought in australia
INDIVIDUAL
recycling waste water - shower, bath
farmer - claim financial assistance for $400-$600 per fortnight
LOCAL GOV
subsidising rainwater - storage tank for home
legislation to ban car washing + limit showers to 4 min
NATIONAL GOV
multimillion-dollar desalination plant built in Sydney
paying out 1.7 mill a day in drought relief to farmer
SCIENTISTS + ENVIRONMENTALIST
more efficient irrigation system
calculating sustainable amount of water - to create a limit that could be traded across states
2.3.6 - case study
economic consequences of drought in australia
Farmers sold cattle and sheep as they could not afford to feed them. 50% of dairy farms were lost.
Food prices rose as Australia became more dependent on imports.
Water bills rose 20% in 2008.
Tourism was negatively affected.
10,000 people directly employed by the cotton-growing industry were affected as the crop failed.
The number of dairy farms reduced by more than half.
2.3.6 - case study
environmental consequences of drought in australia
Loss of vegetation, wildlife and biodiversity. Drought is killing eucalyptus trees, which are the main source of food for koalas so this affected koala numbers as well.
Soil erosion. As the soil dries out, it becomes looser and it is easier for the wind to blow it away with knock-on effects on soil fertility and ecosystems. Grassland turned to scrubland.
Devastating bush fires as the dry vegetation burns easily and there is little water to put fires out. This destroys wildlife habitat and may have killed millions of animals.
Energy from HEP was reduced leading to more air pollution as Australia resorted to the use of fossil fuels.
Water quality reduced as toxic algal outbreaks occurred in depleted rivers, dams and lakes.