Global Change Biology Exam 2: Study Guide
1/14
There's no tags or description
Looks like no tags are added yet.
Name | Mastery | Learn | Test | Matching | Spaced | Call with Kai |
|---|
No analytics yet
Send a link to your students to track their progress
15 Terms
Give an example of how plant phenology can be affected by rainfall or photoperiod:
Describe diapause
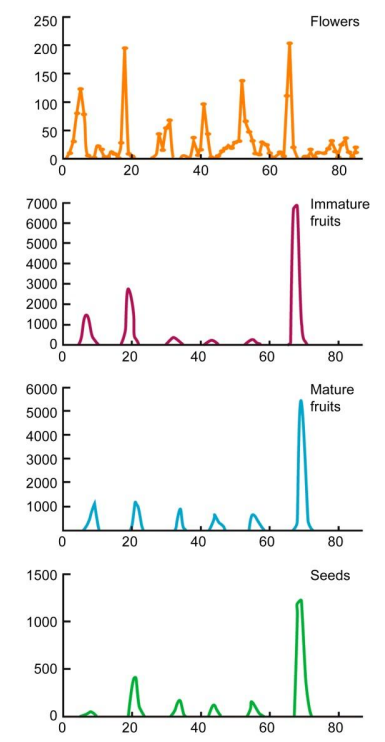
In the tropics, periods of precipitation (or DRYNESS) determine phenology of flowers, fruits, and seeds (GRAPH 1)
Phenology:
The timing and cyclical patterns of events in the natural world
In the tropics, flowering, fruiting, and seed production are often synchronized with seasonal rainfall patterns, with many species flowering at the END of the DRY season to OPTIMIZE pollination and seed dispersal.
This timing ensures that seeds germinate with the onset of the wet season, maximizing water availability for seedling establishment and growth.
The production of flowers, seeds, and fruits in a SINGLE tropical tree from a 7-year record (1980-1993)
The figure indicates that the HIGHEST production of flowers, fruits, and seeds occurs at the end of the DRY season, typically PEAKING in September.
The unusually high production in September 1992 followed by a FAILURE in fruit and seed production the next year suggests a possible resource DEPLETION effect or environmental STRESS.
This suggests that the tree's reproductive cycle is SYNCHRONIZED with seasonal changes, likely taking advantage of improved conditions for pollination, seed dispersal, or germination at that time.
Even the tropics have a dry season!
In the Amazon rainforest, which FLOWERS during the DRY season when pollinators like large bees are most active.
Its fruits then develop over the wet season and MATURE about 15 months later, ensuring seed dispersal (during the dry season) when conditions are favorable for germination.
This phenological cycle is influenced by both rainfall and photoperiod changes.
Ecological/Trophic “Mismatches”
Diapause refers to a “state of suspended growth and activity, usually during winter.”
Diapause in a given species may be INITIATED and TERMINATED by changes in photoperiod (how long exposed to sun) or temperature.
Photoperiod refers to the length of daylight a plant experiences in a 24-hour period.
Trophic linkages (feeding relationships between organisms in an ecosystem, where energy and nutrients are transferred from one trophic level to another through consumption) mean that species whose phenology isn’t DIRECTLY AFFECTED by warming may still shift due to changes in their food availability
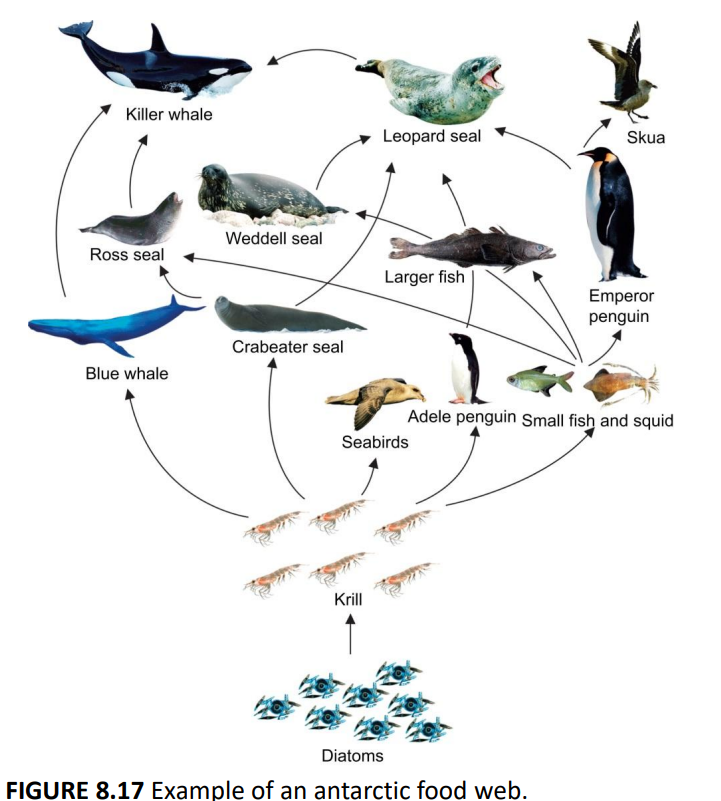
Example of an Antarctic Food Web (GRAPH 2)
“Trophic” means “feeding”
All of the arrows are trophic connections, feeding connections
All can be affected by shifting phenologies
Diatoms dependent on sea ice support a diverse food web, including great whales that feed directly on plankton and several food chains that have diatoms at their base.
In response to changes to food availability and other things, animals are showing shifts in their phenology
Describe some of diapause’s environmental effectors:
Give examples of ecological/trophic mis-matches and ways in which organisms can be affected by warming indirectly
Describe the impact that warming has had on bark beetle populations
Accelerating ice breakup and delayed ice formation.
Ice breakup and formation is shown for major rivers and lakes of North America.
Ice breakup is occurring significantly EARLIER , whereas ice formation is significantly DELAYED.
This phenomenon affects diapause—a period of suspended development in insects and other organisms—by disrupting environmental cues that regulate its timing.
Many species rely on seasonal temperature changes and photoperiod to enter and exit diapause at the right time.
Earlier ice breakup and delayed ice formation indicate warmer temperatures and extended growing seasons, which can lead to:
PREMATURE Diapause Termination – Warmer conditions might cause insects to exit diapause too early, exposing them to unpredictable weather or a lack of food sources.
DELAYED Diapause Entry – Extended warm periods may push diapause initiation LATER, increasing metabolic stress or mismatching life cycles with seasonal resources like host plants or prey.
Phenological Mismatches – Organisms relying on specific seasonal cues (e.g., insect pollinators and flowering plants) may fall out of sync, affecting reproduction and survival.
Phenological mismatches and trophic mismatches are related but not exactly the same.
Phenological mismatch refers to a timing mismatch between biological events, such as plants flowering earlier due to warming while their pollinators emerge later.
Trophic mismatch is a specific type of phenological mismatch that occurs in food webs when consumers (e.g., predators, herbivores) and their food sources (e.g., prey, plants) become misaligned, leading to disruptions in energy transfer.
Blue tit egg laying is EARLIER in warmer years
Progressive warming is resulting in an advance of MORE THAN 10 DAYS in less than two decades.
As it gets progressively WARMER earlier in Spring, the blue tit is laying its eggs progressively EARLIER in the year
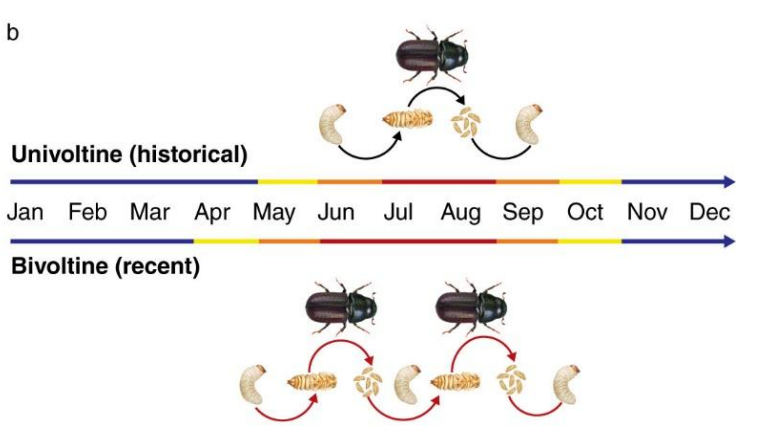
When warming shifts the timing of development, bigger life history changes and ecological impacts can result (GRAPH 1)
Under global warming many insect species develop more rapidly and have more generations per year
Univoltine and bivoltine refer to the number of generations an insect completes per year:
Univoltine species have one generation per year.
Bivoltine species have two generations per year.
With global warming, many HISTORICALLY univoltine beetles are now SHIFTING TO to a bivoltine life cycle because warmer temperatures accelerate development, allowing them to complete an additional generation within a year. This shift can have significant ecological impacts, such as:
Population Growth – More generations per year can lead to rapid population increases, potentially intensifying outbreaks of pest species.
Resource Competition – More frequent generations may increase competition for food and habitat, affecting survival rates.
Trophic Mismatches – If beetles develop faster but their FOOD SOURCES (like plants) don’t follow the same pace, it can create mismatches in food availability.
Altered Ecosystem Dynamics – Changes in beetle populations can impact predators, prey, and decomposition processes in their ecosystems.
Bark Beetle Outbreaks in Western North America
Bark beetles responding to climate change: Bark beetles, which attack and kill trees, have been THRIVING in WARMER conditions caused by climate change. This has led to a significant INCREASE in their population and activity.
Hundreds of millions of trees killed: Since 1990, these beetles have KILLED millions of trees, particularly in Western North America, spanning from Mexico to Alaska.
Spread of outbreaks in British Columbia: In the 1990s and early 2000s, bark beetle outbreaks expanded rapidly across British Columbia, a province in Canada.
This occurred in the 1990s and early 2000s.
In 2001, peak increase in outbreak area occurred.
2005 was the most affected according to graph
The lodgepole pine forests in British Columbia were especially IMPACTED, with large areas of these forests now having dead trees due to increased bark beetle activity.
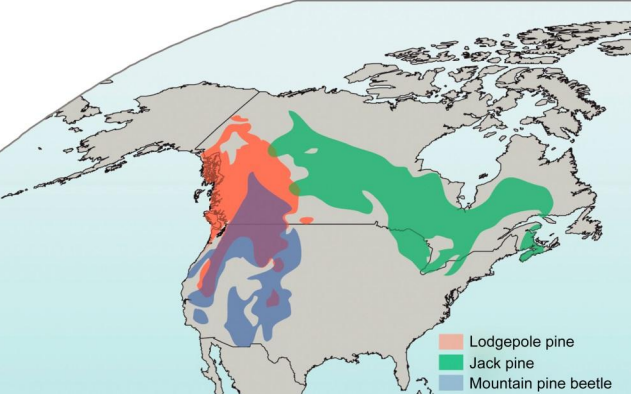
Map of Current and Potential Beetle Habitat, Lodgepole, and Jackpine (GRAPH 2)
Extension of beetle habitat UPSLOPE with warming:
As the climate warms, the beetles’ habitat is EXPANDING.
This means that the beetles are able to move into higher altitudes (or upslope areas) that they couldn't before.
This is an example of OVERFILLING
Crossing the continental divide and skirting grasslands:
With warming, beetles are now able to CROSS the continental divide (the natural barrier that once stopped them) and BYPASS the grasslands (unsuitable to them), moving through the continuous forests to the north, specifically in Canada.
Warming temperatures are enabling the beetles to spread into new areas they previously couldn't reach (HISTORICALLY ISOLATED), and they’re making their way into the eastern jack pine forests, which were ONCE UPON A TIME isolated from them by natural barriers.
Describe how warming affects snowpack and water supply in California
Describe how warming is affecting sea ice and in turn marine & polar animals
Snowpack is the ACCUMULATION of compressed layers of snow that build up over time, typically in mountainous or cold regions.
It serves as a natural reservoir, storing water in the winter and gradually RELEASING it as it melts in the spring and summer.
Snowpack is crucial for water availability, supporting agriculture, ecosystems, and human consumption downstream.
Its formation and persistence depend on temperature and precipitation patterns, making it highly sensitive to climate change, which can lead to reduced snowfall, earlier melting, and water shortages.
Snowpack Changes in a Changing Climate
Snowpack is projected to DECREASE dramatically in response to WARMING winter and spring temperatures.
Reduced snowmelt and earlier snowmelt spell TROUBLE for water availability particularly for downstream agriculture.
Affects stream flow for wild freshwater populations
In California most of our snow is accumulated in the North/Sierra Nevadas
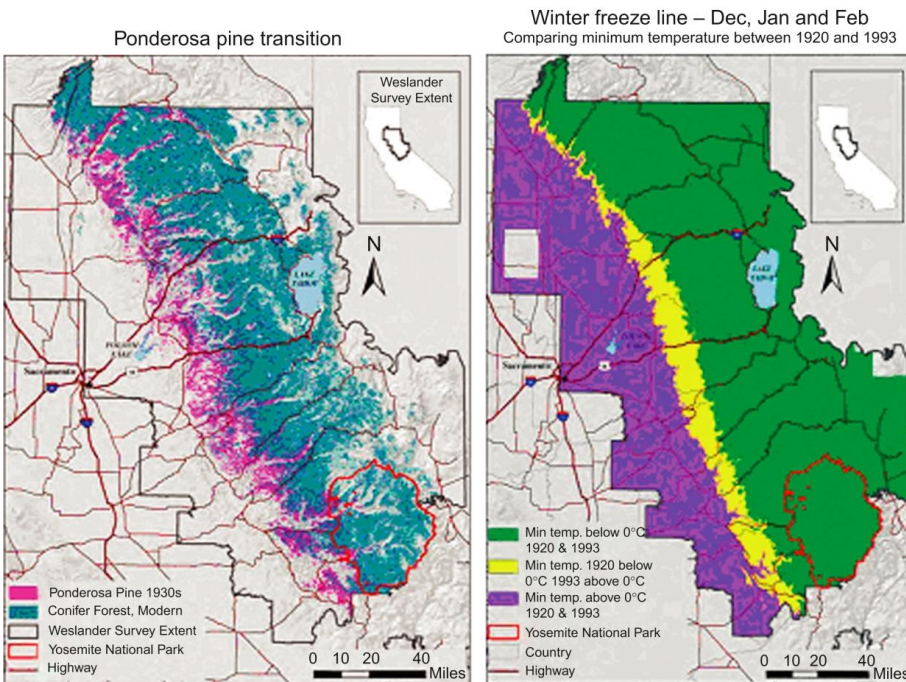
Ponderosa pine range has been REDUCED in the Sierra Nevada mountains of California since 1930 (GRAPH 1)
RESULTED IN RANGE SHIFTS IN SIERRA NEVADA
As temperatures INCREASE it is not so much ponderosa pine is exceeding its thermal tolerance, but more so that HARDWOODS (mostly Quercus sp.) are beginning to dominate in that range
So even though ponderosa pine CAN live there, it is staying LOW which is an example of underfilling (range reduction)
Upslope loss in ponderosa pine is detected by comparing vegetation surveys from the 1930s to today
The area of retreat in freezeline (yellow, right) closely corresponds to the area of pine loss (red-purple, left).
The freezeline is the elevation where temperatures consistently DROP BELOW freezing, allowing snow and ice to ACCUMULATE.
As temperatures RISE due to climate change, the freeze-line MOVES UPSLOPE, reducing snowpack and impacting ecosystems dependent on cold conditions.
Climate Change is Growing Algae in Antarctica
Warming temperatures and snowmelt are creating conditions for algae to GROW
We can observe algae growth on Antarctic snow by simply utilizing satellite images
Species which feed on algae may INCREASE such as plankton
Spread of algae growth is shown off the coast of Antarctica
We are observing changes in some of the coldest parts of the world as a result of warming
Retreating Arctic (NORTH) Sea
The Arctic Sea ice naturally retreats in the summer, but climate change has accelerated its shrinking trend rather than eliminating it entirely.
As ice cover diminishes, the once-unfeasible Northwest Passage—sought for centuries as a shipping route between Europe and Asia—is becoming increasingly navigable, reflecting the dynamic nature of Arctic ice loss.
SHIFTING TOWARDS BECOMING SMALLER AND SMALLER NOT DISAPPEARING ENTIRELY
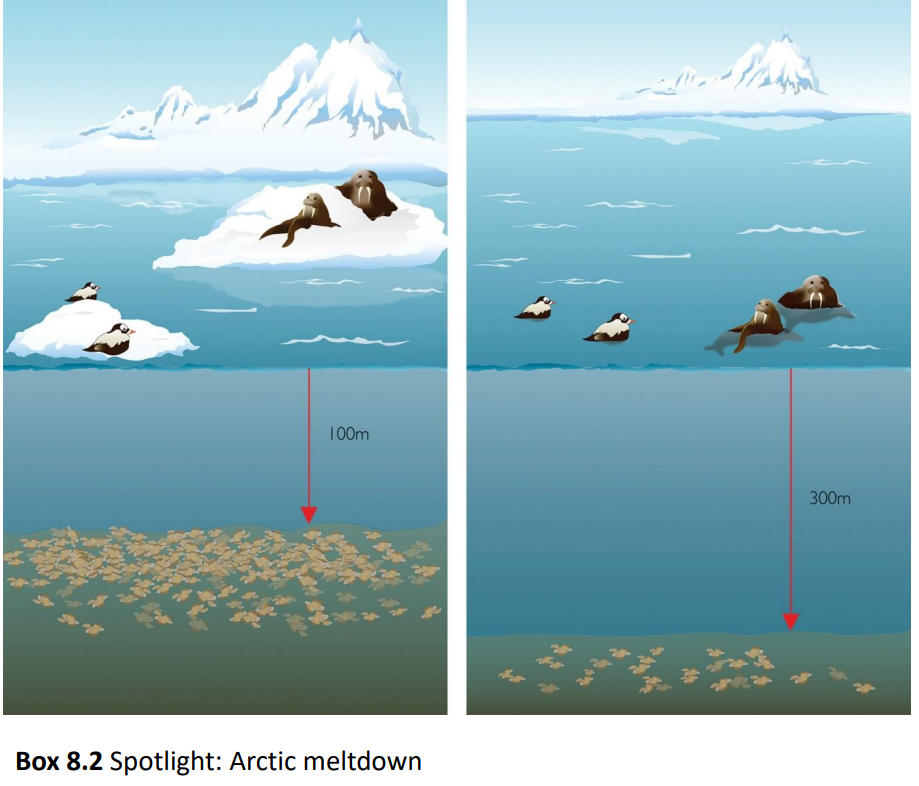
As sea ice extent decreases in the Arctic, ice retreats away from the continental shelf, requiring polar bears to return to land EARLIER in the year and diving species such as walrus and eider to dive DEEPER to obtain food.
Impact on Species like Polar Bears
They do most of their hunting on sea ice, which can have impacts on their fitness and reproductive abilities
The more that sea ice melts, the more greatly reduce their hunting/feeding grounds, the sooner it melts, the less time they have to stock up on food
Certain female polar bears need buildup of certain food to be able to reproduce and give birth
Walruses (GRAPH 2)
Typically feed by doing deep dives which are about 100 meters and then rest on sea ice
Now they have to travel even further down (300 meters) and since there is reduced ice they need to rest on water which takes more energy and is less favorable
In the climate system it is not always air temperature which affects water and ice temperature
It is more so the ocean currents/ocean circulation
Sea ice changes in the Antarctic are LESS straightforward than the continual declines in the Arctic.
In some areas Antarctic pack ice is lasting LONGER , while in other places it is DECLINING in duration.
Associated with these changes, are changes in penguin populations driven by changes in food availability as plankton habitat is altered by the changes in sea ice.
DECREASES in pack ice duration are being driven by WARMING
Penguin population DECREASING in those areas
INCREASES in pack ice duration are being driven by changes in WINDS
Penguin population INCREASING in those areas
Describe some of the causes of increased mortality during the European heat wave of 2003
Describe how heat waves are expected to affect California over the rest of this century
Heat Waves
Rather than the global temperature just rising gradually, it is the phenomenon of sudden and significant raises in temperature which are more of a risk to human health
We will experience more frequent, more severe heat waves in the future due to warming (IPCC AR5/6 WG1, high confidence)
• This puts certain human groups and many animal and plant populations at risk
Effects in the ocean are particularly complex during marine heat waves
European Heat Wave of 2003
Hottest summer in Europe since 1540 led to ~49-70,000 DEATHS alone from that summer
Heat stroke and dehydration related ailments
Height was in AUGUST
August is the month in Europe where many Europeans take vacations
Worst was in France, and most deaths were amongst the elderly (which were healthy and lived by themselves, no assisted living)
The more Mediterranean-adjacent countries are more humid so were most heavily affected
The Mediterranean Sea, which acts as a major moisture source.
Warm sea surface temperatures lead to higher evaporation rates, increasing atmospheric moisture.
Coastal regions experience more humidity because of onshore winds that bring moist air inland.
More mountainous countries like Swiss Alps were least affected
Also, some of the more inland countries (like France) which are not that hot in the Summer (as such not as many air conditioners or fans) made it more likely to die as no risk for heat waves
Heat waves this severe are expected to be 100x MORE LIKELY to occur due to human-induced warming within the next 40 years
When it's very hot, especially in cases of heat stroke risk, our body’s ability to regulate temperature is overwhelmed, leading to dehydration and electrolyte imbalances.
These disruptions affect brain function, impairing cognition, coordination, and mood—similar to alcohol intoxication.
Heat stress can cause dizziness, confusion, and lethargy, which mimic the "drunk" feeling. Additionally, blood vessels dilate to release heat, which lowers blood pressure and can lead to faintness or a woozy sensation.
Most Affected Countries in Order (IFSN)
Italy
France
Spain
Netherlands
The risk for hot and dry: Dehydration
The risk for hot and humid: Higher sweating, yet if it is humid it is less likely for your sweat to evaporate effectively and regulate your body temperature which can lead to HEAT STROKE
Heat Index
More helpful for knowing how temperature will affect your health than simple temperature numbers in isolation
Combination of both temperature and humidity
California Heat Waves
Heat wave-related mortality expected to INCREASE in the coastal areas
Nighttime temps also need to be watched
However, relative DRYNESS is what mitigates heat stress on human body
Summarize the Video we Watched on Water Whiplash in California along with what the IPCC predicts concerning water-related climate change:
What is Causing Extreme Swings in Precipitation and Drought, why does Agriculture Need to be part of the Solution? (VIDEO SUMMARY)
California has always seen major climate swings which have taken decades to clear out: drought-to-flood and back again
Global warming is turning these shifts more extreme
A symptom of global warming is the exponential increase in the ability of the atmosphere to hold water vapor
Increasing Atmospheric Sponge Effect
California is both able to soak more water up but also precipitate more
Global Warming brought back a lake in California not seen in centuries (Tulare Lake/Pa’ari) in the CENTRAL VALLEY
Disappeared in 1890 when it was diverted for irrigation?
Return of wildlife that used to live there like many
Brought back in 2023 after long recurring drought period
As climate warms, most of the US is actually expected to become WETTER overall
This phenomenon is known as WATER WHIPLASH
Drought and then flood are both becoming more extreme sometimes in the same places
Even as rainfall increases we are running out of our MOST IMPORTANT RESERVE: groundwater
Ground Water
Aquifers are natural formations of water stored in porous rock or sediment.
They are NOT manmade, although humans can create wells or pumping systems to extract the water.
Aquifers take thousands to millions of years to replenish, and EXCESSIVE EXTRACTION, particularly in arid regions, can cause damage such as subsidence, where the ground collapses due to the loss of water.
So much water gets pumped out that the sediment compacts and the groundwater sinks
11 ½ feet deeper than it once was, overall ground will sink
Higher temperatures DRY OUT the earth, new term for this is “HOT DROUGHT”
Plants are partly to blame for sucking out more and more water from soil
In wet years we use surface water, in dry years we use underground water
20% municipal uses and 80% agricultural uses in terms of which sectors use water the most
Thus agriculture is the field with the greatest potential for water conservation
Temporary solution is to drill deeper to collect from even smaller aquifers
Expanding farmlands, 15% of emissions are from manure and fertilizers
Solutions
Use LESS fertilizers and LESS farmland all together
Apply fertilizer based on plants’ needs for right amount at right time rather than just dumping it
Digital model based on drone footage is what aids to help this this is called DIGITAL AGRICULTURE
Parts of field that are always high productivity, others that are always low productivity
Farmers use most fertilizer on parts of plot which receive least sunlight and water, they are trying to overcompensate yet still get lowest yield in return which increases greenhouse gas emission and pollutes water downstream (net negative)
They are LOSING MONEY overall
Thus we should change these areas into biodiversity CONSERVATION areas making farmer’s more money by encouraging them to use LESS land
HALF of the world’s land is used for agriculture
Up to 30% of that land used for agriculture is low yield so if removed would mean just a small reduction in crop yield yet be a lot better and cheaper for the environment and farmers
The problem is that we organized our suburban and agricultural land at a time when we thought water was endless now obviously we know that that is far from being the case HOWEVER this means that the foundation of our planning based on the Colorado Basin which is DRYING OUT
We need to SHIFT agriculture from dry areas to WET areas
Despite flooding, water seeps into the ground at a SLOWER rate than we pump it out of aquifers
State is building “recharge basins” as we speak improving from 2023 to 2024 accordingly
High-tech scanning devices are helping identify these recharge basins in California
Reduce impact of flooding and prevent drying out
Instead of diverting flood waters into the ocean we should EMBRACE the flood waters and divert it to strategic locations where we can benefit from it
Over half of our global population experiences shortages
***********************************************************************************************
Scientific certainty of water-related climate changes as of IPCC AR5 (2013)
Heavy precipitation events are throughout last to next century expected to increase in frequency and intensity with medium-to-high confidence over most of the mid-latitude land masses and over wet tropical regions.
Increases in intensity and/or duration of drought is LOW confidence right now but is LIKELY on a regional to global scale in the late 21st century.
Increases in intense tropical cyclone activity are currently low confidence but predicted to BECOME "more likely than not" in the North-Wester Pacific and North Atlantic.
Increased incidence and magnitude of extreme high sea level has ALWAYS been likely but will be very likely in the late 21st century.
Changes in the global water cycle in response to the warming over the 21st century will not be uniform. The contrast in precipitation between wet and dry regions and between wet and dry seasons will mostly increase
Describe recent trends in worldwide precipitation and predicted changes in the future
Describe the patterns of global atmospheric air circulation and explain how they determine large-scale precipitation patterns
Projected Changes in Extremes are LARGER in frequency & intensity with every additional increment of GLOBAL WARMING
Frequency & increase in intensity of HEAVY 1-DAY PRECIPITATION EVENT OVER LAND that historically occurred once in 10 years is going to increase with human influence
Frequency & intensity of an AGRICULTURAL & ECOLOGICAL DROUGHT EVENT in drying regions which historically occurred once in 10 years is set ot INCREASE with human influence
Both extremes (heavy precipitation and more intense drought) are both set to increase with global warming
Extreme Drought Is INCREASING on the Western Coast of the US most especially
In spite of this, California rains are continuing to break all-time records, spurring floods and mudslides
Trends in Precipitation Over Land over the Past Century
Becoming drier towards equator (less rain)
Becoming wetter towards poles (more precipitation)
With exceptions here and there such as Southern Australia becoming super dry
Atmospheric Circulation Patterns
Air near the poles of earth is COOLED and eventually descends to the surface where it moves back towards the equator
Air is HEATED at the equator and then rises and moves towards the poles (north and south)
These Global Circulation Patterns Result in Latitudinal Patterns of Climate
Variation in mean annual precipitation with latitude.
The peaks in rainfall correspond to rising air masses, such as that of the ITCZ (intertropical convergence zone) whereas the troughs are associated with descending dry air masses
Global Warming is Expected to Shift the Hadley-Ferrel Cell Boundary POLEWARD and affect global-level precipitation patterns
The Hadley-Ferrel cell boundary is the zone where two major atmospheric circulation cells, the Hadley and Ferrel cells, meet.
The Hadley cells extend from the equator to about 30° latitude, moving warm air upward and causing rainfall.
The Ferrel cells, located between 30° and 60° latitude, carry cooler air downward, creating dry zones.
As global temperatures rise, this boundary shifts poleward, changing precipitation patterns and making tropical areas WETTER while increasing DROUGHT risk in mid-latitudes (towards poles)
Tropical areas near the equator are becoming wetter due to the shifting of the Hadley Cell boundary with global warming.
As the Earth warms, the region of rising air at the equator (the ITCZ) moves slightly poleward, increasing moisture availability in those areas.
This leads to more frequent rainfall in these regions, even though historically they’ve been drier.
Describe the relative availability of drinking water relative to global water resources
Outline the major elements of the water/hydrological cycle
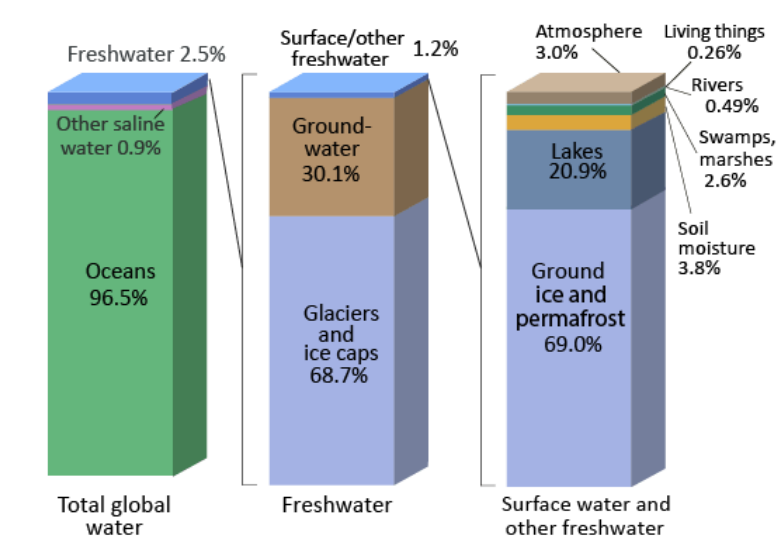
Where is Earth’s Water? (GRAPH 1)
96.5% of it is in the oceans
Only 2.5% is freshwater
Of this
68.7% is trapped in glaciers and ice caps
30.1% is groundwater
Only 1.2% of this water is on the SURFACE
Of this 1.2% Surface Freshwater
70% of it (surface fresh-water) is trapped in ground ice and permafrost
Perpetually frozen, sometimes when it thaws there will be flowage into rivers and lakes but not super significant
A lot of methane is locked up in this permafrost
21% of it is found in lakes
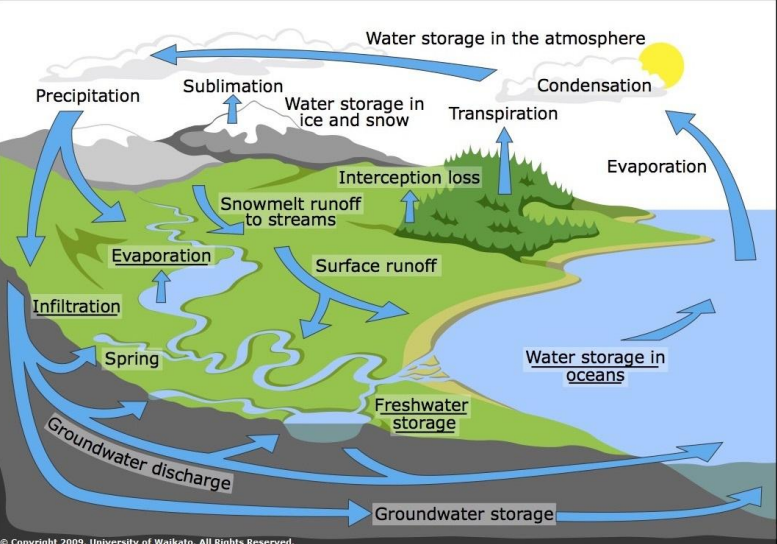
Basic Hydrological Cycle AKA Water Cycle (GRAPH 2)
Describes how water moves from one place/medium to another
Evaporation, precipitation (hail, snow, rain)
Reservoirs or stocks of water known as “freshwater storage” in reservoirs
Arrows on diagram are “FLOWS” where water either changes forms or moves from one place to another
Scientists make use of this diagram by monitoring how reservoirs change
CLOUD FOREST
A type of tropical rainforest where it is brush enough that it will transpire so much that the moisture/water vapor concentration above the forest itself condenses into clouds which results in a constant cycle of rain going back up and down
1. Water Storage in the Atmosphere
Water exists in the atmosphere as water vapor.
2. Precipitation
Water falls to the Earth's surface as rain, snow, sleet, or hail.
3. Water Storage in Ice and Snow
Some precipitation accumulates in glaciers and ice caps.
4. Sublimation
Ice and snow convert directly into water vapor without becoming liquid.
5. Snowmelt Runoff
Melting snow flows into rivers and streams.
6. Interception Loss
Some precipitation is caught by vegetation and evaporates back into the atmosphere.
7. Transpiration
Plants release water vapor into the air.
8. Evaporation
Water from lakes, rivers, and oceans turns into vapor due to heat.
9. Condensation
Water vapor cools and turns into liquid droplets, forming clouds.
10. Surface Runoff
Water that doesn’t infiltrate the ground flows over land into rivers and lakes.
11. Infiltration
Water soaks into the soil and replenishes groundwater.
12. Groundwater Storage
Water is stored underground in aquifers.
13. Groundwater Discharge
Groundwater flows back into lakes, rivers, and oceans, continuing the cycle.
14. Freshwater Storage
Some water is temporarily stored in lakes and reservoirs before continuing the cycle.
Describe several basic concepts of drought
Describe the severity of California’s recent drought and how freshwater is primarily used within the state
What exactly is Drought?
Geologist/Paleontologist: Over scale of millennia a period of aridity signifying major climatic change
Historian/Geographer/Relief Agency: Over the scale of a decade to century of low rainfall signifying migration, desertion, and famine.
Meterologist/Farmer/Insurer: Over the scale of years a rare event of significantly low seasonal rainfall signifying a need for risk management
Farmer/Agronomist/Breeder/Crop Physiologist: Over the scale of weeks to months particularly during growing season a yield which is strongly limited by lack of water signifying a decrease in water productivity
Plant Physiologist: Over the scale of days, the lack of pot watering signifies mild shock and decrease in survival
Biochemist/Molecular Biologist: Over the scale of hours, rapid desiccation and sudden exposure to strong osmotica signifies SEVERE shock and decrease in survival.
Current Drought Conditions in the US
Western Coast more dramatically affected
Hawaii also affected
Drought Severity Classification
4 levels : Palmer Drown Index
D0: Abnormally Dry | -1.0 to -1.9
Going INTO drought
D1: Moderate Drought | -2.0 to -2.9
Some damage to crops
Voluntary water-use restrictions requested
D2: Severe Drought | -3.0 to -3.9
Crop or Pasture Losses Likely
Water restrictions begin to be imposed
D3: Extreme Drought | -4.0 to -4.9
Major Losses and Shortages
D4: Exceptional Drought | -5.0 or less
Water emergencies
Just how bad did it get in Western US, especially California during great 2010s drought
In the winter of 2015-16, the ENTIRE state of California was under some degree of drought
Almost 45% of the state was rated as being in the most SEVERE drought level (D4, I repeat this is a D4 situation, this is NOT a drill!)
How was snow packing affected in Sierra Nevada?
Most of California’s snow-packing is found in the Sierra Nevada
Reduced Snow Accumulation: Warmer winters cause more precipitation to fall as rain rather than snow, diminishing overall snowpack levels.
Earlier Snowmelt: Increased temperatures result in snow melting sooner in the season, affecting water availability during drier months.
Water Supply Concerns: The diminishing snowpack threatens California's water resources, as meltwater is crucial for replenishing rivers, reservoirs, and groundwater.
Increased Wildfire Risk: Reduced snowpack and earlier snowmelt contribute to drier conditions, elevating the potential for wildfires in the region.
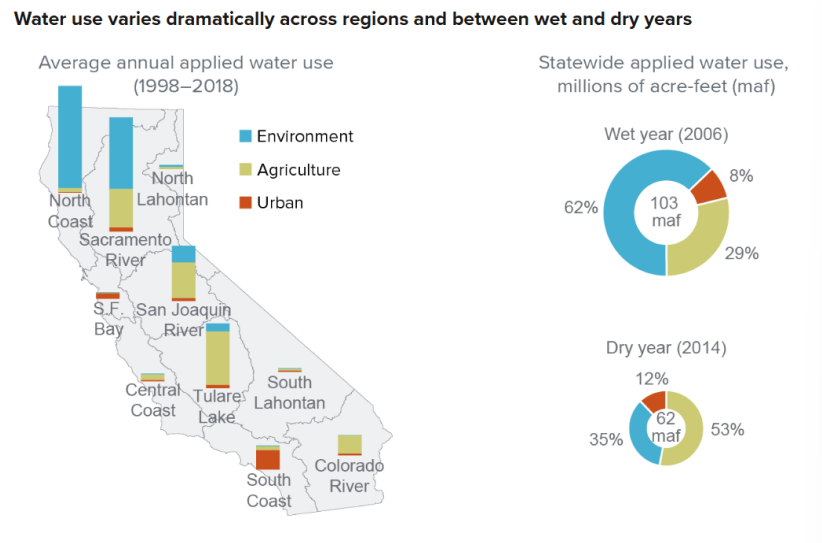
Water use in California by region & purpose
Different areas of the state use water for very different reasons
South coast is PRIMARILY urban/residential water
CENTRAL VALLEY up to Sacramento features a lot more agricultural use of water
In the northernmost region of California is used for the ENVIRONMENT; which means letting water flow through streams so that fish and ecosystems can live/thrive
During wet year (2006)
Majority of water use was towards ENVIRONMENTAL use
During dry year (2014)
Majority of water use was towards AGRICULTURAL use
In both cases, urban was always the least
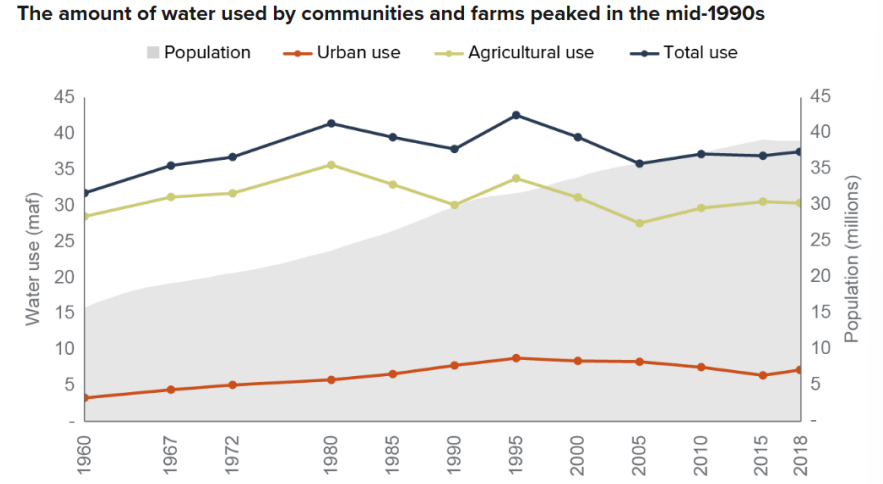
Water use in California has STABILIZED even as population grew
The amount of water used by communities and farms peaked in the mid-1990s has remained rather stagnant at the bottom in terms of urban use.
Agricultural use has gone up and down slightly but generally has stayed the same
Water use has even decreased a bit since the PEAK WATER USE PERIOD of 1995 DESPITE population growth
Outline how drought affects human civilization
Outline global trends and challenges in freshwater supply and demand
Describe the extent of water scarcity worldwide
Describe different ways in which frequency of extreme weather events can increase under climate change
How does Drought Affect Us Humans? (GRAPH 1)
Directly through LOWERED availability of freshwater
Indirectly through LOWERED crop productivity AND food production (famines)
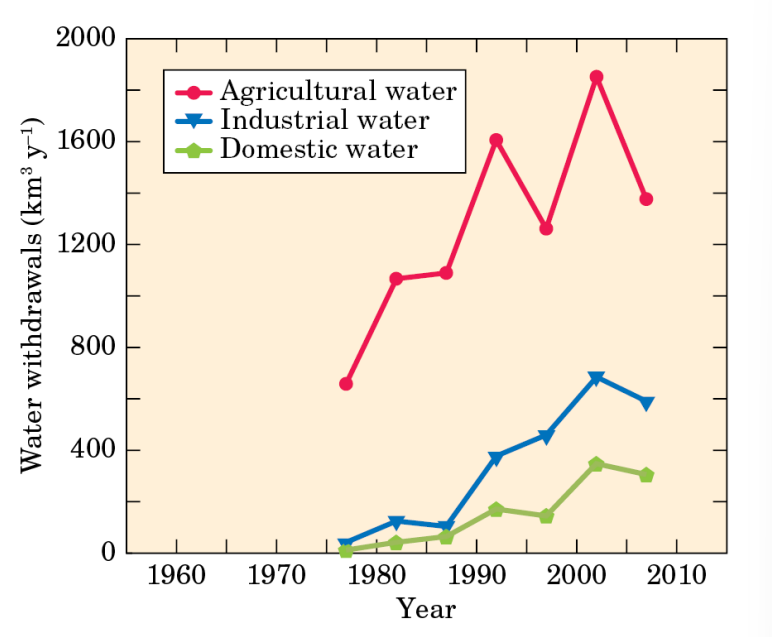
Water Use WORLDWIDE is Increasing
As it pertains to water use in agriculture (1960-2010)
Water resource use towards cultivated land is increasing
Water resource use towards irrigated land is stagnant
Water resource use of farmland per person is decreasing
As it pertains to water use overall (GRAPH 2)
Agricultural water is by far the most, and is incrasing and decreasing per decade
Industrial water use is second most, gradually increasing
Domestic water use is least, gradually increasing
FOR WATER PAY ATTENTION TO DIFFERENT SCALES AND TIME SCALES FOR THE GRAPH
How to write Ultra Paper
Non-scientific barriers to adaptation:
Political, economic, logistical, geographic challenges
Should be shortest part
In-text citations: Scientific approach, avoid direct quotes unless they’re direct, in text not footnotes
Make it (Author, Year)
Do not explain super easy things unless information on it helps detail why something is, why a big observation is
OUTLINE IT OVER THE BREAK, FIND REMAINING SOURCES, GO OVER PAPER WITH CHEN CHEN CHEN
GO THROUGH SLIDES AND DECIDE AS TO WHICH CONCEPTS TO CONSIDER!!!
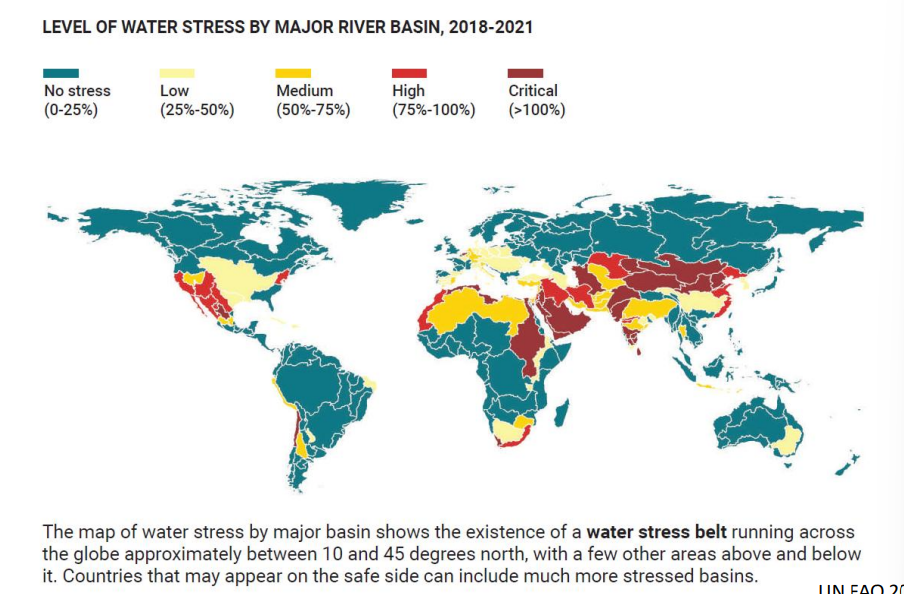
What is the water stress belt?
What is the current state of freshwater availability for human consumption?
Outline water stress in India:
Global Water Scarcity (GRAPH 1)
There is the existence of a “WATER STRESS BELT” which runs through a region roughly 10-45 degrees north of equator which includes
Map is not organized by country, it is organized by water BASIN
California and parts of Mexico
North Africa, South Africa (country)
West, Central, & South Asia
These are the regions we are MOST CONCERNED about with water shortage and scarcity
Near equator, Hadley cells, a lot of precipitation so water stress is not a problem
South and north of equator are DRY ZONES as air comes down from poles
Not purely climate related, I mean environmental on its own, rather has a lot to do with HOW humans utilize that water
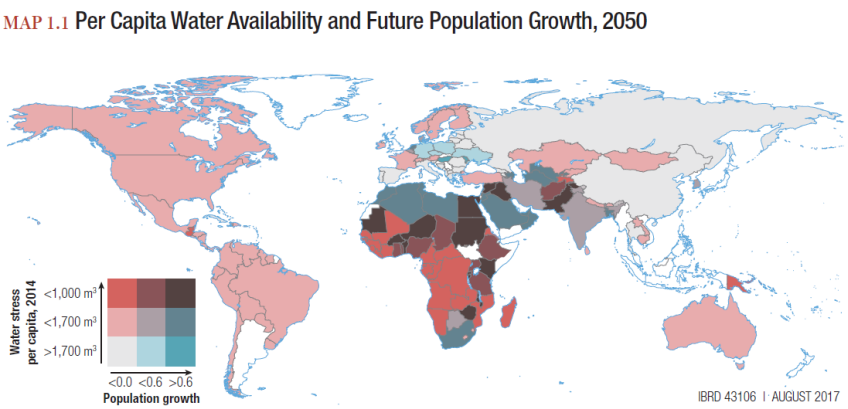
Per Capita Water Availability and Future Population Growth (GRAPH 2)
Combine concept of water stress vs where we predict population will grow
We can begin to forecast what regions of the world may encounter the greatest future water stress (or continue to)
DIagram has a “two-dimensional color coding”
The more red it is, the greater the water stress per person/capita
The light blue to the darker blue or light red to darker red, shows SCALEW of population growth
On average through Mexico, US, and Canada; medium level of water stress per person/capital (light pink); this is due to population DECLINE and moderate water stress
On Average, Approximately TEN PERCENT of the world’s population lives in countries with high-to-critical water stress levels (as per 2021)
Has remained more or less the same since 2015 though
State of Freshwater Availability for Human Consumption
The global demand for water has been increasing at a rate of about 1% per year as a function of population growth, economic development and changing consumption patterns.
Currently, ~4 billion out of ~8 billion people are estimated to experience severe water scarcity for at least one month per year due to climatic and non-climatic factors (medium confidence). Since the 1970s, 44% of all disaster events have been flood-related. (AR6 WG2 Ch.4)
Since the 1990s, water pollution has WORSENED in almost all rivers in Africa, Asia and Latin America.
The greatest increases in exposure to pollutants are expected to occur in low- and lowermiddle income countries, primarily because of higher population and economic growth and the LACK of wastewater management systems.
In countries where people are being lifted out of poverty, larger middle class, appetite for MEAT and meat consumption INCREASES
Water Stress in Cape Town
Got so bad at some point in 2018 that researchers started estimating for DAY ZERO (day where taps go dry)
Water access issues in India
54% of the 1.5 billion people living in India struggle with water scarcity
Heavy reliance on Himalayan glaciers, which are melting due to climate change
Urbanization and expansion of agriculture
Discrimination by caste, deeply rooted in culture & tradition
Trans-boundary conflicts (shared rivers between countries, states, cities, etc.)
Solutions and the potential role of the church
Lack of access to sufficient and clean water causes disease, hunger, and sanitation issues
Practical solutions
Rain-water harvesting
Waste water reuse
Christians in India can advocate for responsible governance, regulation, and greater equity in water access
The church can take a role in serving in NGOs, educating local peoples, establishing local movements
Describe different ways in which frequency of extreme weather events can increase under climate change:
Outline the primary types of extreme weather events in the U.S., their economic cost, and the estimated additional cost per unit rise in temperature:
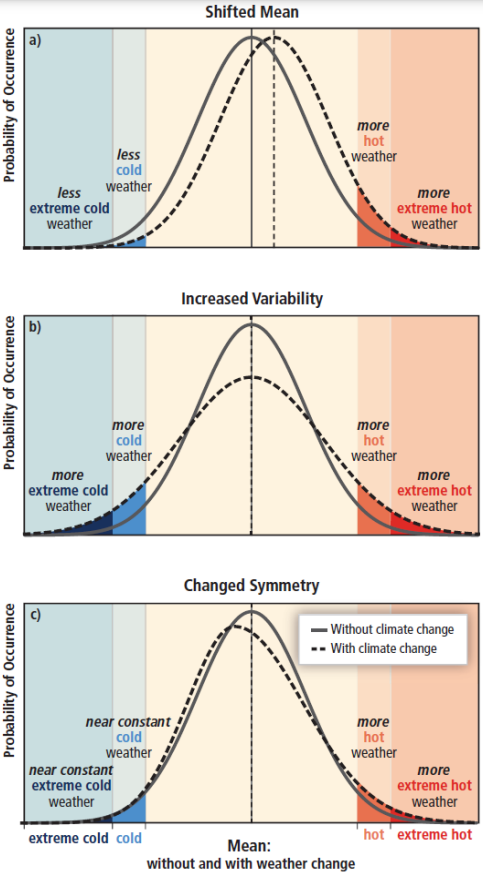
Ways in which Extreme Weather Frequencies can Change (GRAPH 1)
A big challenge with climate change is that it is not just everything gets hotter
(Here the x-axis is cold and hot weather, can be drought and flood for example)
Shifted Mean
Shifted mean, tail end and closer to middle end becomes more extreme on warm side
Have LESS of extreme cold weather
Have MORE of extreme hot weather
Increased Variability
MORE droughts and dry spells
MORE floods
Changed Symmetry
Even if mean doesn’t change, the distribution will change
Example: Areas may lean towards having longer cold season than normal for example, thus you get MORE CONSTANT extreme or normal cold weather (shifts left)
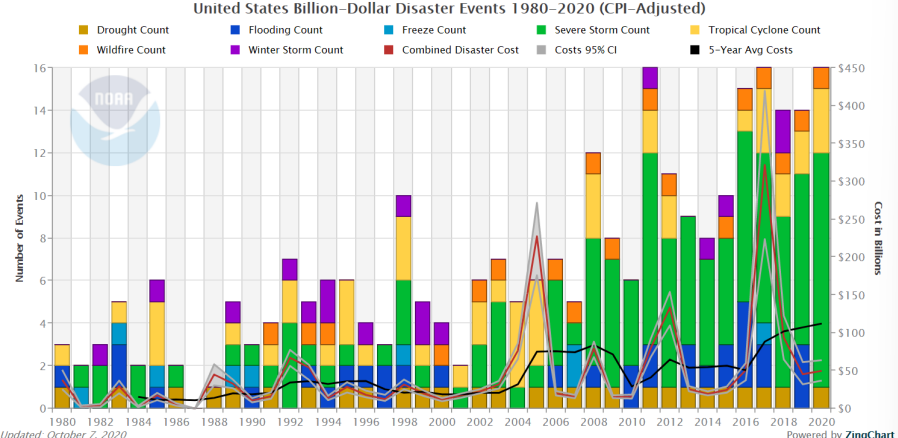
US Shatters Record for Disaster Costs in 2017
In 2017 it was the greatest at the time, totaling 306 billion!!!
Previous record year was 2005 for Hurricane Katrina which was 215 billion
US Billion-Dollar Natural/Climate Disaster Events (GRAPH 2)
Are increasing from 1980-2020 rising
Even though it is CPI-adjusted (takes inflation into account)
Most Prominent Natural Disasters
Drought
Wildfire
Flooding
Winter Storm
Freeze
Severe Storm
Tropical Cyclone
Estimated Cost Per Unit Temperature
Cost is estimated to be 1.2% of GDP per +1C on average
Overall economic cost: THIS COULD SET US BACK BY UP TO 220 BILLION DOLLARS
Estimating Economic Damage from Climage Change in the US
Some scientists have been able to project link between degree of climate change and amount of costs as a result of ensuing disasters
By the late 21st century, the poorest third of counties are projected to experience damages between 2 and 20% of county income (90% chance) under business-as-usual emissions
Big economic plan proposed by scientists but Trump is shutting down
Describe recent trends in global mean sea level rise and projected extent of rise by 2100, and list some specific regions which will be affected
Describe the negative impacts of flooding on human health and cite some recent examples
Outline some of the climate adaptations that India has adopted
Causes of Flooding
Rising sea levels
Increased frequency of strong storms
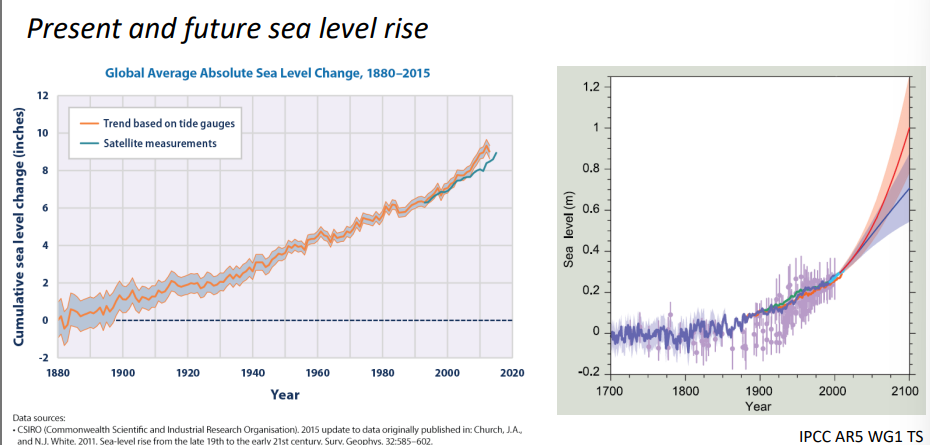
Present & Future Sea Level Rise (GRAPH 1)
Since 1880 sea level has been steadily rising
Based on many of the SSPC models, after the turn of the 21st century each of the scenarios involve continually rising sea levels due to the nature of sea level rising where even if all greenhouse emissions were to stop overnight it would still continue to rise
Projected Extent of Rise by 2100 (GRAPH 1)
Up to 1 METER in worst case scenario of sea level rise
Describe the negative impacts of flooding on human health and cite some recent examples
Health effects of climate change and sea-level rise in coastal areas
Catastrophic Flooding:
Death, mental health, displacement, disruption
Impairment of Food Quality (loss of crop land, decreased fisheries)
Food safety, marine bacteria proliferation, Sealife poisoning, malnutrition
Reduced water quality and/or access to potable water (due to salinization, flooding, or drought)
Diarrheal diseases (giardia, cholera), hepatitis, enteric fevers
Change in intensity or distribution of vector-borne disease
Changes in malaria, and other mosquito-borne infections
Effects on livelihoods, population movement, “climate refugees”
Health effects are less well described, rapid population movement could have severe health implications
Report released in 2010 by The World Bank
The number of people at risk from floods is projected to rise from 1.2 billion today to around 1.6 billion in 2050 (nearly 20% of the world’s population).
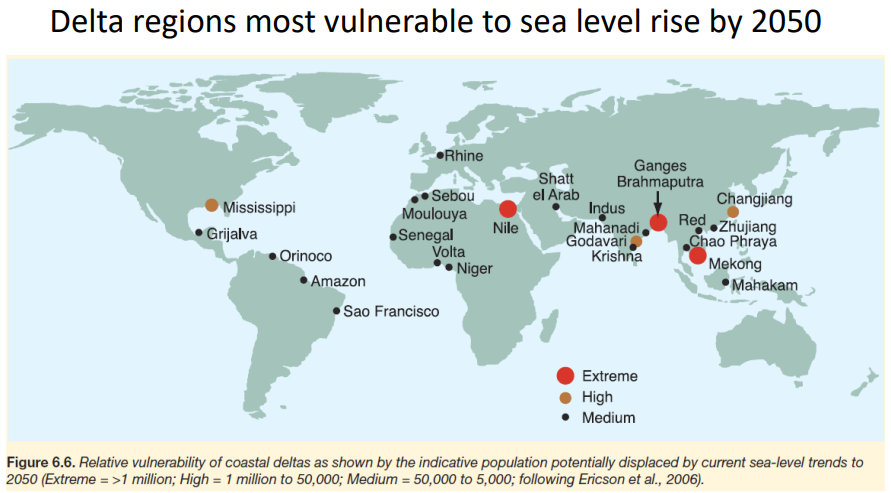
Delta regions most vulnerable to sea level rise by 2050 (GRAPH 2)
A COASTAL DELTA is a landform created at the mouth of a river where it meets a larger body of water, such as an ocean or sea. It forms from the deposition of sediment carried by the river as the water slows down.
Because of their low elevation, coastal deltas are among the most vulnerable regions to sea-level rise, storm surges, and land subsidence.
Graph depicts costal deltas at greatest risk of potential DISPLACEMENT by current sea-level trends
Bangladesh, India, Vietnam (Southeast Asia) (EXTREME RISK)
Ganges Brahmaputra (Bang, India Delta) Biggest risk
Egypt (by Nile; EXTREME RISK)
EXTREME: OVER 1 MILLION
Mississippi (high risk)
high: 1 million to 50k
Several major international cities in SE Asia are particularly at risk of severe flooding presently and in the future
Bangkok city of Thailand
Ho Chi Minh City of Vietnam
Manila city of The Philippines
Example of extreme flooding – Thailand 10/2011
Caused by unusually severe monsoon season beginning in 7/2011
83% of Thailand’s provinces affected by flooding
25% of 2011 rice crop affected
US $45.7 BILLION in economic damages/losses (4th costliest in history at the time)
Monsoon
A monsoon is a seasonal wind pattern that brings heavy rainfall to certain regions, especially in South and Southeast Asia. It is caused by temperature differences between land and ocean, leading to shifts in wind direction and moisture flow.
Wet and dry seasons – Monsoons bring intense rainfall in the wet season and dry conditions in the opposite season.
Triggered by temperature shifts – Warm landmasses draw in moist ocean air, leading to heavy rains.
Vital for agriculture – Provides water for crops but can also cause severe flooding.
Define and distinguish between the four major types of floods (FURC)
Outline some of the climate adaptations that Bangladeshhas adopted
Four major types of floods (FURC)
A flood is defined as any high flow, overflow, or inundation by water that causes or threatens damage.
FLASH floods occur in small and steep watersheds and waterways
Can be caused by short-duration intense precipitation, dam or levee failure, or collapse of debris and ice jams.
URBAN flooding can be caused by short-duration very heavy precipitation.
Urbanization creates large areas of impervious surfaces (such as roads, pavement, parking lots, and buildings) and increases immediate runoff.
Stormwater drainage removes excess surface water as quickly as possible, but heavy downpours can exceed the capacity of drains and cause urban flooding
RIVERINE flooding occurs when surface water drains from a watershed into a stream or a river exceeds channel capacity, overflows the banks, and inundates adjacent low lying areas.
COASTAL flooding is predominantly caused by storm surges that accompany hurricanes and other storms.
Low storm pressure creates strong winds that create and push large sea water domes toward the shore.
The approaching domes can raise the water surface above normal tide levels (storm surge) by more than 25 feet, depending on various storm and shoreline factors.
Dangers of Bangladesh Flooding (+2 Videos)
Bangladesh has a population of 163 million in only 1/70th of the land area of the US
The Bangladesh coastline is extremely vulnerable to rising sea levels
Flooding in Bangladesh
High population density in a monsoon-prone area
Delta region of the Ganges Brahmaputra river, most of the country is very low-lying
Water mismanagement & pollution cause GROUNDWATER to be the sole source of drinking water
By 2050, over 18 million people could be displaced by rising sea levels and loss of land
Storms cause surging of sea water, inducing salinization of farmland & groundwater, flooding and damage to houses, etc
Adaptation Efforts in Bangladesh
Government has invested in an early warning system for storms and floods
Over 2,500 concrete storm shelters have been built
Sea walls have been built in some places to hold back tides and storm surges
Low mud wall is the only thing that protects citizens of Bangladesh living off the Ganges Brahmaputra River
By end of century, entire area off the delta will be submerged
Groundwater has become nearly as salty as the ocean
Every year floods cover one-third of the land in the Bangladesh
What do I stand to lose or gain if i get what I want vs I don’t get what I want
Stakes need to be high
Always something that WILL HAPPEN or WONT HAPPEN as a result of actions
Always be able to answer why and why now