AP Micro Test Based on Notes
1/203
There's no tags or description
Looks like no tags are added yet.
Name | Mastery | Learn | Test | Matching | Spaced | Call with Kai |
|---|
No analytics yet
Send a link to your students to track their progress
204 Terms
rent
payment for land
interest
payment for capital
profit
payment for entrepreneurship
wages
payment for labor
command economy
government is in charge of aloocation of resources
pure market economy
all resource allocation is decided by individuals
mixed economy
resource allocation is somewhat made by economy and somewhat made by individuals
market economy characteristics
private ownership of resources, market prices direct resource use, income depends on individual resources, consumer demand is driving force behind production decisions
invisible hand
interactions of individual consumers and producers, each acting in their own self-interect
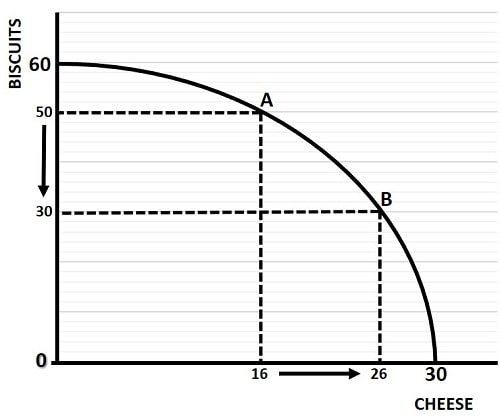
PPC Curve
PPC Curve
a graph based on the production of 2 goods used to calculate opportunity costs
Opportunity cost formula
what is given up divided by what is gained
effect of more resources on PPC
outward shift indicates increased production capacity
assumptions of PPC
fixed resources, productive efficiency, full employment, two goods
what do capital goods lead to
future consumption
what do consumer goods lead to
current consumption
absolute advantage
the ability to produce more of a good/service than someone else in the same amount of time
comparative advantage
the ability to produce something at a lower opportunity cost than someone else, given the same resources
what is trade based on
comparative advantage
output opportunity cost
involves how much output can be produced
output opportunity cost formula
possibility divided by self
input opportunity cost
shows how many resources are required
input opportunity cost formula
self divided by possibility
terms of trade
for both to benefit, the change in price must fall between the opportunity costs of the two parties
how do you consume outside of PPC
when individuals specialize according to comparative advantage and the trade ratio is better than each’s opportunity costs
explicit costs
costs involving monetary payment
implicit costs
non-monetary costs
opportunity cost
explicit cost and implicit cost together
formula to find utility maximization
MUx divided by Px = MUy divided by Py
law of demand
a decrease in the price of the good causes an increase in the quantity demanded and vise versa
income effect
when the price of a good falls, consumers experience an increase in purchasing power
substitution effect
when a price of a good increases, people will substitute less expensive goods
market demand
adding together the quantities that all consumers in the market place are willing to buy at each price
price effect on demand and supply
none
law of supply
as prices increase, quantity supplied increases
market supply curve
horizontal summation of the quantity supplied by each firm
increase in cost of product effect on supply
decrease
increase in technological advances effect on supply
increase
increase in number of sellers effect on supply
increase
if sellers think the price of a good will increase soon what will happen to supply
decrease
Elasticity of Demand formula
Ed = % change in quantity demanded divided by % change in price
Ed < 1
inelastic demand
Ed > 1
elastic demand
Ed = 0
perfectly inelastic demand
Ed = 1
unit-elastic demand
Ed= infinity
perfectly elastic demand
elastic range of demand
below equilibrium point
inelastic range of demand
above the equilibrium point
Total revenue test
if price divided by TR moves in same direction, demand is inelastic
total revenue test formula
TR = P*Q
close substitutes effect on Ed
elastic
Larger % of budget effect on Ed
more elastic
longer time to adjust to price change effect on Ed
more elastic
necessity effect on Ed
More inelastic
Formula for Elasticity of Supply
Es = % change in quantity supplied divided by % change in price
income elasticity of demand formula
% change in quantity demanded divided by % change in income
what does a positive value for income Ed mean
normal good
what does a negative value for income Ed mean
inferior good
Cross price elasticity of demand formula
% change in quantity demanded of good x divided by % change in price of good y
what does positive cross price Ed mean
substitutes
what does negative cross-price Ed mean
compliments
what does 0 cross-price Ed mean
not related
consumer surplus
difference between what buyer was willing to pay and actually paid (WTP - P)
producer surplus
difference between actual cost and what they would be willing to sell at (P - WTS)
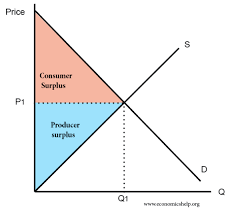
Top is consumer, bottom is producer
economic surplus
sum of CS and PS, maxed at equilibrium
Surplus
Quantity supplied > Quantity demanded
shortage
Quantity supplied < Quantity demanded
shift left on graph indicates
decrease
shift right on graph indicates
increase
quota
restriction on the quantity that can be sold in a market
deadweight loss
loss in economic efficiency, occurs when not at equilibrium
excise tax
per-unit tax
import quota
restriction on the quantity of a good that can be imported
free trade quantity imported formula
Quantity demanded - quantity supplied
production function
the way a firm combines inputs to produce an output
variable inputs
inputs that can be changed in the short run to change production
fixed inputs
inputs that cannot be changed in the short run to change production
short run
the period of time during which there are fixed inputs; a period of time too short for a firm to alter its plant capacity
plant capacity
a firm’s maximum potential level of production
what happens to marginal product at first
increases at first due to specialization and then decreases due to diminishing returns
marginal product formula
change in total product divided by change in labor
average product formula
total product divided by labor
fixed cost
a cost that must be paid even when a firm’s output is 0; a cost that is the same at all output levels
variable cost
a cost that changes as output changes
total cost
fixed costs + variable costs
marginal cost formula
change in total cost divided by change in quantity
average fixed cost formula
fixed costs divided by quantity
average variable cost formula
variable costs divided by quantity
average total cost formula
total cost divided by quantity
Shape of AVC and ATC curves
U shaped
ATC curve
falls as fixed costs are spread over more units, then rises as diminishing returns outweigh the spreading effect
MC curve
crosses through the minimum of ATC and AVC
what happens if the MC curve is below ATC
ATC is falling
what happens if MC is below ABC
AVC is falling
what happens if MC is above ATC
ATC is rising
what happens if MC is above AVC
AVC is rising
increasing returns to scale
output is increasing at a faster rate than all inputs
decreasing returns to scale
output is increasing at a slower rate than all inputs
constant returns to scale
output is increasing at the same rate than all inputs