week 3 Student T-tests and Effect sizes
1/31
There's no tags or description
Looks like no tags are added yet.
Name | Mastery | Learn | Test | Matching | Spaced | Call with Kai |
|---|
No study sessions yet.
32 Terms
one sample t-test
compare a single mean to a fixed number or ‘gold standard’
e.g. weight indicated on a can of soft drink
independent samples two sample t-test
compare two population means based on independent (unpaired) samples from the two populations or groups
e.g. do males react differently to certain drugs than females
paired t-test
compare two means based on samples that are paired/repeated measures in some way- before and after
e.g. does a hopping intervention improve bone mineral density
hypotheses for one sample t test
null- the mean height of 9 year old boys is not different to the average height on 9 year olds
alternative-the mean height is different to the reference population
parametric assumptions
continuous data
normally distributed
same variance
checking assumptions SPSS
statistic is non significant (p value>0.05)=normal distribution using Shapiro-WIlkes
two tailed
null: the population mean is equal to the hypothesised value
alternative: the population mean is not equal to the hypothesised value
one sided t-test
null: the population mean is equal to the hypothesised mean
alternative: the population mean is greater than/less than the hypothesised value
SPSS output to test hypothesis
if alpha=0.05, the p-value has to be less to reject the null hypothesis
if alpha=0.01, it is necessary for the p-value to be less than 0.01 to reject the null hypothesis
SPSS output one sample t test
if 95% confidence interval overlaps 0, we cannot be sure there is a real difference
reporting results of a one sample t-test
method: what test was performed to test what hypothesis
results: test of normality confirms what (w and p). The mean difference (mean and SD) was/not significantly different the the general population of (df, alpha level, tails)
two sample t-test assumputions
continuous ratio/interval
randomly selected
normality
equality of variance
hypotheses
null: the population means of the two groups are the same
checking equality of variances
Levene’s test of equality of variances should be non-significant
reporting an independent samples t test
method: type of test an hypothesis
results: checking assumptions, mean difference indicates (non) significiant (mean, SD, t, p, tails) conclusion
one tailed test for independent samples t test
read the significance value for one sided p from SPSS output
independent t test cautions
dont use for comparing paired subjects or comparing to a known value
preplan directional one tailed t-tests with strong evidence
small sample sizes make normality difficult to assess
performing multiple t-tests causes loss of control of the experiment-wise significance level
paired t test assumption
continuous ratio/interval data
normality of the difference
paired t test hypothesis
null: the population mean of the differences is 0
directional hypothesis
set an alpha level 0.01
reporting results paired t-test
method: test and hypothesis
results: shapiro wilkes, test indicates (non) significance-report Mean, M, SD for before and after, t(df) and p, tails to show what conclusion
samples sizes
As the size of a sample increases, the standard error becomes smaller, and the p-value tends todecrease.
Occasionally a “statistically significant” result suggests that a large sample size was used.
reporting effect sizes
Reflect the magnitude of effects obtained in experiments
Applying a test of significance only and stating the p-value may only provide information about the presence or absence of a difference.
allow the results from different sources and authors to be properly compared.
can be used to calculate the power of a statistical test (power statistics),which in turn allows the researcher to determine the sample size needed for the study.
estimates obtained in pilot studies where the sample size is often small may be an indicator of future expectations of research results.
d effect size
Assesses the Differences between groups
Groups can be compared on dichotomous or continuous variables. Where we compare groups on dichotomous variables(e.g., treated versus untreated),comparisons may be based on the probabilities of group members being classified into one of the two categories.
r effect size
Measures the Strength of a relationship/association
The effect sizes covers various measures of association involving two (or more)variables. Many of these measures are variations on the correlation coefficient
strengths of d defintions-cohen 1969
Small effect = 0.2
(0.2 <0.5)
Medium effect = 0.5
(≥ 0.50 <0.80)
Large effect > 0.8
(≥ 0.80)
cohen 1988 strength of r
Weak/Small sizes correlation / effect r = 0.10
(0.10 <0.30)
Medium sized correlation / effect r = 0.30
(≥ 0.30 <0.50)
Large sized correlation / effect r = 0.50
(≥ 0.50)
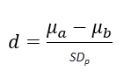
calculating parametric effect size - d statistic
d = Cohen’s d index of effect size
a = Mean of Drug A
b = Mean of Drug B
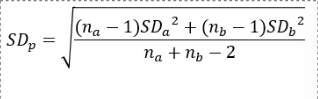
SDp = Pooled Standard Deviation
SD pooled
reporting effect size
effect size based on cohen (year) benchmark suggests a small/medium/large effect
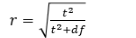
paired t test effect size
cohens r
SPSS effect sizes
do not request effect sizes in SPSS unless it uses pooled standard deviation (independent samples)