Data Analytics - Background overview
1/29
Earn XP
Description and Tags
Introduction to Data Analytics
Name | Mastery | Learn | Test | Matching | Spaced | Call with Kai |
|---|
No analytics yet
Send a link to your students to track their progress
30 Terms
What is data?
Information collected regarding a subject
expressed through rows and columns
What do rows represent in data?
Cases or observations
What do columns represent in data?
Variables
Variables
Anything that can be changed
You ask every single observation (data point) for the answer to that question
Types of Variables
Categorical (qualitative)
Quantitative
Quantitative data
Numerical values
Only price and quantity are quantitative.
Needs to use numbers to measure something getting bigger.
“How many” or “how much.
Qualitative data (Categorical)
Descriptive and subjective
Answers questions such as “why” or “how?"
Includes
Names categories
Identifiers
A categorical variable
Does not have units
Helps to combine different datasets and makes relational databases possible
Are not to be analyzed!
Time series
Data that is gathered at regular intervals over time.
Temperature of days in September
Cross-sectional data
When data for several variables are measured at the same point in time
Determining sales revenue, number of customers, and expenses for the last month of business.
Primary Data
collected by the researcher/analyst.
Very expensive to collect
However, this is good but can be tailored to your specific research question.
Secondary Data
Collected by another party, like Statistics Canada obtained by the researcher/analyst.
Population
The group you are interested in
Doesn't have to be everyone, but is still a big portion.
The population is more important than the sample.
Sampling
The population is too big and costly
Insight into the behaviours of a population
Features of Sampling
Examine a part of the whole (Questions designed to give us
answers on some characteristics of the sample)
Randomize (gives a better, representative sample)
Sample size matters (determines what we can conclude).
from the data regardless of the size of the population)
Sample statistics
Relative to the population parameter
Population parameter
Key numbers (that represent reality) used in a model for a population
For example: How much a McMaster student spends on food every day
Simple Random Sample (SRS)
A sample where every possible group of the chosen size has an equal chance of being selected.
Sampling Frame
A complete list of individuals or cases from which the sample is drawn.
Each individual is assigned a number, and random numbers are used to select the sample.
Other Random Sample Designs
Stratified sampling
Cluster sampling
Stratified sampling
Divide into similar groups (strata)
Randomly sample within each group
Main benefit: Reduces variability.
Clustered sampling
Divide into representative clusters. Randomly select clusters and survey all members.
Unbiased if clusters reflect the population.
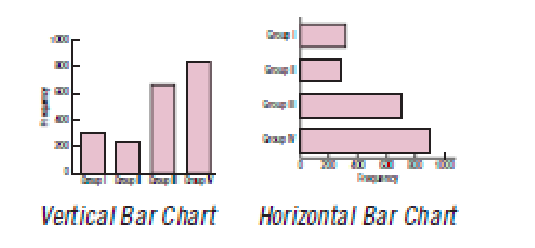
Bar Chart
Displays the distribution of one categorical variable, showing the counts for each category
Next to each other for easy comparison
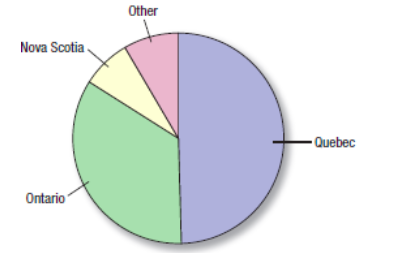
Pie Charts
Show the whole group as a circle (“pie””) sliced into pieces.
The size of each piece is proportional to the fraction of the whole in each category.
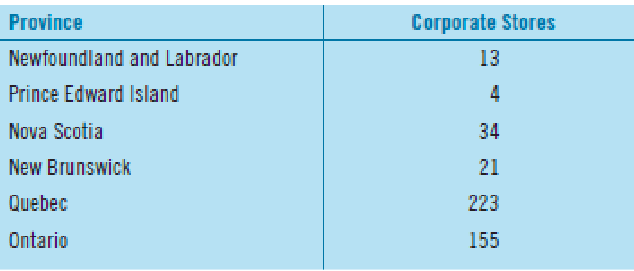
Frequency Tables
Organizes data by recording counts and category names as in the table below.
Example below
Frequency table of the number of Loblaw stores in eastern Canada
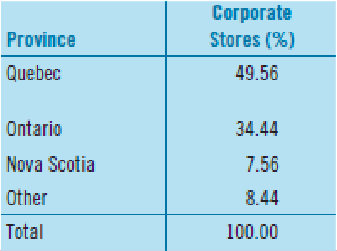
Relative frequency table
Displays the proportions or percentages that lie in each category rather than the counts
Example below:
Showing percentages of Loblaw stores in eastern Canada
Contingency Table
Shows how one variable depends on or is related to another variable.
We may display the data as a percentage – as a row
percent, column percent, or a total percent
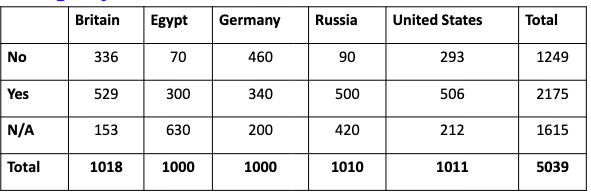
Conditional Distributions
Distribution of a variable restricted to a specified group.
Example below:
To show how social network use is varied by countries, we can display the data in a contingency table
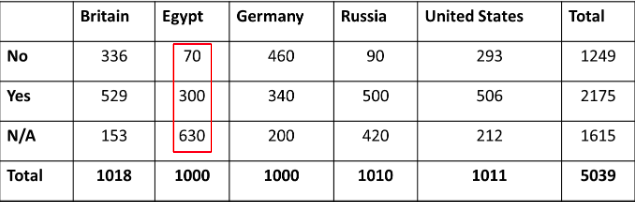
Very important to understand what these types of questions are asking
For example, the number of people from surveys who responded with YES and were from Germany: 340 / 5039
What proportion of those who are from Germany (ONLY from Germany) said yes?: 340 / 1000
Of those who said yes, what proportion were from Germany?: 340/2175

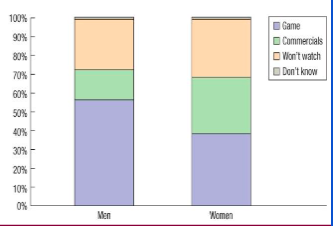
Segmented bar chart
Divides a bar proportionally into segments corresponding to the percentage in each group
How many variables are in this chart?: 2
1) Gender
2) What they watched
How many categories?: 4
1. Game
2. Commercials
3. Won't watch
4. Don't know