Empirical Exercise 2: Lottery Prizes
1/12
There's no tags or description
Looks like no tags are added yet.
Name | Mastery | Learn | Test | Matching | Spaced |
|---|
No study sessions yet.
13 Terms
question, hypothesis, theory
Question:
whether earning more money (even on a short-term basis) makes households consume more
whether a relative increase in disposable income makes people happier
whether relative income affects income patterns: without peer effects, there is no reason that my neighbours’ income should affect my consumption decisions
Hypothesis:
Keynes hypothesis: a temporary increase in income leads to higher consumption
Veblen hypothesis: People increase consumption in response to their neighbours becoming wealthier (peer effects)
Easterlin hypothesis: People’s happiness depends more on relative income than absolute income
Theory:
people consume more when their current (even temporary) disposable income increases
People consume not just for utility, but to display wealth and social status.
Despite rising average incomes over time, average happiness does not increase proportionally as absolute income stays the same
type of dataset, variables
Cross section of Dutch households
dataset includes information on their income, consumption decisions and their self-assessed levels of happiness before and after lottery
Variable_then or varibale_before: period before lottery outcome
Variable_now or variable with no label ending: period after lottery outcome
Measures households both before and after the outcomes of the (PCL): second largest national lottery in the Netherlands
Every week one postcode is chosen at random among all Dutch postcodes and the households belonging to that postcode that have purchased a lottery ticket receive a prize
main independent variable
Win_code: whether the household’s postcode was selected as a winning postcode
main dependent variable
consumption now vs before total_then
happiness now vs before happy_then
dummy: Buyer: whether a household purchased a lottery ticket
why won’t simple regression of consumption income, and happiness on income not work
-yearly income measure captures short-term levels of income but also permanent levels of income
eg individuals whose permanent income is higher will consume more today
we want to study whether individuals with higher level of income in short-term, but similar levels of permanent income, will consume more today
-regression of happiness on income
could be, for instance, that happier people are more optimistic, and therefore more productive, and therefore richer
could also be that people with health problems are both more unhappy and less productive
we want same person becomes more or less happier as a result of completely random increase in income
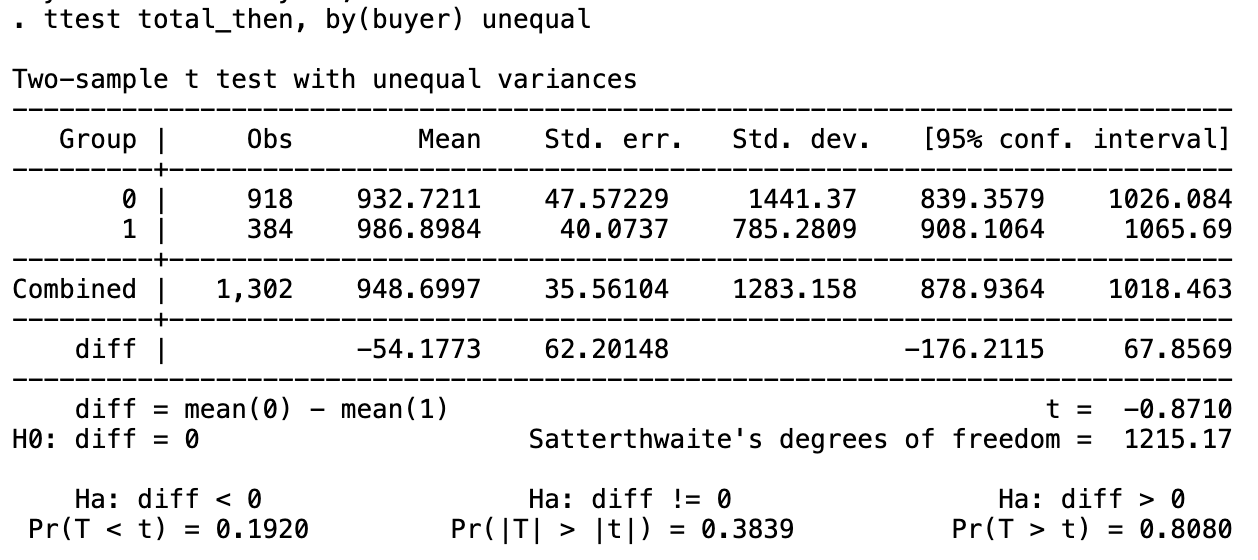
-testing whether total consumption before lottery outcome is equal for buyer and non-buyers
Buyers are households who purchased a lottery ticket
p value is not significant so no statistical difference between buyer and non-buyers consumption
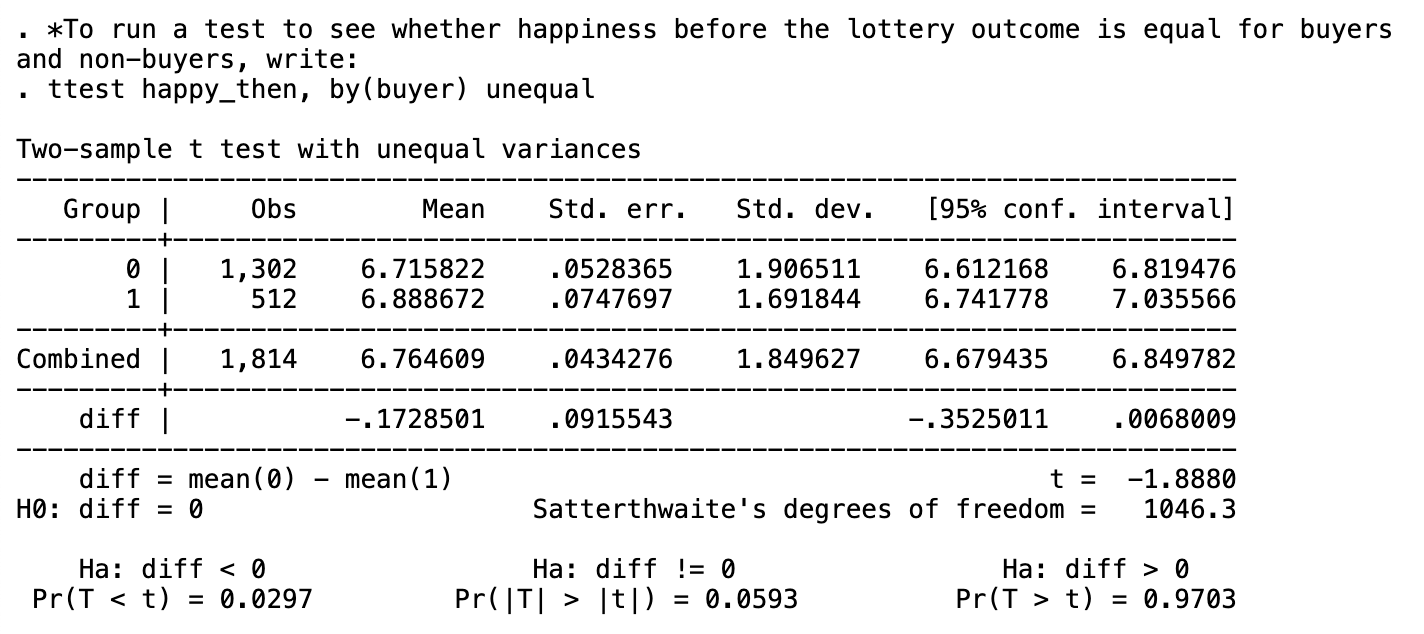
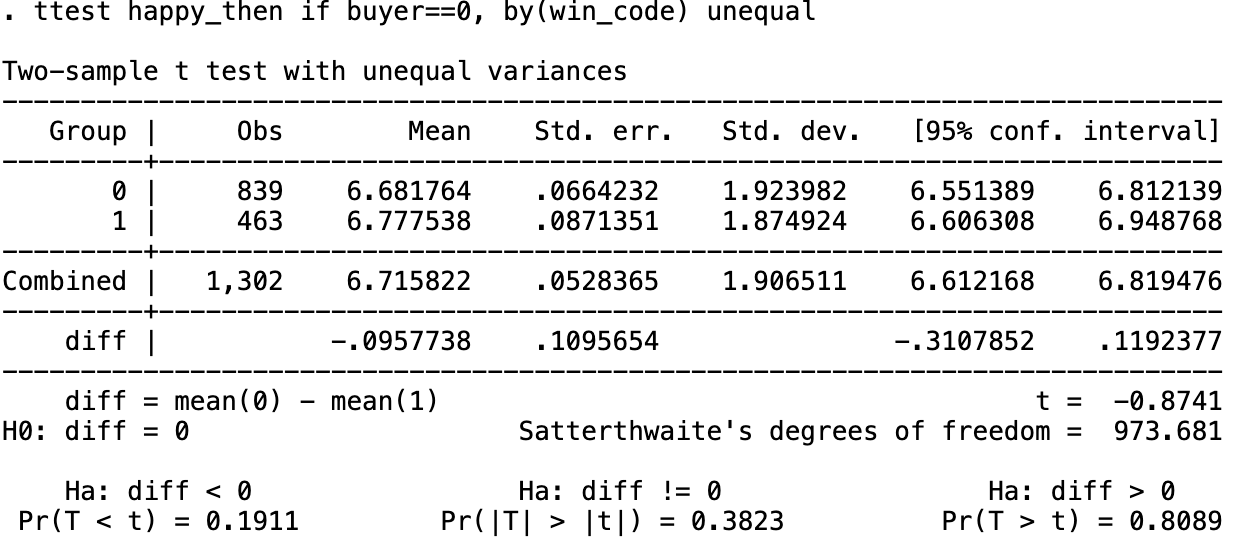
-test to see whether happiness before the lottery outcome is equal for buyers and non-buyers
p value is 0.059, so significant at the 10% level, so lottery buyers are happier before outcome of lottery
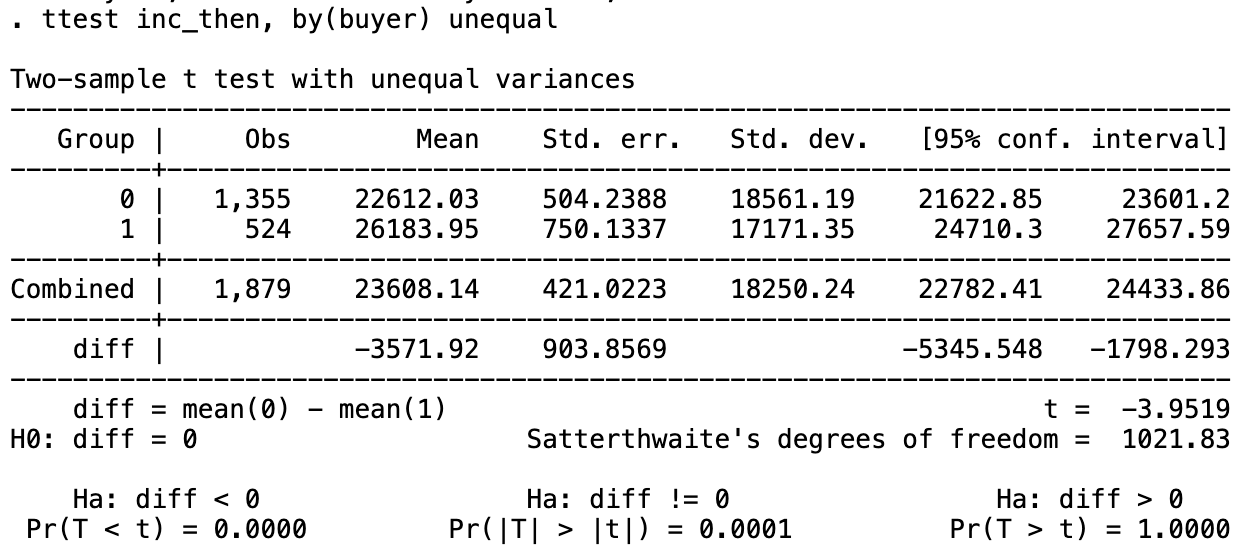
-test to see whether total annual household income varied between buyers and non-buyers, before the lottery outcome
- p value is 0.0001, highly significant 5% level so there is a statistical difference between income of buyer and non buyers
-lottery buyers earn more money
Other factors measured before lottery outcome
Expenditures on vacations; no statistical difference
Exterior home expenditures: significant p value at 5% level
Lottery buyers conduct more exterior home renovations than non-lottery buyers
Buyers and non-buyers are already different in some factors before the outcome of the lottery
winners must be buyers + non-winners will be a combination of buyers and non buyers,
implies that winners and non-winners are also already different before the outcome of the lottery
Comparing buyers in winning postcodes and in non-winning postcodes before lottery

Comparing variables like total household income, happiness, expenditure on food,renovation costs, vacation expenditure
winners are identical to buyers in non-winning postcodes in every possible way, with the exception of expenditures in food away from the home
-significant p value at 5% level meaning winner would spend more on food away from home
Probably a fluke of the data: it is sometimes the case that we will reject a null hypothesis even if the hypothesis is true
So can conclude that before the outcomes of the lottery these two groups were identical to each other
if we find any differences between the two groups after the outcome of the lottery, these differences can be safely attributed to the outcome of the lottery itself
Comparing non buyers in winning postcodes and in non-winning postcodes before lottery
-non-buyers in winning postcodes are same in total consumptions to non buyers in non winning
-p value is not significant
-non-buyers in winning postcodes are same in total happiness to non buyers in non winning
-p value is not significant
non-buyers in winning postcodes were identical on average in their consumption and happiness characteristics to non-buyers in non-winning postcodes
Test same variables: food consumption levels, transportation costs, renovation costs, vacation spending
Comparing buyers in winning postcodes and in non-winning postcodes after lottery
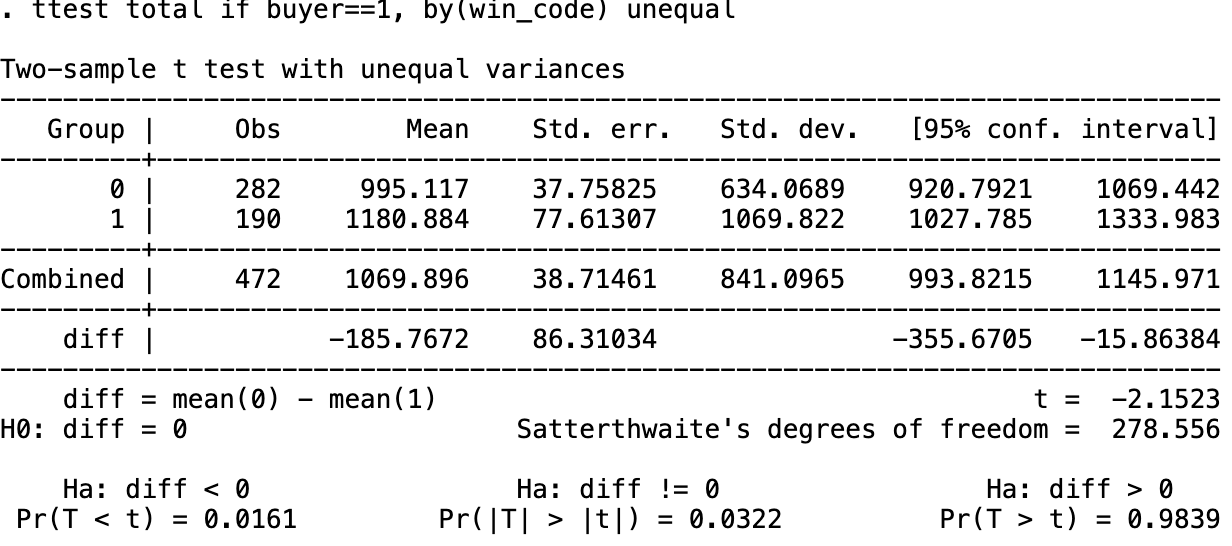
We can see that buyers in winning postcodes differ from buyers in non-winning postcodes in most dimensions
They consume more food away from home, more of other expenditures, more of total expenditures, more of exterior home renovations and more on durable expenditures. In addition their cars are less old
Keynes hypothesis implies that buyers of winning postcodes will increase their consumption levels, while buyers of non-winning postcodes will not
This evidence clearly supports Keynes’ hypothesis.
Comparing non buyers in winning postcodes and in non-winning postcodes after lottery
Non-buyers in winning postcodes differ from non-buyers in non-winning postcodes at least in some dimensions
More likely to have bought a new car and they own more cars (both in absolute terms and in efficiency units)
Veblen hypothesis implies that non-buyers of winning postcodes will increase their consumption levels as a result of observing their neighbours consume more and earn more
Non-buyers of non-winning postcodes will not be subject to the same peer effects as their neighbours won’t have won lottery
So before, non-buyers in both postcodes should be on average identical
The support for the Veblen hypothesis is limited, but it is significant that it is precisely on a high status consumption good (i.e. a car) where we find that individuals try to catch up with their neighbours
Easterlin hypothesis implies that non-buyers of winning postcodes will decrease the levels of happiness
while their absolute levels of income have not changed, their neighbours have become richer
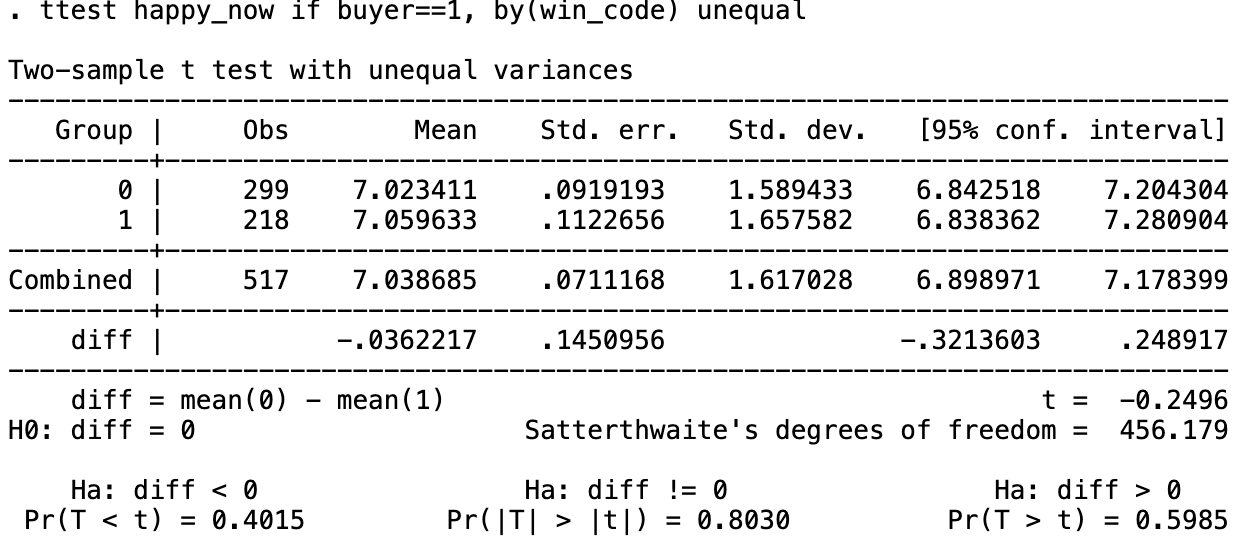
Happiness does not differ across winning and non-winning postcodes for lottery ticket buyers
-whether buyers in winning postcodes, and in non-winning postcodes, have similar happiness levels after the lottery results
no significant difference as p value is 0.803
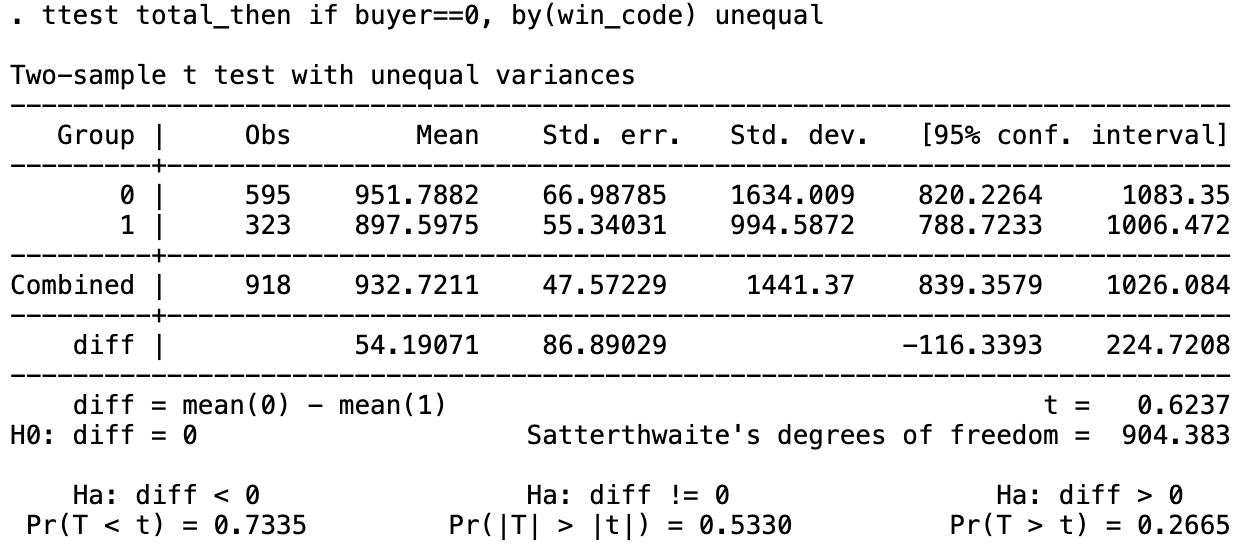
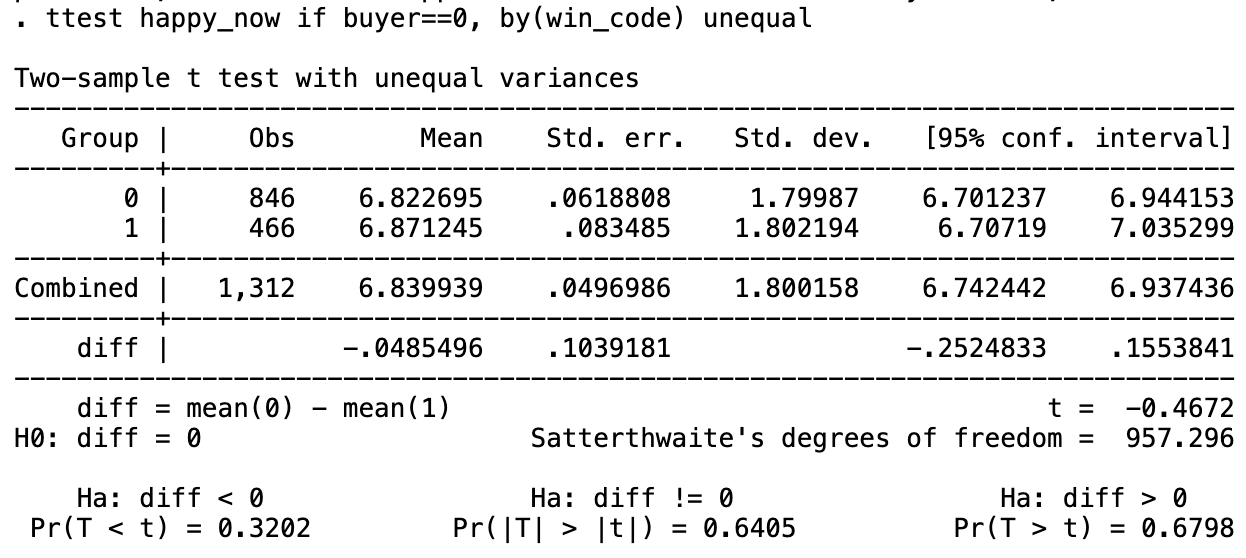
We can also see that happiness does not differ across winning and non-winning postcodes for non lottery ticket buyers
-whether non-buyers in winning postcodes, and in non-winning postcodes, have similar happiness levels after the lottery results
no significant difference as p value is 0.640
No support for the Easterlin hypothesis that it is relative income levels that matter
No support, either, for the hypothesis that it is absolute income levels that matter.
Perhaps happiness is not estimated very precisely in this dataset, or perhaps the effect of the lottery prizes is not large enough to significantly affect happiness
internal validity
Assumption 5 (identification assumption) may be violated if:
Households who buy tickets are systematically different from those who don’t (e.g., more risk-tolerant, hopeful, poorer)
Omitted variable bias could arise if unobserved characteristics (e.g., optimism, financial literacy) are correlated both with lottery participation and outcome variables
Measurement error in self-assessed happiness could bias estimates.
external validity
only Dutch households, and the lottery system is unique in structure so findings may not generalise to other countries where income, social norms or economic responses to large sums of money (windfall) increase differ
Moderate external validity for similar western high-income contexts
Size of shock may not be may not be meaningful in context with vastly diff income levels/cost of living