economics paper 1
1/14
There's no tags or description
Looks like no tags are added yet.
Name | Mastery | Learn | Test | Matching | Spaced | Call with Kai |
|---|
No analytics yet
Send a link to your students to track their progress
15 Terms
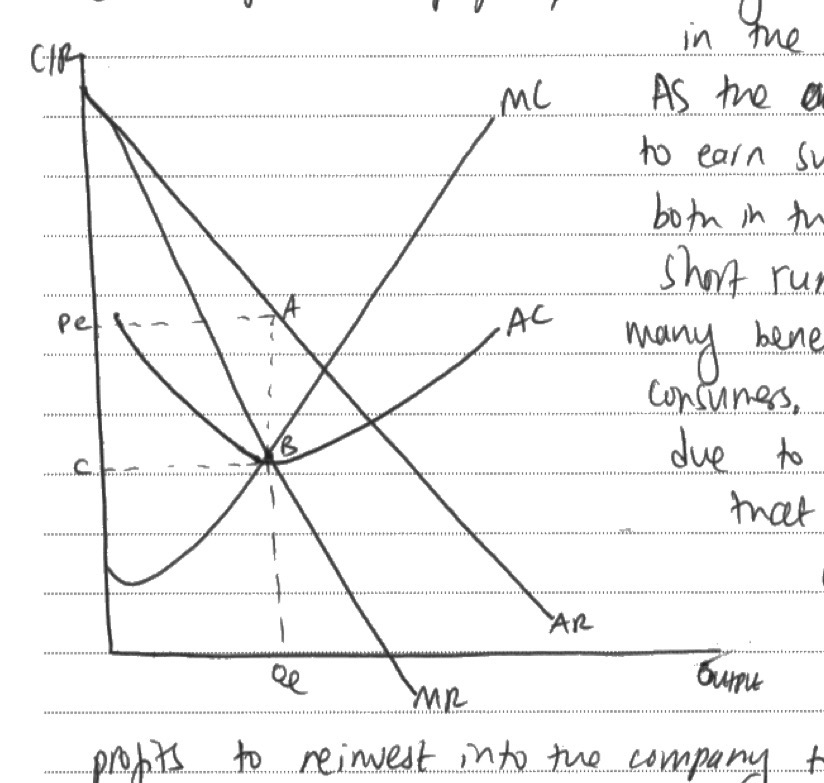
How do you use a monopoly cost and revenue diagram to find output, price, and profit?
Output/ equilibrium
MC = AR (profit max output)
Price
Go up to AR from output to show price
Profit
AR > AC supernormal profit
AR = AC normal profit
AR < AC loss
Way to remember MICRO effects for CPM
Consumers = PCCS
Price
costs rise or supply falls → firms raise prices → consumers have to pay more → some consumers buy less → consumer welfare falls
more competition → firms cut prices → consumers can buy at a lower cost → real purchasing power rises → consumers benefit
Choice
more firms enter the market → greater competition and product differentiation → consumers have more options → consumers are more likely to find a product that suits their preferences → consumer welfare rises
firms leave the market or a monopoly grows → fewer products become available → consumers have less choice → satisfaction may fall
Consumer surplus
price falls while willingness to pay stays the same → consumers pay less than they were prepared to pay → the gap between willingness to pay and actual price increases → consumer surplus rises
price rises → consumers pay closer to or above what they were happy to pay → the benefit they gain from each purchase falls → consumer surplus falls
Satisfaction/ welfare
quality improves or prices fall → consumers get better value for money → more utility is gained from consumption → consumer welfare rises
prices rise, quality falls, or choice shrinks → consumers gain less benefit from consuming the product → satisfaction and welfare fall
Producers = CRAP 🐒💩
Costs
a tax or wage increase raises business expenses → cost of production rises → AC and MC increase → firms output will decrease or prices may rise
a subsidy, better technology, or lower raw material prices reduce expenses → costs fall → firms can produce more cheaply → profitability may improve
Revenue
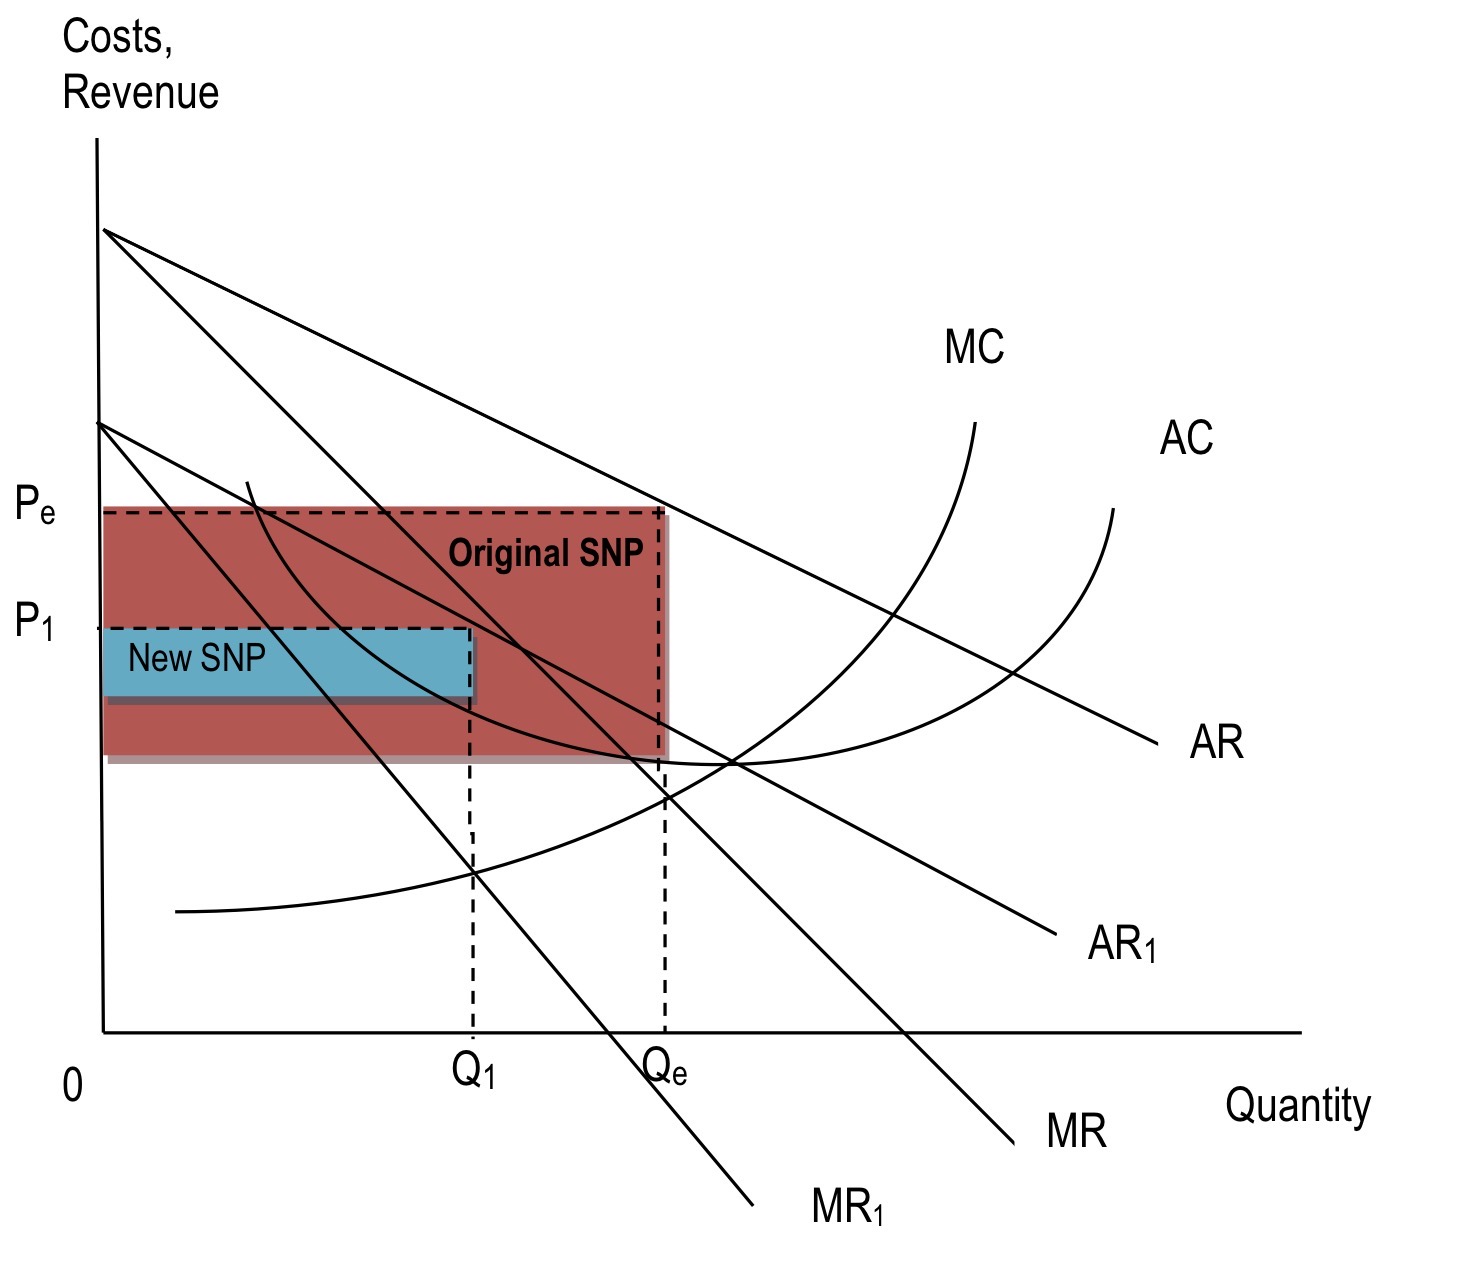
demand rises → firms sell more output (at a higher price?) TR increases
demand falls → fewer units are sold → TR falls → firms may have less money to reinvest
(Depends on PED)
Abnormal profit
Productivity/ production
investing in training or tech improves efficiency → workers produce more per hour → productivity rises → unit costs may fall → firms become more competitive
higher costs or weaker demand → firms reduce output → less production → eos may be lost → average costs may rise
Market = PECS 🐣(when u try to enter a market u PEC at the shell out of your comfort zone)
Price
the equilibrium price
Efficiency
Allocative efficiency
Price moves closer to marginal social cost or marginal cost → output is closer to what consumers and society actually want → resources are allocated better → allocative efficiency improves
Productive efficiency
Firms cut waste or gain economies of scale → average costs fall → goods are produced at lower cost → productive efficiency improves
Dynamic efficiency
Firms invest in R&D or innovation → better products and production methods develop over time → long-run efficiency improves
Competition
barriers to entry fall → more firms enter the market → competitive pressure increases → prices may fall and quality may rise
one firm gains strong market power → rivalry weakens → prices may rise and choice may fall → consumers may lose out
Supply and demand/ Sales
the amount of sales
Monopsony (labour)
Definition: where there’s only one buyer in the market
Irl when economists talk about monopsonies it means a firm has some level of monopsony power
This gives them control over the price or wage
Example: NHS, teachers
Supermarkets is also an example as they collude together to act as a monopsony
LABOUR
Lower wages/ prices → reduce costs → maximise profits
Government policies/ ways to fight monopsony power
NMW/: set above equilibrium → excess supply or unemployment for over-25s in the UK the NMW is £7.50
Trade unions: a group of workers who collectively bargain to improve employee welfare (used as NMW does not effect working conditions) → for example NUT (national union of teachers, shorter hours and higher pay)
Maximum wages: eg for footballers → many activists have suggested the maximum wage within a company could be set at 20x the lowest wage
Occupational and geographical immobility (in labour as workers have fewer alternatives so the employer has more power over them)
IN GENERAL
Regulations
Minimum price
Effect of monopsonies
On suppliers: lower revenue and profit, less investment, risk of exit, lower dynamic efficiency, pressure to cut costs
On consumers: lower prices/ affordability, lower quality, less choice
Evaluation: depends of whether lower costs are passed on, increases efficiency, not pure monopsony so exploitation is limited, depends on elasticity of supply (labour), short run/long run effects, gov intervention may reduce damage, depends on size of suppliers, reduce dynamic efficiency,
Information gaps: incomplete information, asymmetric information
Information gaps: when consumers or producers lack the information needed to make an informed decision
Information gaps happen when consumers or producers do not have full information, so they make poor decisions. This can cause market failure because goods may be overconsumed, underconsumed, overproduced, or underproduced. As a result, resources are misallocated and allocative efficiency falls.
Incomplete information: when someone doesn’t have full information about the benefits or costs of their decision
Asymmetric information: when one party knows more than another party in a transaction
Information gaps happen when consumers or producers do not have full, accurate, or clear information, so they make uninformed decisions.
Why they matter:
They can cause market failure because the wrong amount of a good is consumed or produced, so resources are misallocated and allocative efficiency falls.
Core chain:
Information gap → poor decision-making → overconsumption / underconsumption / overproduction / underproduction → market failure
Consumer information gaps:
consumers may not understand the risks of a product
consumers may not know the true quality of a product
consumers may misunderstand labels
consumers may underestimate long-term costs or benefits
Producer information gaps:
firms may misjudge consumer demand
firms may produce too much or too little
overproduction can lead to waste
lack of market knowledge can reduce efficiency
Examples:
Merit goods: consumers underestimate benefits, so they underconsume
Demerit goods: consumers underestimate harm, so they overconsume
Food waste: consumers misunderstand best before and use by, or producers overestimate demand
Merit goods chain:
Consumers underestimate benefits → demand too low → underconsumption → market failure
Demerit goods chain:
Consumers underestimate harm → demand too high → overconsumption → market failure
Food waste chain:
Consumers/producers lack information → poor decisions or overproduction → food is wasted → resources are misallocated
Main efficiency problem:
Information gaps lead to allocative inefficiency.
Evaluation:
it may not just be information gaps; sometimes it is irrational behaviour
government may try to fix the problem through better labelling, education, advertising, regulation, taxes or subsidies
the extent depends on the product and how informed consumers/producers are.
Irrational behaviour
Irrational behaviour is when consumers make decisions that are not in their own best interests, even when they have enough information.
Why it matters:
It can cause market failure because consumers may make poor choices, so resources are misallocated and allocative efficiency falls.
Core chain:
Irrational behaviour → poor choices → overconsumption / inefficient decisions → market failure
Examples of irrational behaviour:
impulse buying
overconsumption
poor self-control
present bias
addiction or habit
ignoring long-term consequences
Difference from information gaps:
Information gaps = consumers do not know enough
Irrational behaviour = consumers may know the facts but still choose badly
Main efficiency problem:
Irrational behaviour leads to allocative inefficiency because too many or too few resources are allocated to certain goods and services.
Evaluation:
sometimes the problem is information gaps, not irrational behaviour
irrational behaviour is more important in some markets than others
government can try to reduce it using taxes, nudges, regulation, or education
however, government policies may not fully change consumer behaviour
Merger
A merger is when two firms join together to become one business.
Why firms merge:
increase market share
reduce competition
gain economies of scale
increase profit
enter new markets
gain more market power
Types of merger:
Horizontal merger
two firms in the same industry and at the same stage of production merge
example: two supermarkets merge
Vertical merger
two firms at different stages of production merge
example: a manufacturer merges with a supplier
Conglomerate merger
two firms in different industries merge
example: a food company merges with a clothing company
Advantages of mergers:
economies of scale
greater market power
lower average costs
removal of duplication
possible survival against bigger rivals
Disadvantages / problems of mergers:
integration costs: legal, rebranding, retraining, management time spent reorganising the business
rationalisation costs: redundancy payments, reconstructing departments
diseconomies of scale
reduced competition
higher prices
less choice
regulatory scrutiny
Useful chain:
Merger → larger market share → less competition → more market power → possible higher prices / lower choice
Evaluation:
economies of scale may take time
the firm may become too large and suffer diseconomies of scale
lower costs may not be passed on to consumers
competition authorities may block the merger
some mergers may help firms compete more effectively
How do you label and use a monopoly cost and revenue diagram?
Pmax = MC = MR → stack up to P
Pallo = P = MC (the value consumers place on the last unit produced is equal to the opportunity cost of the resources used to make it. This shows the socially optimal level of output.)
Pprod = when AC is at its lowest
What are the main types of efficiency in economics and how do you apply them?
1. Allocative efficiency
producing the right quantity
occurs where P = MC
means consumer benefit from the last unit equals the cost of producing it
if price is above marginal cost, too little is being produced
How to apply it:
monopoly: usually allocatively inefficient because it produces where MC = MR, not P = MC
taxes/subsidies: can reduce or improve allocative efficiency depending on whether output moves closer to the socially efficient level
externalities: government intervention may improve allocative efficiency by correcting overconsumption or underconsumption
2. Productive efficiency
producing at the lowest average cost
occurs where AC is at its lowest point
means the firm is producing as cheaply as possible per unit
How to apply it:
mergers: economies of scale may lower AC and improve productive efficiency
monopoly: may be productively inefficient if it does not produce at minimum AC
competition: can force firms to cut costs and become more efficient
3. Dynamic efficiency
efficiency over time
happens when firms invest in innovation, R&D, training, and new technology
means products and production methods improve in the future
How to apply it:
monopoly: may be dynamically efficient if supernormal profit is invested in innovation
mergers: larger firms may have more funds for research and development
monopsony: squeezing supplier profits may reduce investment and lower dynamic efficiency
4. X-inefficiency
waste, slack, or poor cost control due to lack of competition
happens when firms become complacent and do not try hard enough to minimise costs
How to apply it:
monopoly: may become X-inefficient because there is little competitive pressure
competition: can reduce X-inefficiency by forcing firms to become leaner and more efficient
How to know which one to use in an essay:
price/output problem → allocative efficiency
costs/economies of scale → productive efficiency
innovation/investment → dynamic efficiency
lack of competition/complacency → X-inefficiency
How many KAA and EV marks are in a 5, 8, 10, 12, 15 and 25 markers and what the structure is for each
5 = 2K, 2Ap, 1An
8 = 2K, 2An, 2Ap, 2 EV
10 = 6 KAA + 4 EV
12 = 8 KAA + 4 EV
15 = 9 KAA + 6 EV
25 = 16 KAA + 9 EV
Evaluation points for micro
Use DEPTHS:
D = Depends on the scale / size
depends on how big the tax, subsidy, merger, market power, or intervention iS
E = Elasticity
depends on PED, PES, XED, or elasticity of labour supply
P = Passed on or not
depends on whether lower costs or higher costs are passed on to consumers
T = Time period
short run and long run effects may be different
H = How far behaviour changes
depends on whether consumers, firms, or workers actually respond
S = Substitutes / side effects / government failure
depends on availability of substitutes, unintended consequences, or policy failure
This may be limited if there are close substitutes.
However, the policy may create unintended consequences.
Government failure may occur if the policy is badly designed or hard to enforce.
Measures of inflation
The main measures of inflation are:
CPI = Consumer Prices Index
RPI = Retail Prices Index
CPI (Consumer Prices Index)
the main official measure of inflation in the UK
measures the average change in the price of a weighted basket of goods and services
used to track changes in the cost of living over time
does not include mortgage interest payments
Definition:
CPI measures the average change in the price of a weighted basket of goods and services over time.
RPI (Retail Prices Index)
an older measure of inflation
also measures changes in the price of a basket of goods and services
includes some housing-related costs, such as mortgage interest payments
usually gives a higher inflation rate than CPI
Definition:
RPI measures changes in the price of a basket of goods and services, including some housing costs such as mortgage interest payments.
Basket of goods and services
a sample of products that reflects typical household spending
includes items such as food, clothing, transport, entertainment, and bills
is updated over time to reflect changes in consumer habits
Weighted index
different items are given different weights based on how important they are in average household spending
goods people spend more money on have a larger effect on the inflation measure
for example, housing or transport usually has a bigger weight than small everyday items
Why weights matter:
They make the measure more realistic because not all products are equally important.
Evaluation / limitations of inflation measures
they are only averages, so they may not reflect the experience of every household
different groups have different spending patterns, so inflation may feel higher or lower for different people
the basket and weights may not perfectly reflect all consumers
quality changes are difficult to measure, because a price rise may reflect improvement rather than pure inflation
new goods take time to be added to the basket
CPI and RPI can give different results because they include different items
PED + factors that effect it
PED > 1 = elastic
PED < 1 = inelastic
PED = 1 = unitary elastic
Usually negative because price and quantity demanded move in opposite directions
SPLAT
S — Substitutes
The more close substitutes, the more elastic demand.
P — Proportion of income
If a good takes up a large share of income, demand is more elastic.
L — Luxury or necessity
Luxuries tend to be elastic; necessities tend to be inelastic.
A — Addiction / habit / brand loyalty
Addictive goods and goods with strong brand loyalty tend to be inelastic.
T — Time period
Demand is usually more inelastic in the short run and more elastic in the long run because consumers have more time to adjust.
What is the difference between revenue and sales maximisation
Rmax = maximise money coming in → MR = 0
Smax = maximise quantity sold → AR = AC
Draw a monopoly diagram with Pmax, cost and profit shown