Y10 Economics: Circular Flow, GDP, Inflation, and Policies
1/63
There's no tags or description
Looks like no tags are added yet.
Name | Mastery | Learn | Test | Matching | Spaced |
|---|
No study sessions yet.
64 Terms
Circular Flow of Income
Flow of resources, goods, services, income, expenditure.
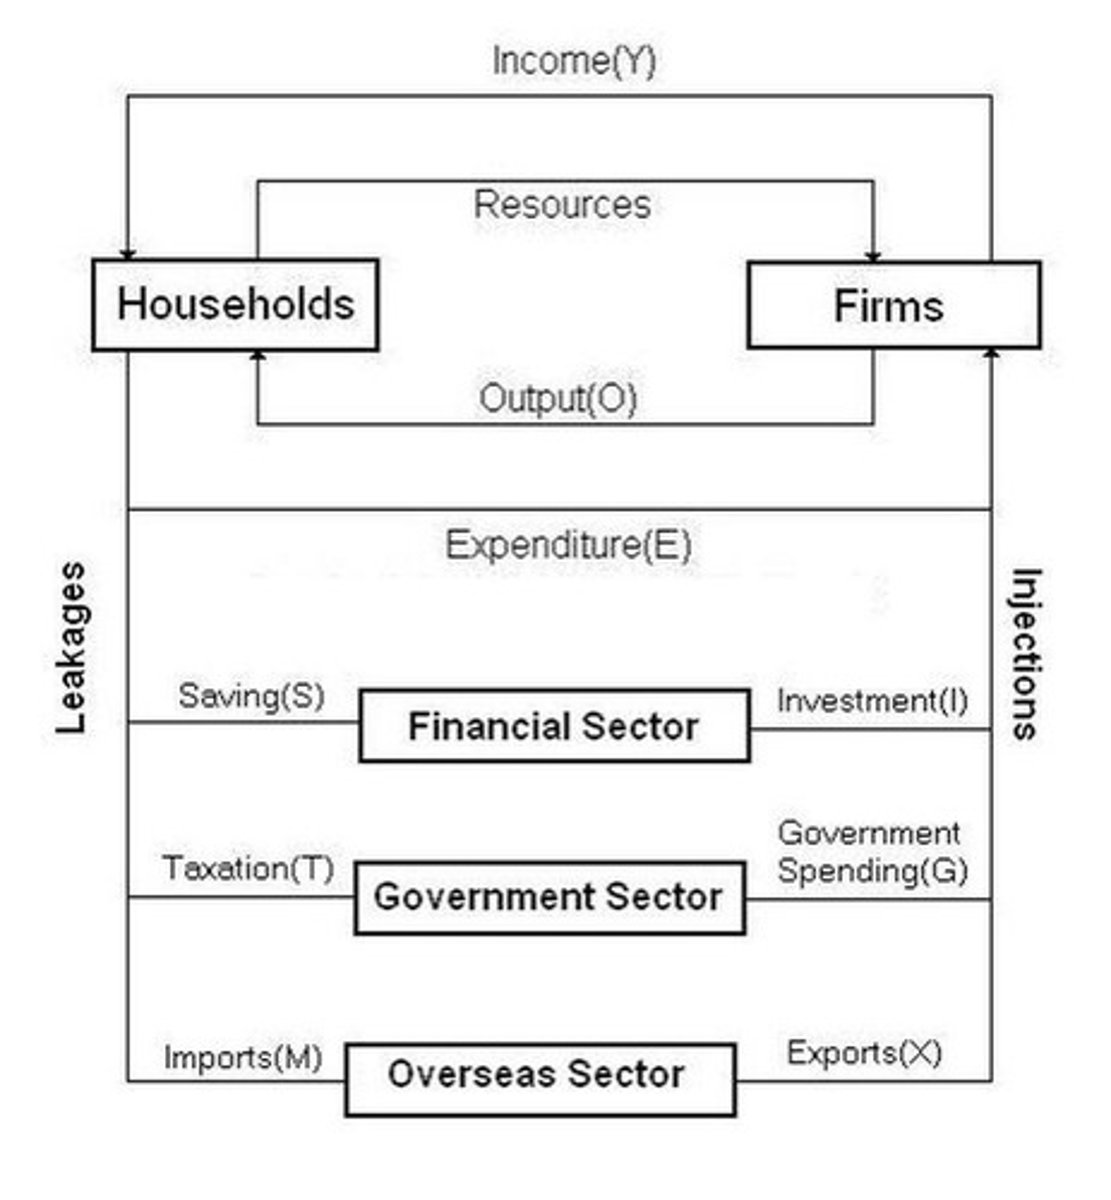
Household Sector
Provides production factors and purchases goods/services.
Business Sector
Supplies goods/services and pays households income.
Financial Sector
Holds savings, invests in capital, affects economy.
Government Sector
Collects taxes and spends on public services.
Overseas Sector
Imports take money out; exports bring income.
Equilibrium
Injections equal leakages; no economic change.
Disequilibrium
Injections do not equal leakages; economy fluctuates.
Business Cycle
Model of short-term economic activity fluctuations.
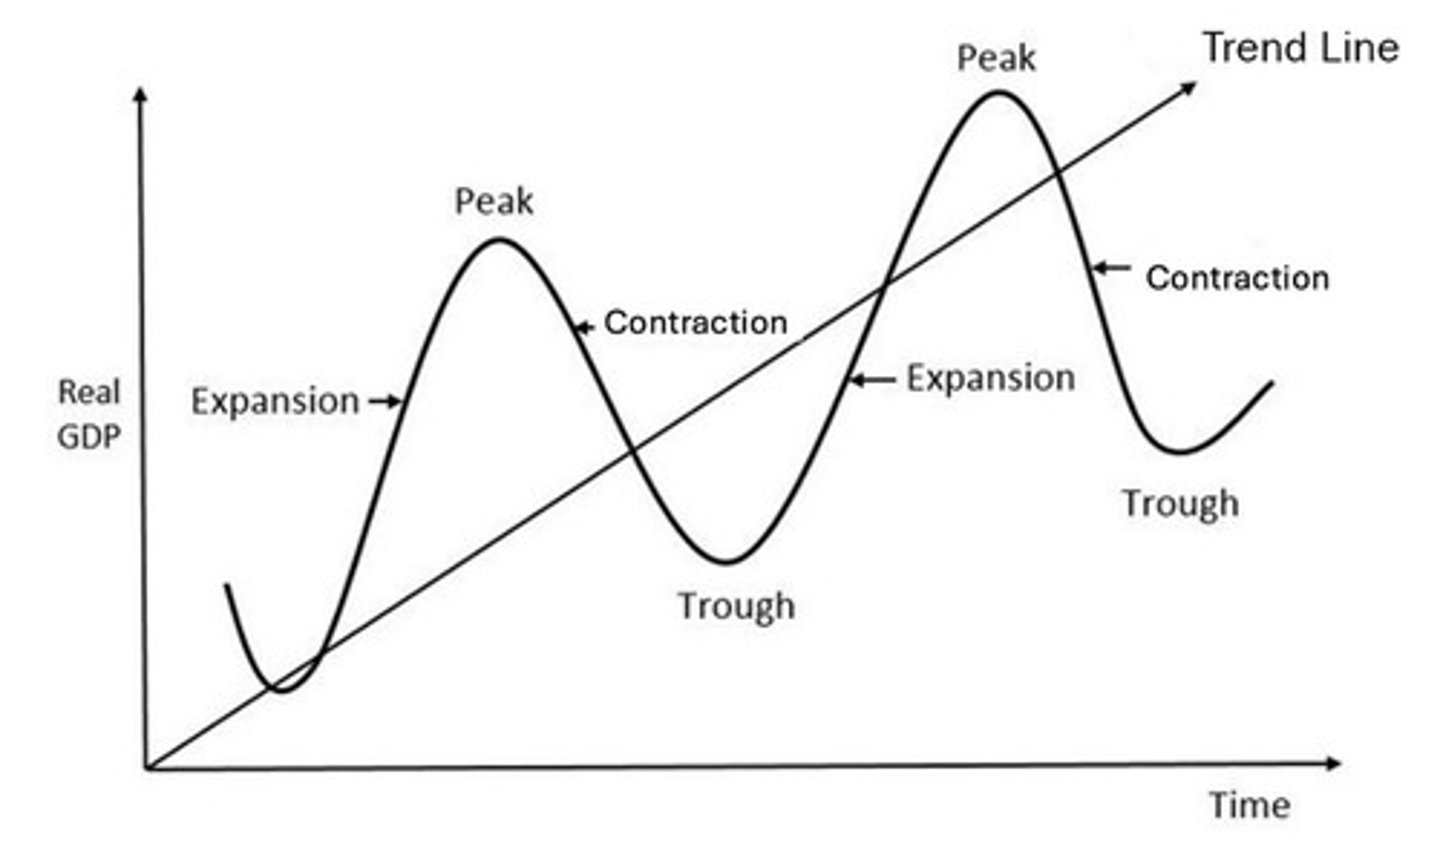
Boom/Peak Phase
High confidence, spending, low unemployment, high GDP.
Downswing Phase
Slowing economy, rising unemployment, stabilizing inflation.
Trough Phase
Low confidence, spending, high unemployment, low GDP.
Upswing Phase
Growing confidence, spending, lowering unemployment, rising GDP.
Economic Growth
Increase in productive capacity, measured over time.
Target Growth Rate
Desired economic growth range of 3-4%.
Nominal GDP
Value of output at current prices, unadjusted for inflation.
Real GDP
Inflation-adjusted measure of economic output.
Real GDP per Capita
Economic production per person in the economy.
Arguments Against GDP
GDP ignores non-market activities and quality of life.
Utility Changes
GDP does not reflect satisfaction from goods/services.
Productivity Measurement
GDP does not account for output per input.
Inflation
Persistent rise in general price levels over time.
Target range
Desired inflation rate of 2-3%.
Consumer Price Index (CPI)
Measures price changes of household goods quarterly.
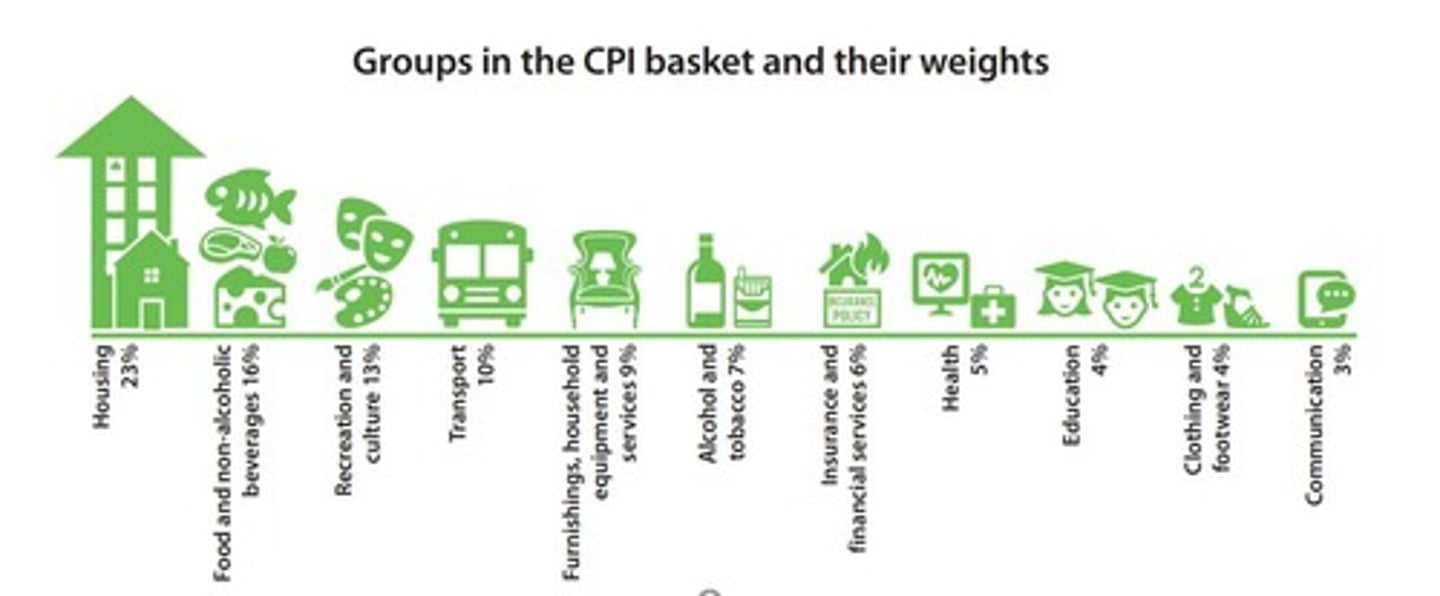
Headline CPI
Broad measure of inflation including all price changes.
Underlying inflation
CPI excluding short-term price influences.
Demand pull inflation
High demand causes prices to rise rapidly.
Aggregate demand
Total spending in the economy affecting inflation.
Cost push inflation
Rising input costs lead to higher consumer prices.
Input costs
Expenses incurred in producing goods and services.
Wages and productivity
Higher wages without increased output cause inflation.
Import prices
Costs of foreign goods increase with a weak dollar.
Natural disasters
Events causing shortages and rising prices in agriculture.
Unemployment
Willing and able workers unable to find jobs.
Unemployment rate
Proportion of labor force without paid work.
Target unemployment range
Desired unemployment rate of 4-5%.
Labour Force
Individuals either working or seeking employment.
Participation Rate
Proportion of working-age population in the labor force.
Underemployment Rate
Employed individuals wanting more hours.
Underutilization Rate
Sum of unemployment and underemployment rates.
Full Employment
Lowest unemployment without affecting inflation.
Cyclical unemployment
Unemployment counter-cyclical to economic cycles.
Frictional unemployment
Workers transitioning between jobs or upskilling.
Seasonal Unemployment
Job loss due to seasonal demand changes.
Structural Unemployment
Job loss from technological advancements replacing jobs.
Material Living Standards
Access to physical goods and services measured by GDP.
Non-Material Living Standards
Intangible factors affecting life enjoyment, like freedom.
OECD Index
Measures living standards based on 11 criteria.
OECD Better Life Index
Compares countries on jobs, education, income, health, environment.
Fiscal Policy
Government budget decisions affecting spending and revenue.
Expansionary Fiscal Policy
Increased spending to stimulate economic growth.
Contractionary Fiscal Policy
Decreased spending to slow economic activity.
Income Tax
Primary source of government revenue in Australia.
Social Security Spending
Major government expenditure for welfare support.
Monetary Policy
Adjustments to cash rate influencing interest rates.
Cash Rate
Interest rate charged by RBA to banks.
Contractionary Monetary Policy
Increases cash rate to slow economic activity.
Expansionary Monetary Policy
Decreases cash rate to boost economic activity.
Public Services Investment
Fiscal policy boosts living standards through infrastructure.
Progressive Taxation
Higher taxes on wealthier individuals to reduce inequality.
Inflation Control
Regulating prices to maintain purchasing power stability.
Employment Rates
Percentage of the labor force that is employed.
Quality of Life
Overall well-being and satisfaction of individuals.
Purchasing Power
Ability to buy goods and services with income.