Wetlands Analysis ~ Waterbudget Exam
1/55
There's no tags or description
Looks like no tags are added yet.
Name | Mastery | Learn | Test | Matching | Spaced | Call with Kai | Chat |
|---|
No analytics yet
Send a link to your students to track their progress
56 Terms
hydrology suggests
water depth
water flow
frequency and duration of flooding or saturation
hydrology affects plant communities
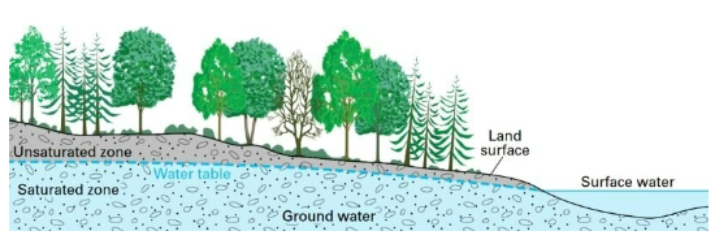
groundwater fed species (yellow birch, eastern hemlock)
surface water species (timothy, stinging nettle, dandelion, multiflora rose, poison ivy)
daily tidal inundation (tall smooth grass)
disturbed hydrology (common reed, cattails, black cherry)
consistent tidal water levels (short smooth cordgrass)
permanent flooding/bogs (white water lily, yellow cow lily, pond weeds, water milfoil)
seasonally flooded (rice cutgrass, golden ragwort, sweet flag, black willow, tear thumb)
temporarily flooded (garlic mustard, sycamore, eastern cottonwood, bitternut hickory, box elder)
saturated (white break rush, large cranberry, coast sedge)
types of hydrology changes
tide restrictions
reservoirs and ponds with stabilized water levels
drained eastern forests
controls on wetness
sources, throughflows, outputs, hydroperiod
hydroperiod
the amount of time water is present in a habitat (flood duration) and the timing and frequency of flood events
depth of water at the surface, to water table
frequency - time between wet episodes
duration - how long water persists
US Army Corps of Engineers’ wetland
an area saturated or inundated by surface or groundwater at a frequency and duration sufficient to support and that under normal circumstances do support a prevalence of vegetation typically adapted for life in saturated soil conditions
hydrology indicators
evidence of surface water (ex: creek)
evidence of saturated soils (ex: hydrogen sulfide)
microtopography (small-scale terrain change), drainage
persistence waters influence soils and vegetation
how persistent waters influence soils and vegetation
climatology - precipitation and storms
physical oceanography - limnology
geology - groundwater and stratigraphy
soil - infiltration and percolation
ecology - water usage and storage
water budget
is an accounting of the rates of water movement and the change in water storage in all or parts of the atmosphere, land surface, and subsurface
input - output = change in storage
gains - losses = changes to water level
water cycle
oceans are the global bulk storage water of water by gravity
evaporation and precipitation remove and redistribute water back to the continents
direct monitoring of water level
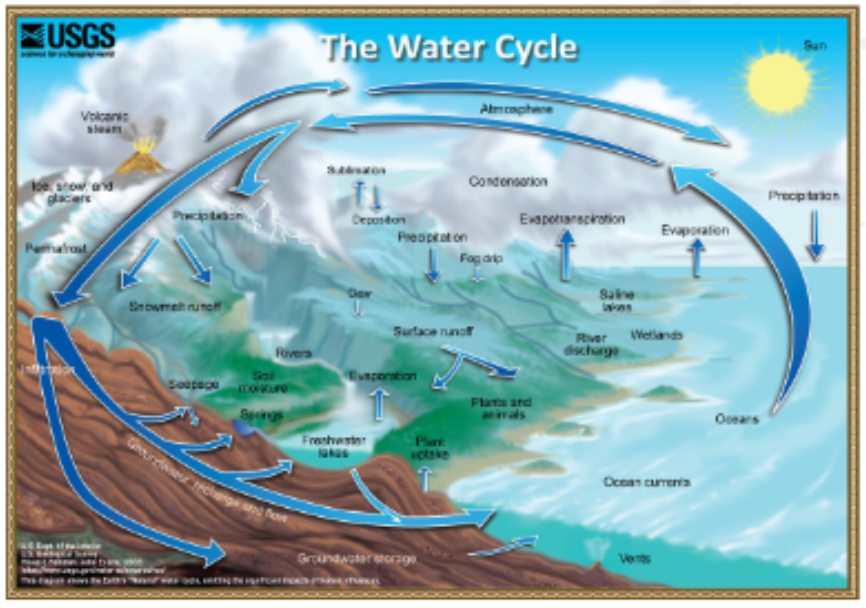
evaporation
change the energy state of water molecules from high energy (condensed) to low energy (dispersed)
cooling, heat must be absorbed
precipitation
heat is released to condense water from a low energy to high energy state
opposite of evaporation
cry when you’re low in energy
happens by: cooling during uplift (convection), tropical convection, cold front (cold air rising over warm air), warm front (warm air rising over cool air), occluded front (air of diff temps collide), orographic effect (air lifting over a physical feature), low pressure (cyclonic lifting air, depression hurricane)
cold climate rain processes
snowpack accumulation
ice formation and glacial processes
meltwater and glacial outwash
sublimation to water vapor
warm climate rain processes
infiltration (precipitation soaks into the soil)
surface runoff
percolation/permeability
groundwater processes and recharge
downward and later flows
capillary forces
Darcy’s law and gradient flow
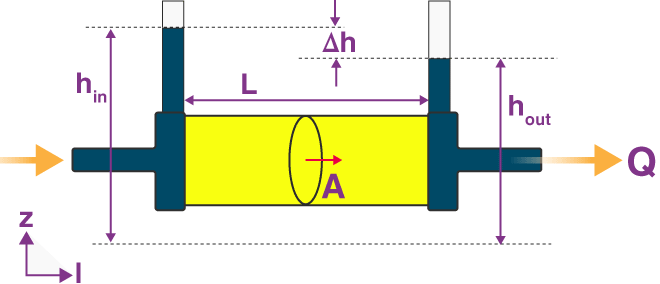
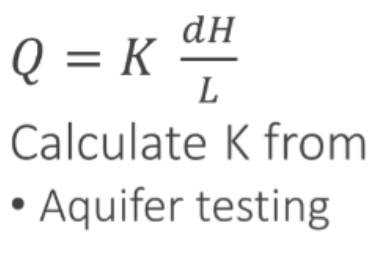
Darcy’s law
a constitutive equation that defines the flow of a fluid through a porous medium; the flow between two points is directly proportional to the pressure differences between the points, the distance, and the connectivity of flow within rocks between the points
ecological processes of hydrology
root uptake and plant use
partly a function of evaporation - stomates, turgor pressure regulation to slow water losses
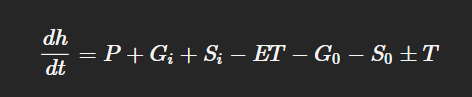
water cycle water budget
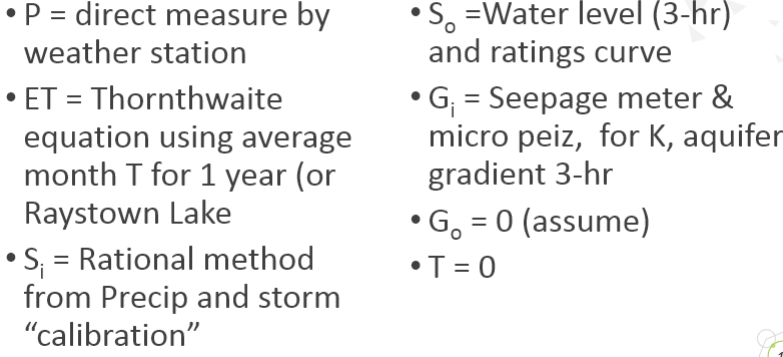
P = precipitation
ET = evapotranspiration
G = groundwater flow
S = surface water flow
T = tides
t = time
H = water level
water budget precipitation
wetlands dominated by P have large dh/dt (fluctuating water levels)
prairie potholes, vernal pools, wet meadows, closed depressions
physical measurements: rain gauge
remote measurements: estimate from weather radar
rain gauge
physical precipitation measurement
manual - read from stick or side gauge
automatic - tipping bucket, read triggers (tips)
calibrated for reservoir: collection surface
weather radar estimates
remote measurement of precipitation
vertical profiles of reflectivity
gauge to radar statistical adjustment (NWS method)
managing rainfall data
record precipitation data as depth (in or mm)
volume of precipitation = depth x area = acre of feet of water
a 1in rain over a 24 acre reservoir: 1/12 ft x 24 acres = 2 acre feet of water
metric might make more sense (m3)
transpiration
the passive process of water movement through a plant and its evaporation from aerial parts, such as leaves, stems and flowers
varies by plant type (shallow vs deep root system)
shallow: similar ________ rates to a soil film’s evaporation rate
deep: have access to water tables = higher ________ rate
evapotranspiration
the process by which water is transferred from the land to the atmosphere by evaporation from the soil and other surfaces and by transpiration from plants
Pan evaporation
daily measure of water loss/replacement in an open pan
doesn’t measure plant use - usually much larger than open pan for moist soils and tall vegetation, less for short vegetation on dry soils
lysimeter = weighed system
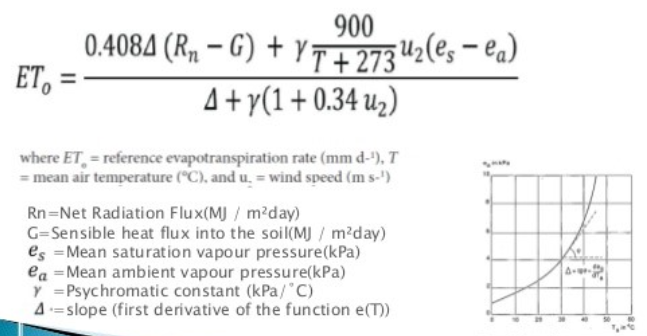
Penman Monteith equation
physical calculation to estimate evapotranspiration using an observed reference surface, removing the need to define parameters for each crop and stage of growth
evapotranspiration rates of different crops are related to the evapotranspiration rate from the reference surface through the use of crop coefficients
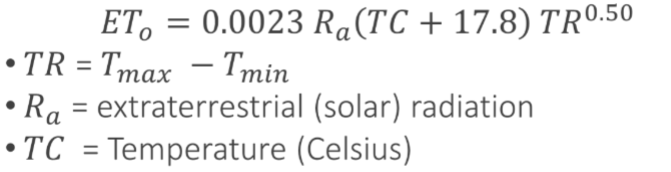
Hargreaves equation
equation to estimate evapotranspiration from min, max, & mean air temp, solar radiation; temperature-based method
underestimates ET in windy conditions
overestimates ET in extremely humid or dry air
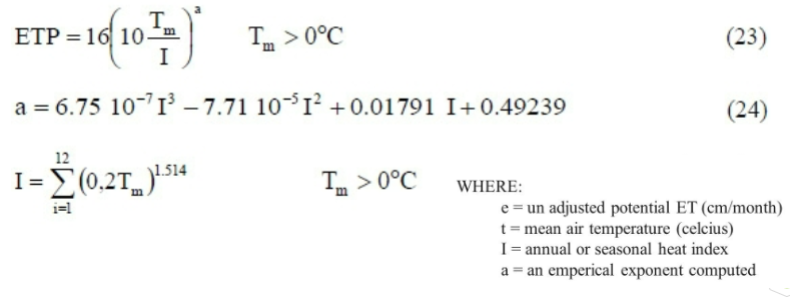
Thornthwaite equation (1948)
estimate of daily potential evapotranspiration (PET) based on air temperature and latitude
measured multiple sites, fitted equation
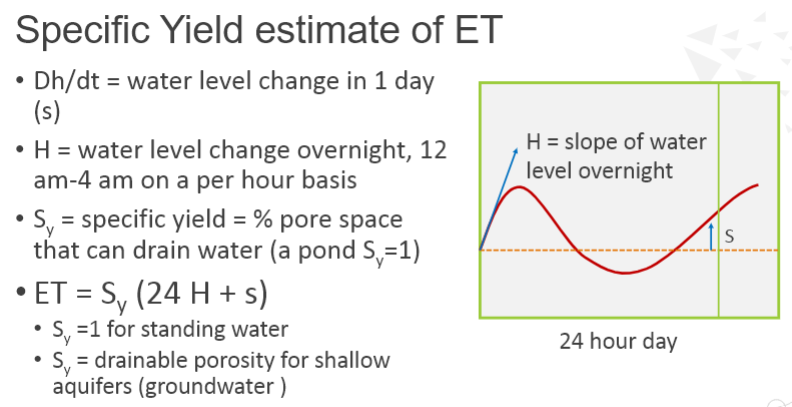
specific yield of aquifers, ponds
in unique circumstances, ET can be calculated by daily changes in water level
overnight, a closed waterbody receives groundwater, but ET is near zero = water level rises overnight
during the day, groundwater inflow is about the same as overnight, but ET is high
simplify water budget equation

specific yield estimate of ET
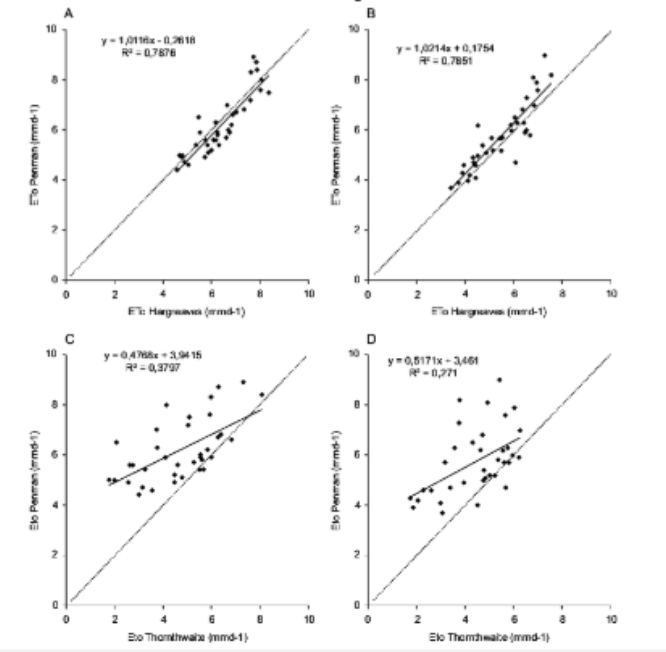
comparing estimates of ET
Pan evaporation = overestimates ET
Penman Monteith = great at estimating evaporation, underestimates ET in wetlands (surface area of plants)
Thornthwaite = ok, least costly to implement
surface water flows (S)
wetlands dominated by S have large dh/dt (fluctuating water levels), especially related to river flooding
duration may be short as floodwaters rapidly rise but flow through
significant sedimentation = disturbances
physical measurements: stream gauge
remote measurements: estimate from weather radar
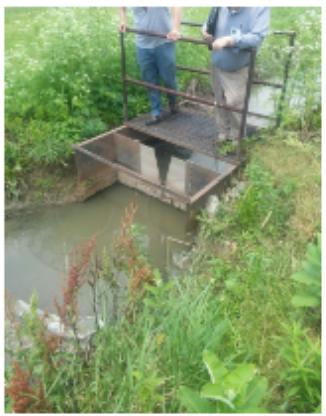
stream gauge
physical measurement of surface water flow
a “yardstick” for how deep the water is
USGS network of stream gauges
pressure transducers for automation
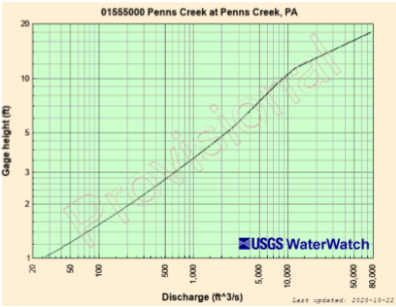
ratings curve
water level coupled with discharge measurement
multiple measures of water depth (stage) and discharge (water flow)
curve-fit equations allow to calculate discharge from stage (measured by pressure transducer)
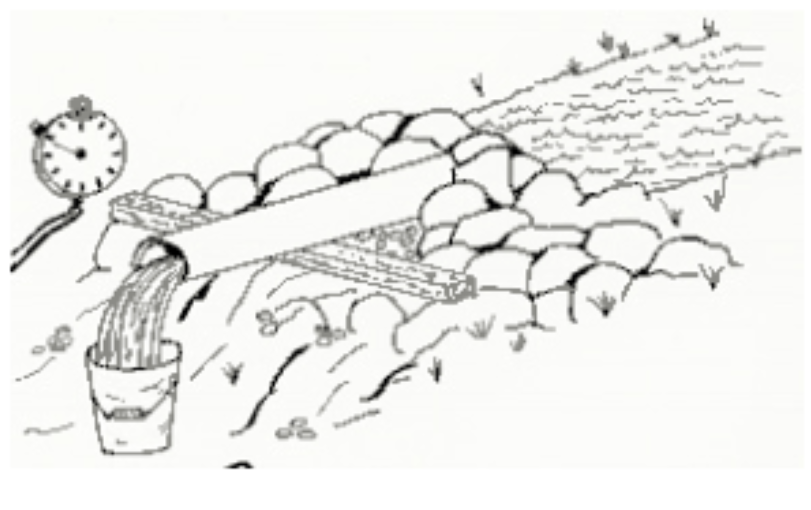
timed gravimetric
capture and weigh method to measure discharge for ratings curve
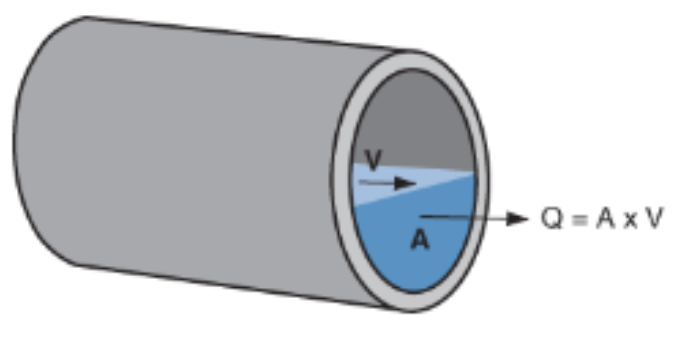
area-velocity
method to measure discharge for ratings curve
cross-sectional area of flow (L x W)
velocity (by propeller or otherwise)
open channel or pipe
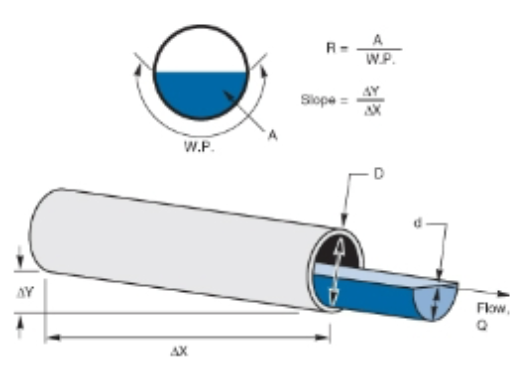
Manning’s equation
method to measure discharge for ratings curve
area
slope
depth of water
bottom roughness
hydraulic structures
method to measure discharge for ratings curve
engineered flow channel
height ~ flow
transducers or floats
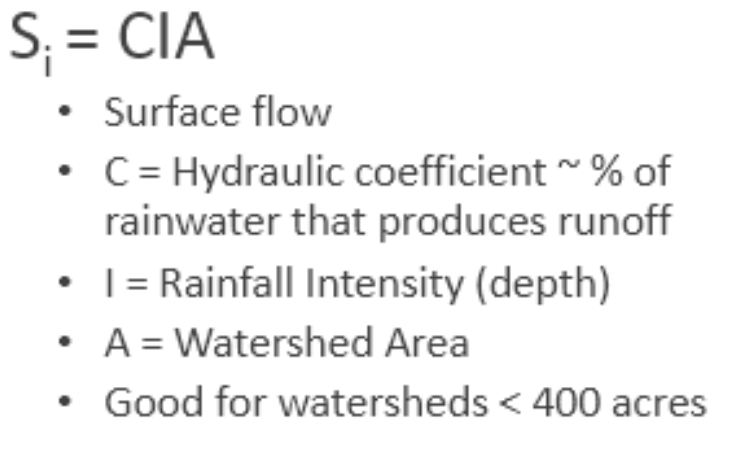
estimating surface flow (S) from rainfall
divide rainfall into “rations,” and estimate runoff from each storm (as a fraction) = hydraulic coefficient c
values 0.05-0.5 = permanent vegetation and permeable soils to urban areas
storm monitoring - get rainfall amount from single storm, find receiving waterbody (pond) and measure water volume change and watershed area; assume G+ET is small in a 2-day period
groundwater flows (G)
hard to directly monitor without specialized equipment, so measure all other components and any difference is this
must be measured as a gradient - change in water level between distance = dH/L
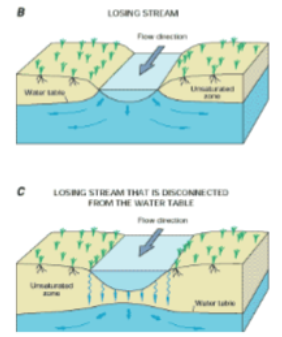
gaining streams, losing streams (saturated, unsaturated)
gaining streams
surface water gains from groundwater upwelling (aquifer discharge)
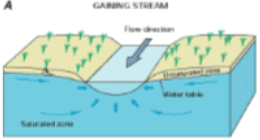
losing streams
surface water is lost from stream to groundwater (aquifer recharge)
B saturated contact
C unsaturated contact
network of monitoring wells
G must be measured as a gradient change in water level between distance (dH/L)
follow Darcy’s law
estimate regional flow with depth of aquifer and 1D or 2D flow (radial flow to a pond?)
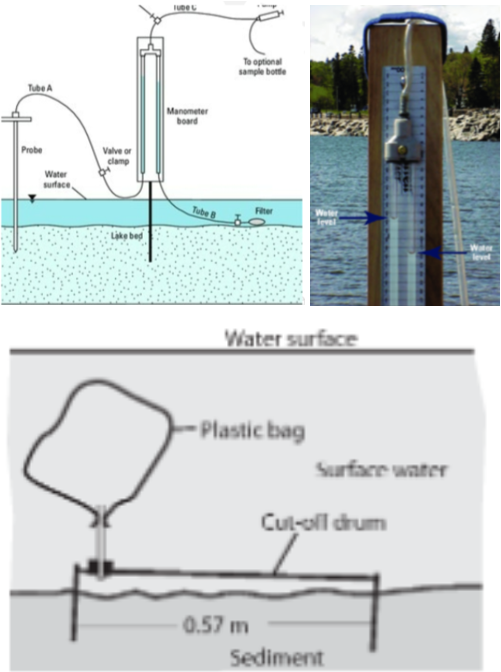
seepage meters/ hydraulic potentiomanometer
measure change in head from the open water to a depth below the lake (dH/L)
groundwater flow across lakebed = where discharge happens
measure hydraulic gradient across sediment bottom (dH/L)
trap inflow across bottom in a barrel (Q)
solve for K
Darcy’s law
putting it all together
ecosystem function
water level change controls some plant communities (dh/dt)
water chemistry controls some plant communities (Gi vs Si)
nutrient cycling is often pulse dependent for infiltration, biological interactions
organic matter - peat accumulation/decomposition
hydroperiod
depth of flooding (inundation)
may alter vegetation composition
enhance/limit species richness
flowing water = enhances plant diversity
flow action stimulates new niches
disturbances to seed bank
primary productivity
increased by water flow
stagnant water = lower productivity, low oxygen, low nutrient imports
flowing water = higher nutrient loads, higher oxygen, higher productivity
organic matter accumulation and export
accumulation rates
decomposition rates
anoxia
dystrophic water (fulvic acid and tannins; nutrient starved, acidic)
eutrophic water (rapid algae growth; nutrient rich, likely alkaline)
nutrient cycling - water outflow
nutrient inflows, exports
nutrient transformations (anoxia)
P more soluble in anaerobic conditions
NH4 more stable in anaerobic conditions
denitrification and conversion of NO3 to N2
nutrient cycling - pH changes
soils that are anaerobic will have stable NH4 and sulfides (HS-)
soil dries during drought, O2 enters and oxidizes N to nitrate and S to sulfate, releasing H+ (acid forming)
dry soils that flood during high water become anaerobic (alkaline forming reactions)

flooding key concepts
different species have different physiological responses to flooding
large trees generally more tolerant to flooding than seedlings
flooding has major control over which species become established
plant succession depends on environmental/hydrologic change (deposition/erosion)
water budget important facts
faster water flows increase plant diversity; stagnant waters have little (monocultures)
water scour (sediment removal) opens new niches and creates habitat
river flooding → sandbars, gravel, silt deposits, natural levies
ecosystem productivity increases with water velocities in flow-through systems
aeration, removal of toxins, dilution of hormones, N and P supply and transformation
hydrology is a primary control over nutrient imports
organic matter accumulation and preservation is a key component of wetland systems
repeated wetting/drying accelerated decomposition
stagnant water improves accumulation
slow waters have faster decomposition than fast (detritivores)
nutrient cycling - chemical reactions are unique, but O2 generally speeds up all biological reactions
intermittent wet/dry cycles slow reactions that need either O2 or anaerobic conditions (foster biodiversity and chemical diversity)
growing season
the definition of wetlands requires that anaerobic conditions be present during the growing season
types of hydrology observation
direct observation of surface water or saturated soils (Group A)
evidence of prior inundation or ponding (surface water) (Group B)
evidence of soil saturation, present or recent (Group C)
landscape, vegetation, and soil features that suggest contemporary hydrology (not relic) (Group D)
primary hydrology indicators
reliable evidence of long-lasting saturation or inundation; need one to indicate the presence of wetland hydrology
presence of water (A1 surface water; A2 high water table; A3 saturation, B1 water marks, B13 aquatic fauna, etc., C3 oxidized rhizospheres along living roots, etc.)
presence of saturated soils (B2 sediment deposits, B5 iron deposits, C1 hydrogen sulfide)
clear evidence of flow channels and deposition
secondary hydrology indicators
less reliable evidence of wetness; must be supported by at least two
vegetation patterns (B16 moss trim lines, B8 sparsely vegetated concave surface, D1 stunted or stressed plants)
microtopography (looks like a low spot) (B6 surface soil cracks, D2 geomorphic position, D4 microtopographic relief)
crayfish burrows (C8)