Maths dump 2025 (AS)
1/146
There's no tags or description
Looks like no tags are added yet.
Name | Mastery | Learn | Test | Matching | Spaced |
|---|
No study sessions yet.
147 Terms
How is a repeated root illustrated on a graph?
By a turning point/stationary point
How would you answer "Explain why the model is not suitable for very low prices."?
. Sub in a very small number
How would you answer "Explain why the model is not suitable for very big prices."?
. Sub in a very big number e.g 100
Always use Suvat to find acceleration unless it can be calculated from a graph...
Don't do speed/time unless very stuck..even with a graph suvat can still be an option
Cosine rule
a² = b² + c² - 2bcCosA
Sine rule
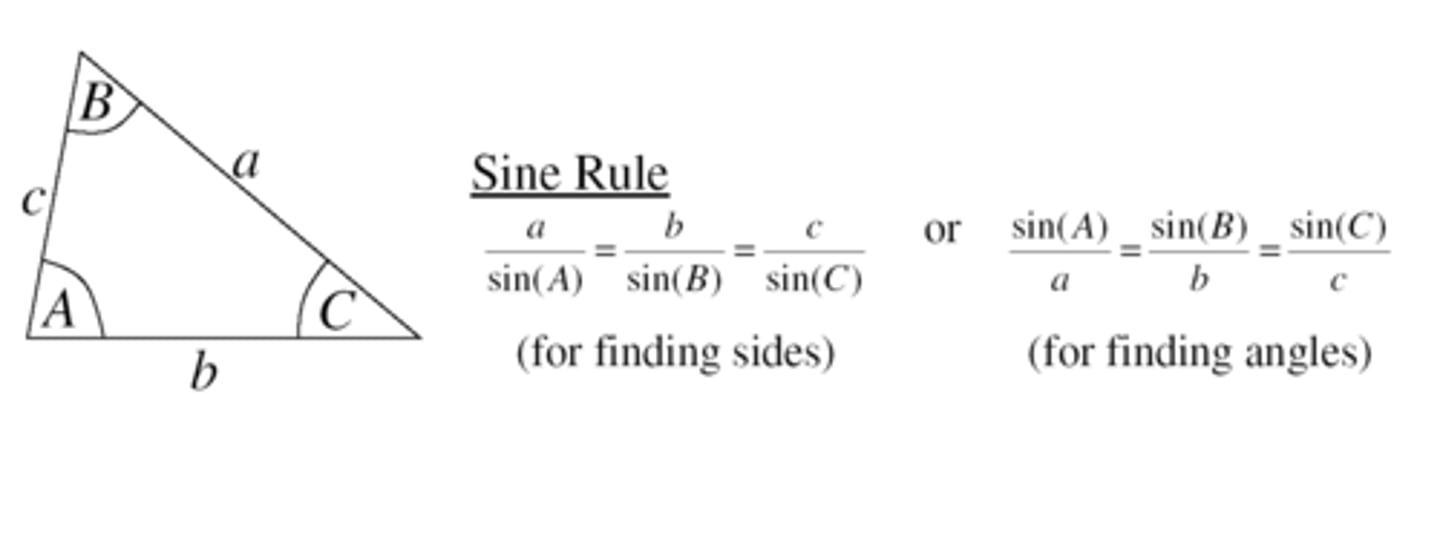
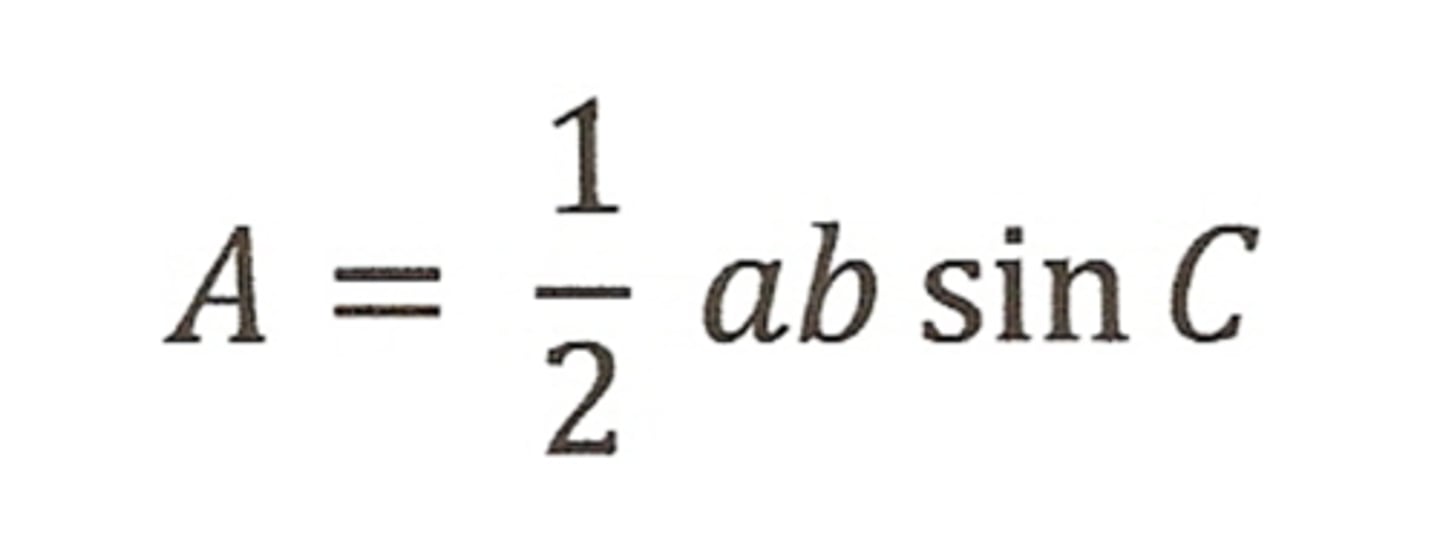
Area sine rule
1/2 x a x b x sin(C)
Are capital letters the angle or side?
Capital letters are the angle whereas lowercase letters are the opposite side.
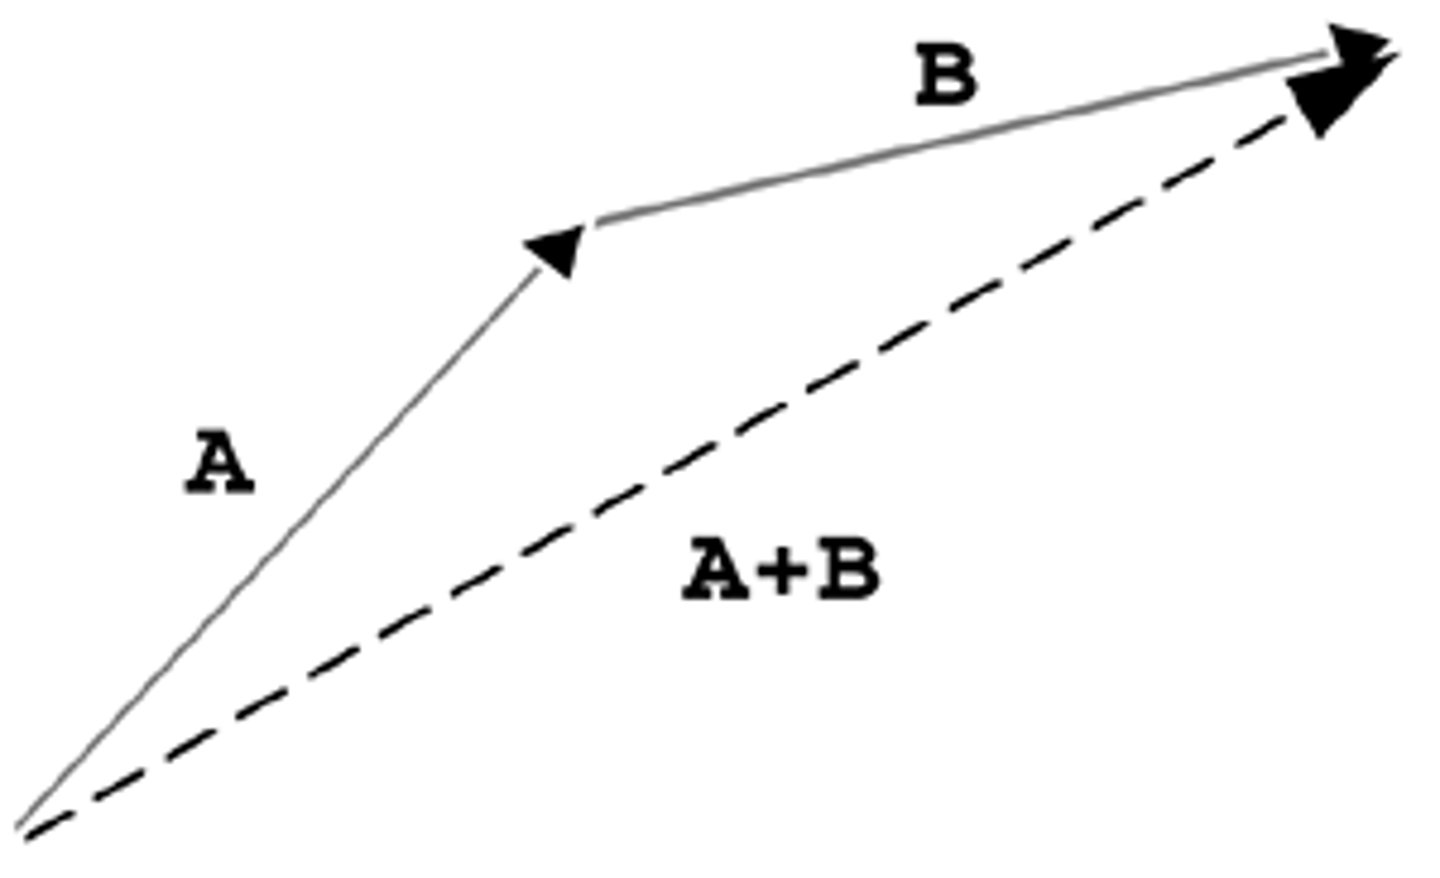
Vector AB + CA = AC (Make sure the pair of letters are the right way, doesn't work when switched!)
Draw a triangle and label 3 points ABC
Newton's' 2nd law with vectors..
Keep the resultant force in vector form.
Simplify (0.5VT) + (0.5V x (2T))
3/2 x VT
When is acceleration negative in suvat equations? (2)
When an object is slowing down + when the object moves in the opposite direction to a previously positive acceleration
3 rules of discriminants
. b2 - 4ac > 0 - 2 real roots
. b2 - 4ac = 0 - 1 repeated real root
. b2 - 4ac < 0 - no real root
Degree of accuracy in your answers
. Give your answers to 3 significant figures unless stated otherwise
. Use fractions where you can/use fractions throughout question to end up with exact answer
How do you find the rate of a function?
Find the derivative of the function = gradient at a specific point/ rate of change (growth/decline) at a specific point
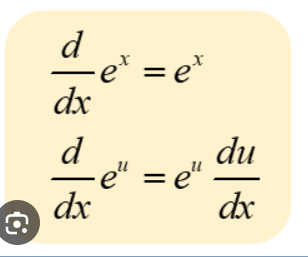
What is the derivative of an expontential function?
If the derivative of e(1)x = ex then the derivative of ekx = k(ex)
The graph of y = ln(x) is a reflection of the graph y=ex about the line y=x because…..
They’re inverse functions of one another.
. Why does ….. eln(x) = x
Using our previous rule of ekx = k(ex) :
. eln(x) = ln(ex) which then = x
How do you answer trigonometric equations (without trigonometric identities) (4)
. CAST diagram tells you what equation to use in order to find the pair of angles that satisfy the given equation.
. Then you use the repetition of the periods of the trigonometric function to find all possible angles.
. Cos/Sin graphs repeat every 360 whereas Tan graphs repeat every 180
. Use the above fact on your pairings to find other pairs of solutions
. See image
When solving trig equations in radians remember to..
. Use the correct part of the CAST diagram
. Remain in radians don’t start using throughout
. Remember to put your calculator in Radian mode
Process of inversing a function?
What does it mean to find the range of a function?
. Investigate the behaviour of the function as it approaches infinity and negative infinity
. You then sub in values to investigate this behaviour
. Use this in simultaneousness with other limits to the range for example having to be a positive integer
- In that case as the function approaches negative infinity you would sub in 0 because the function would tend to 0 (the lowest it can be)
Symbol for positive integers
Z+
Symbol for natural numbers?
N
(positive integers including zero)
Symbol for integer negative numbers
Z-
Symbol for integers
Z (the set of all whole numbers, both positive and negative, including zero)
Collinear meaning
. Points that lie on the same line
How many kilograms in a ton
There are 1,000 kilograms in a ton.
When do 2 particles have the same acceleration?
. When they are connected by an inextensible string [air resistance and friction (over a pully for example) should be negligible]
Factor theorem
. If a polynomial function f(x) has a factor (x-c), then f(c) = 0.
. This implies x=c is a root of the polynomial
How to factorise polynomials
. You need to find a value of x for which f(x)=0
. Take the factors of the last term e.g for x3 + 6x + 2, take the factors of 2
. Test them as values of x until you get a solution where f(x)=0
. Use factor theorem to get your solution in factor form
. Divide the polynomial by the factor (x-c) to find the remaining factors and simplify
Sketching a polynomial
. Plot roots, x- intercept and y- intercept
. Repeated roots indicate turning points
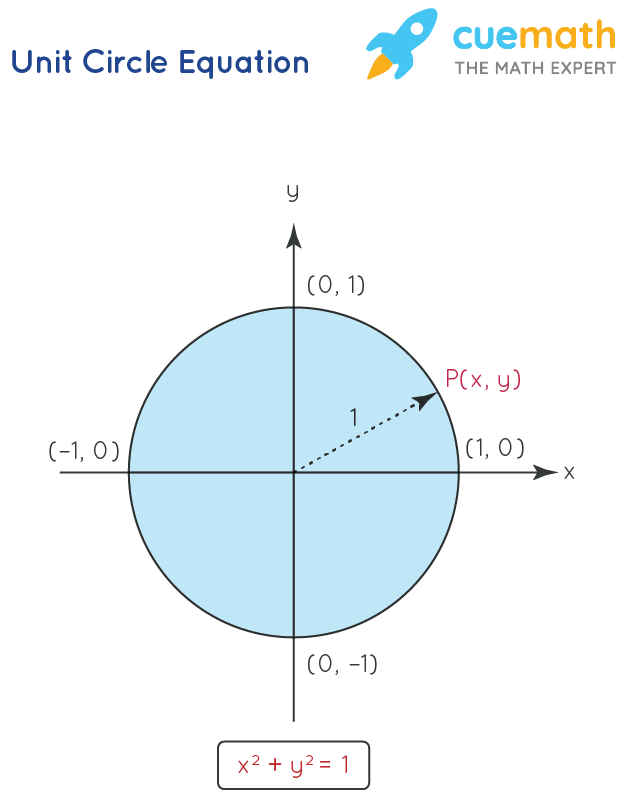
What is a radian?
The angle which subtends an arc of length 1 in the unit circle
What is 1 Radian
. 180/π
How do you convert radians to degrees?
Multiply the radian measure by 180/π.
How do you convert degrees back to radians?
. Divide the degree measure by 180/π.
What is 360,180,90,60 and 30 degrees in radians?
360 degrees is 2π radians
180 degrees is π radians
90 degrees is π/2 radians
60 degrees is π/3 radians
30 degrees is π/6 radians.
. Try to always express answers as fractions of π
How do the graphs of sin, cos and tan change under radians.
Everything works the same just all values are in radians
How do you set your calculator to radians and back?
. Shift, setup, 4:radian
. Then use setup, normal, 2 to go back
. To reset your calc - shift, 9, 3, =
Name the 3 trigonometric identities
. Tan θ = sin θ/cosθ
. sin²θ + cos²θ = 1 (remember that the squared is before theta so you should find sin θ then square)
. arcsin(x) = arccos(y)
Proof of each formula
. See folder
What is Univariate data?
Data that has one variable e.g engine size of a sample group of cars
. (only variable is engine size)
What is multivariate data?
Data that has two or more variables, e.g. engine size, C02 emissions, weight, number of doors of a sample group of cars
What is Bivariate data?
Data that has exactly two variables, such as height and weight in a sample group of individuals.
How do you plot scatter diagrams
. Dependent variable on the y axis and independent variable on the x axis then plot valuesfor each variable as points on the graph.
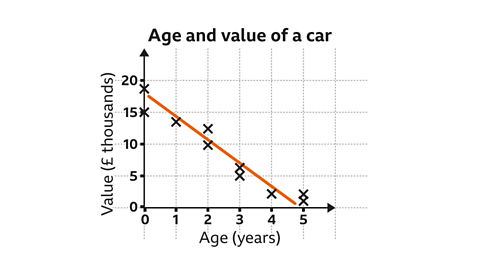
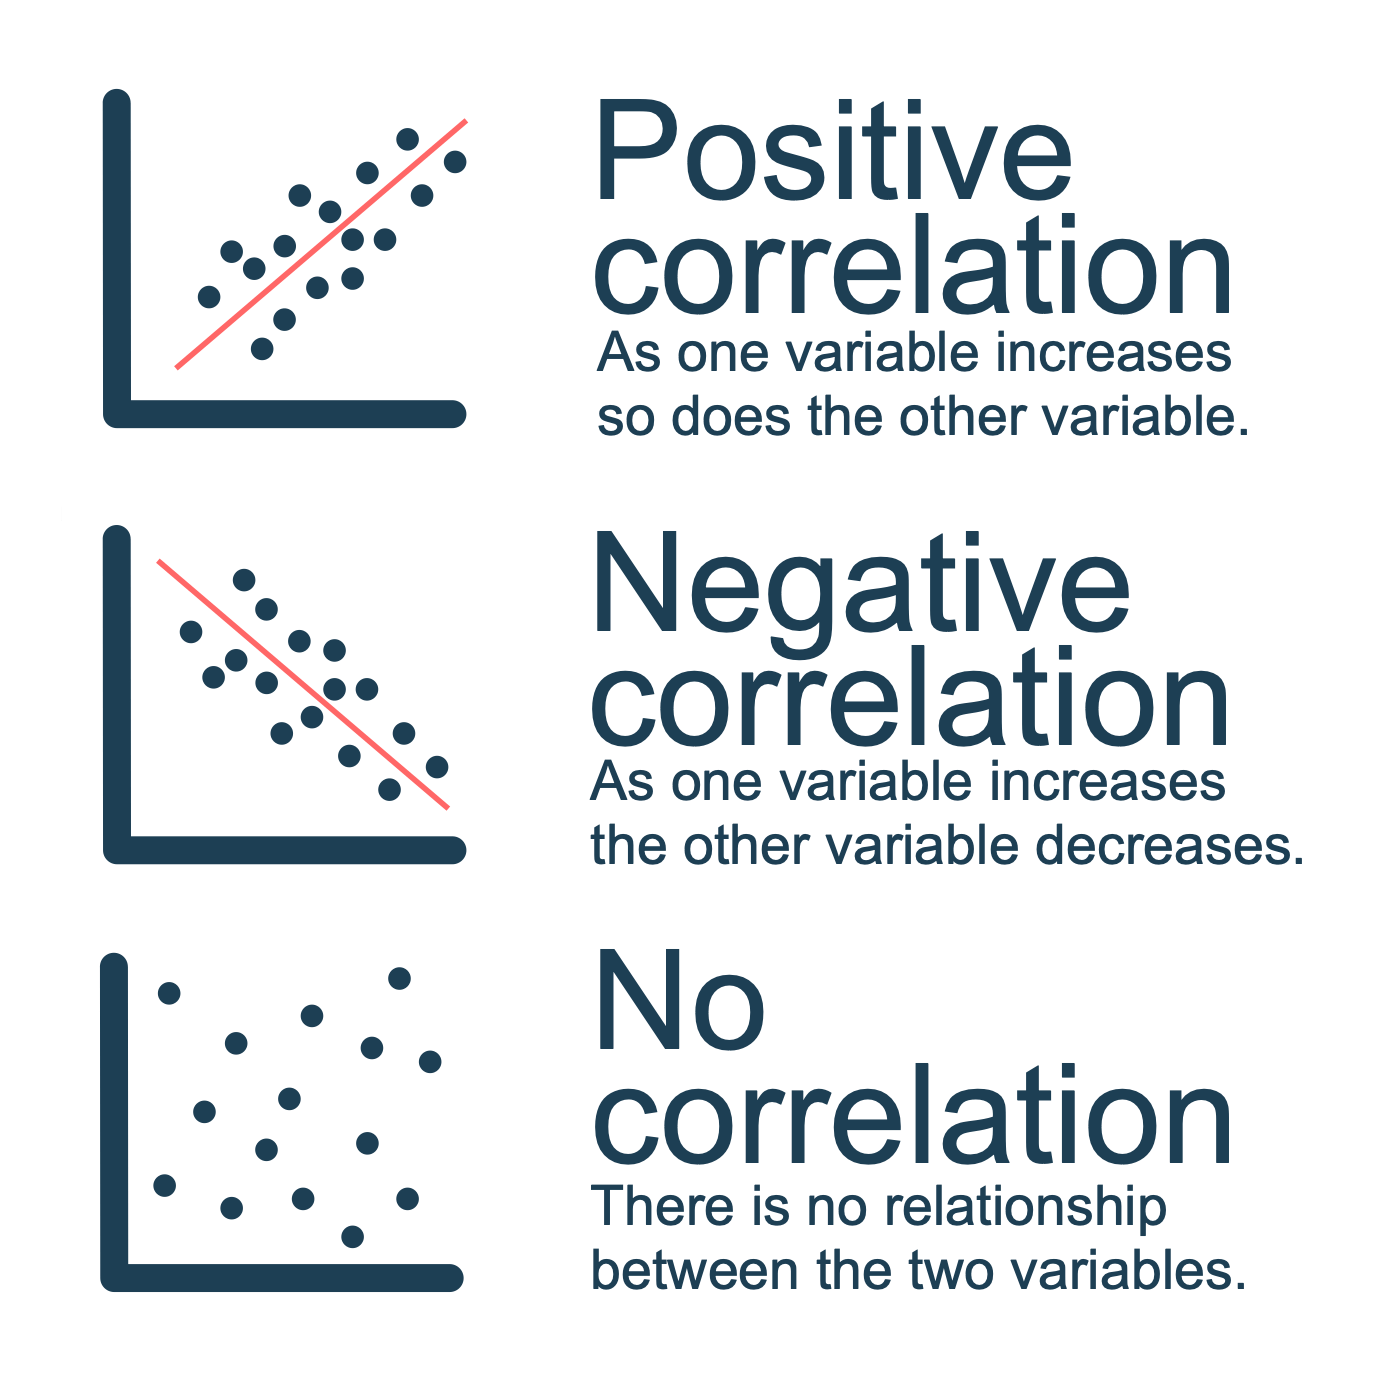
Positive negative and no correlation
Positive - as one variable increases so does the other
Negative - as one variable increases the other decreases
No correlation - Variables are not connected
The closer the data points are to a straight line = the stronger the correlation
What is association?
Connectedness between variables that isn’t necessarily linear
Proof that correlation doesn’t always mean causation?
. You can plot 2 bits of info we know will have no connection and just by pure fluke they’re correlated
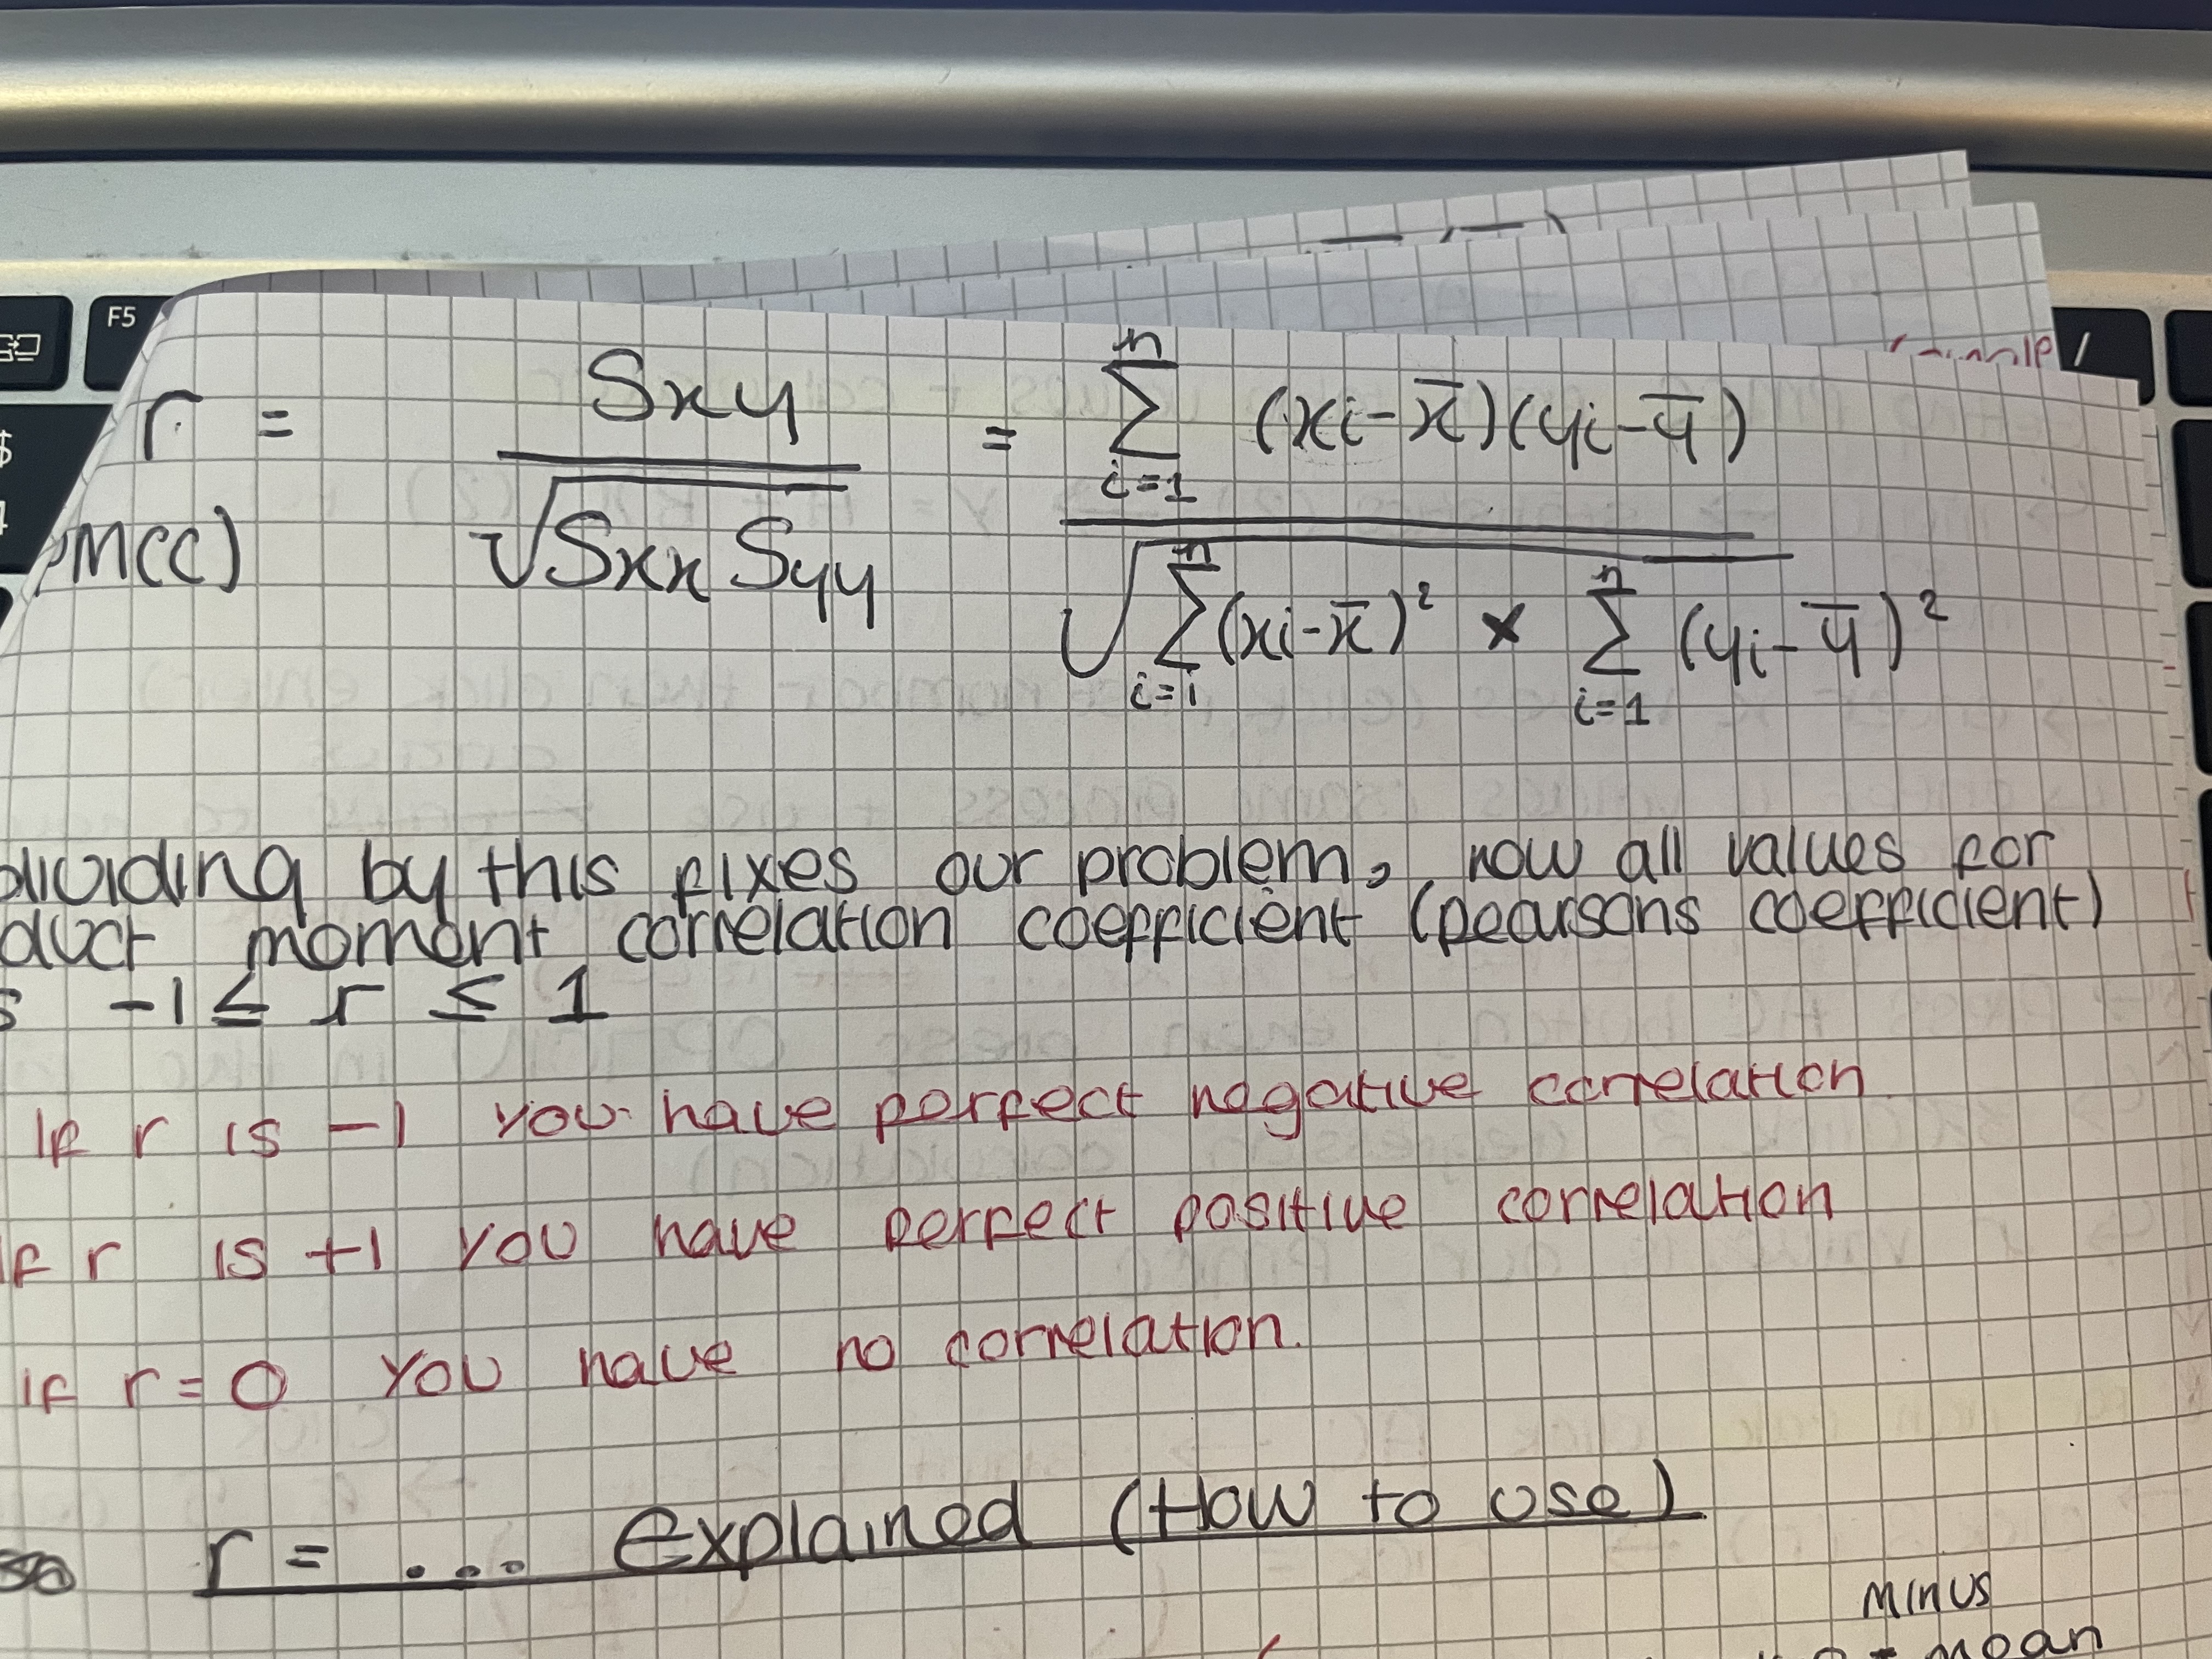
What does the product moment correlation coefficient tell us? (PMCC)
Tells us the how correlated 2 variables are. A numerical measure of the strength and direction of a linear relationship between two variables.
How do we calculate the sum of the x y’s? (Sxy)
Difference between value x1 and the mean of the x’s, multiplied by, the difference between y1 and the mean of y’s… repeat for each pair of corresponding values, then sum all your answers.
Imperfect equation for the strength if correlation
How to calculate Product moment correlation coefficient? (r)
r = Sxy/√SxxSyy
. Sum of xy’s is divided by the square root of the product of the sums x’s squared and y’s squared.
Using the PMMC equation.
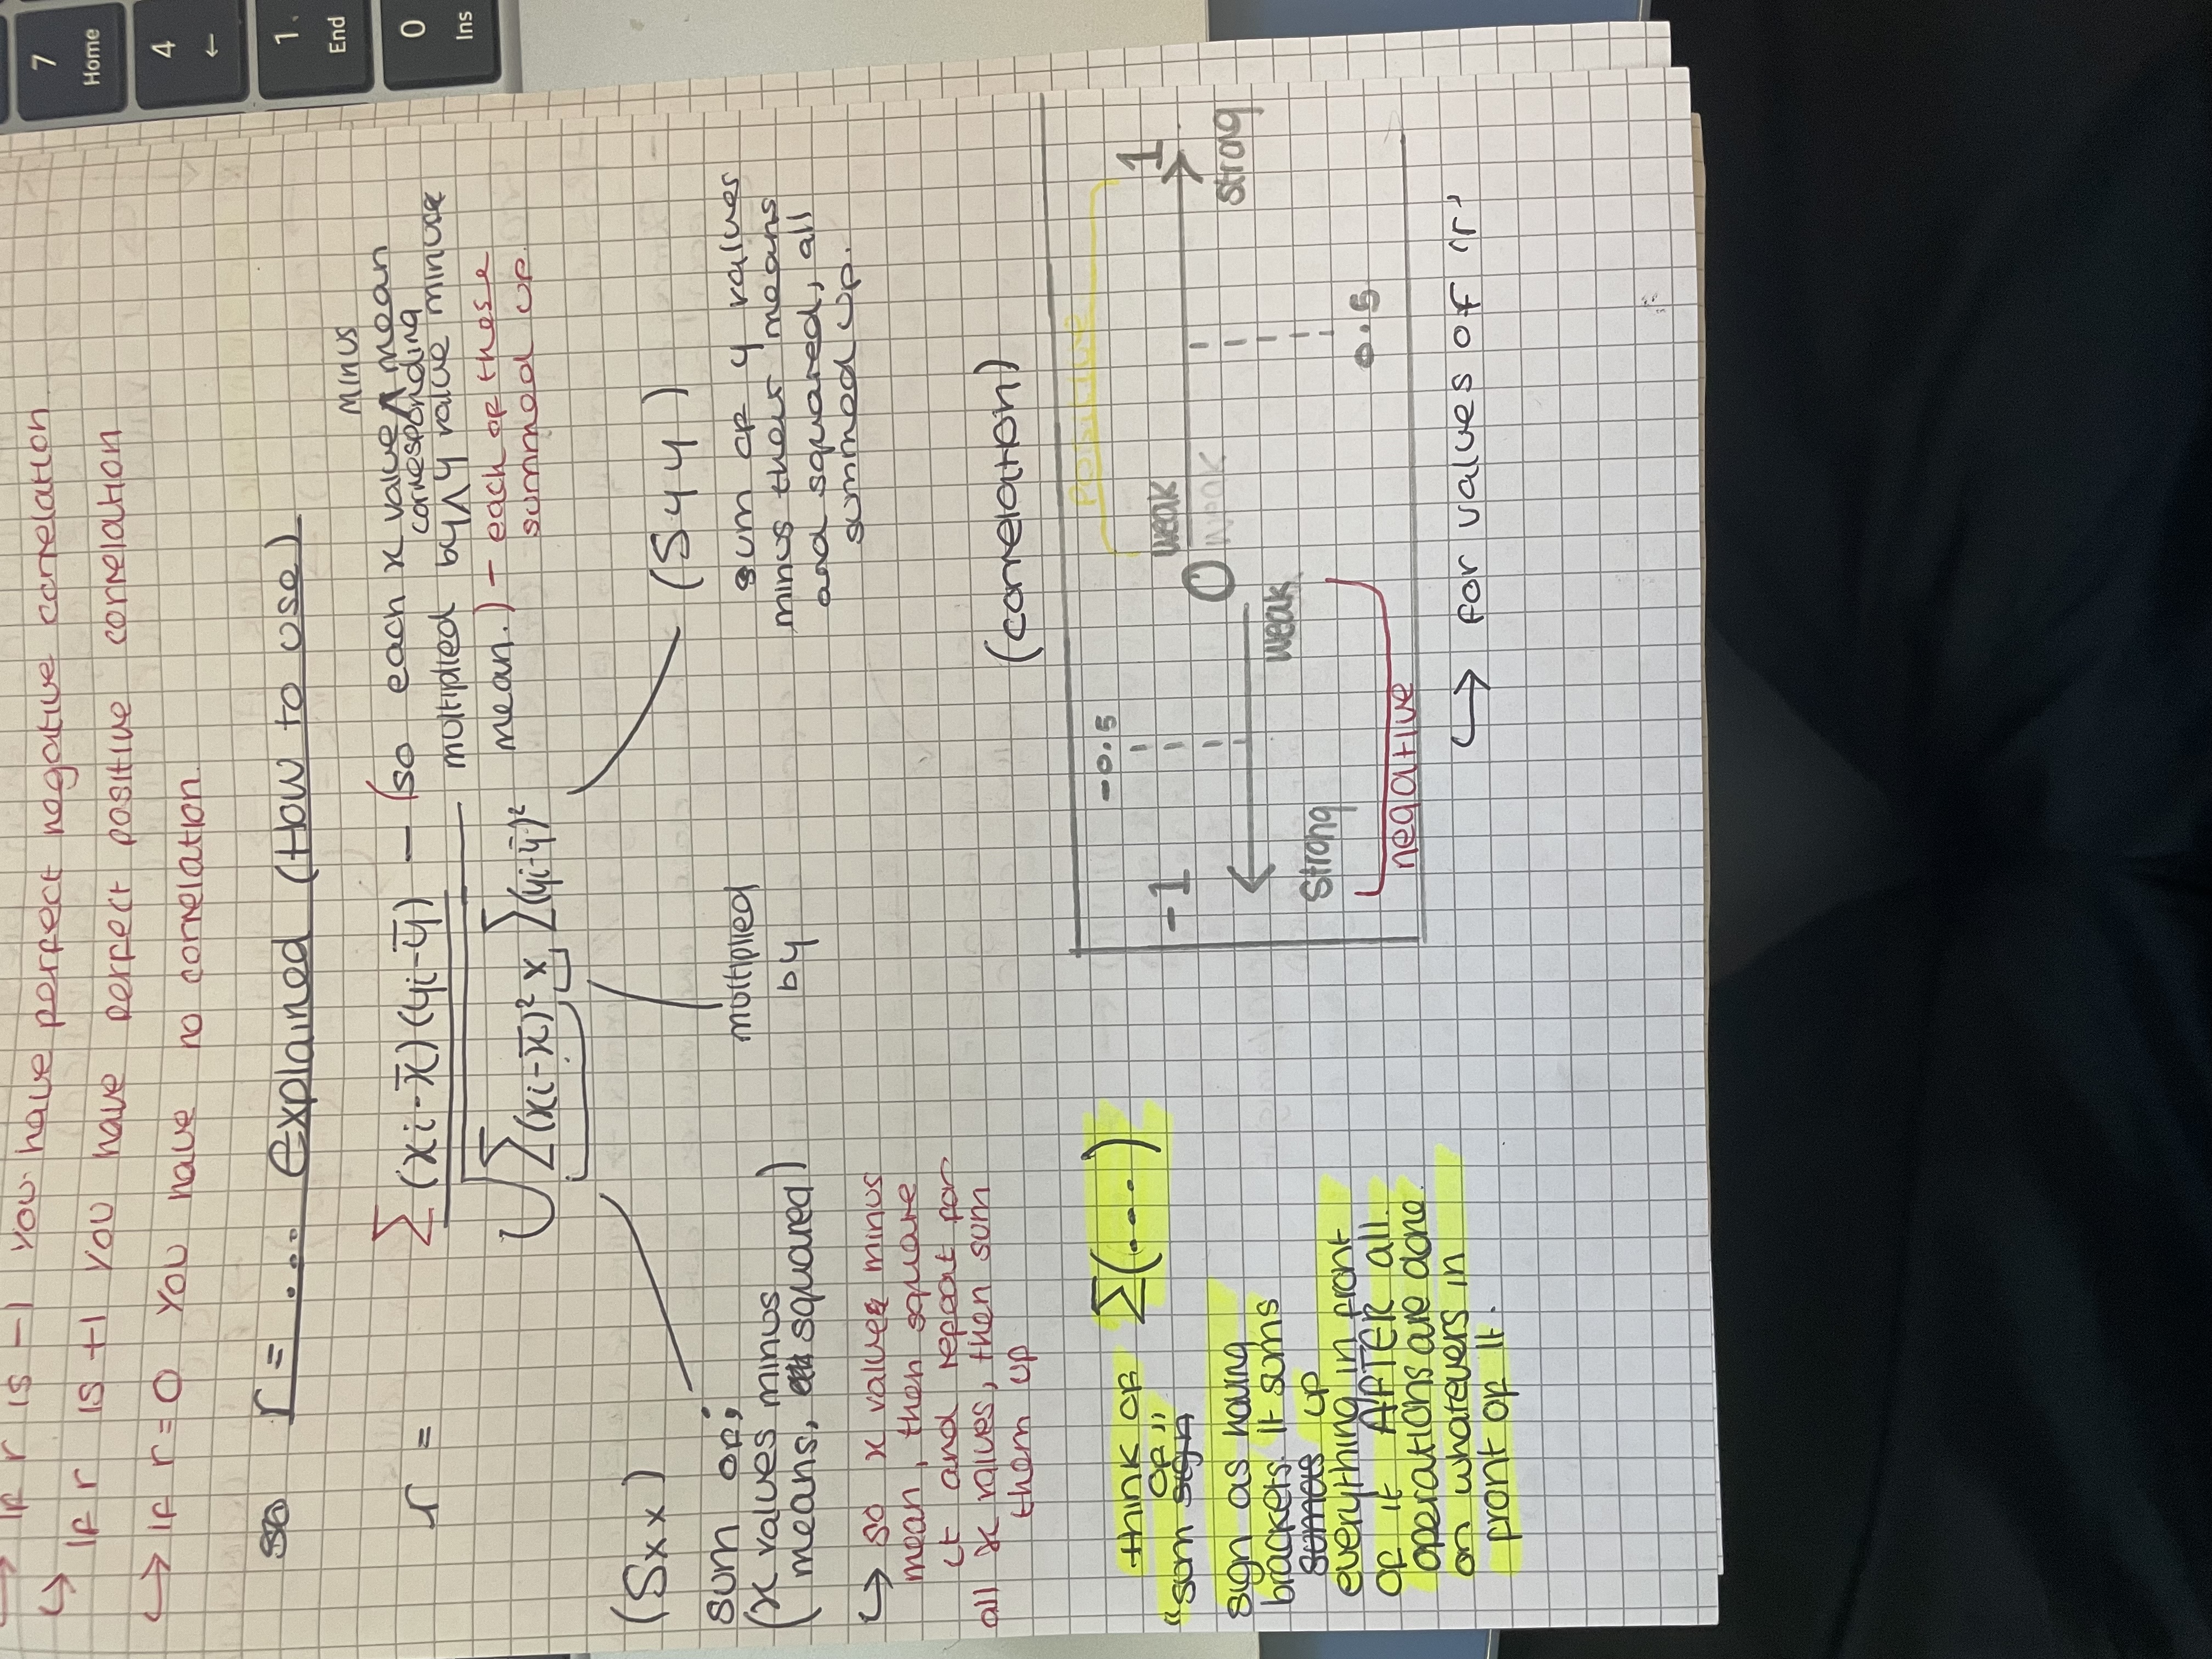
Understanding summation
Think of sum of… as having a bracket after it, it sums up everything in front if it AFTER all operations are completed on whatever’s in front of it.
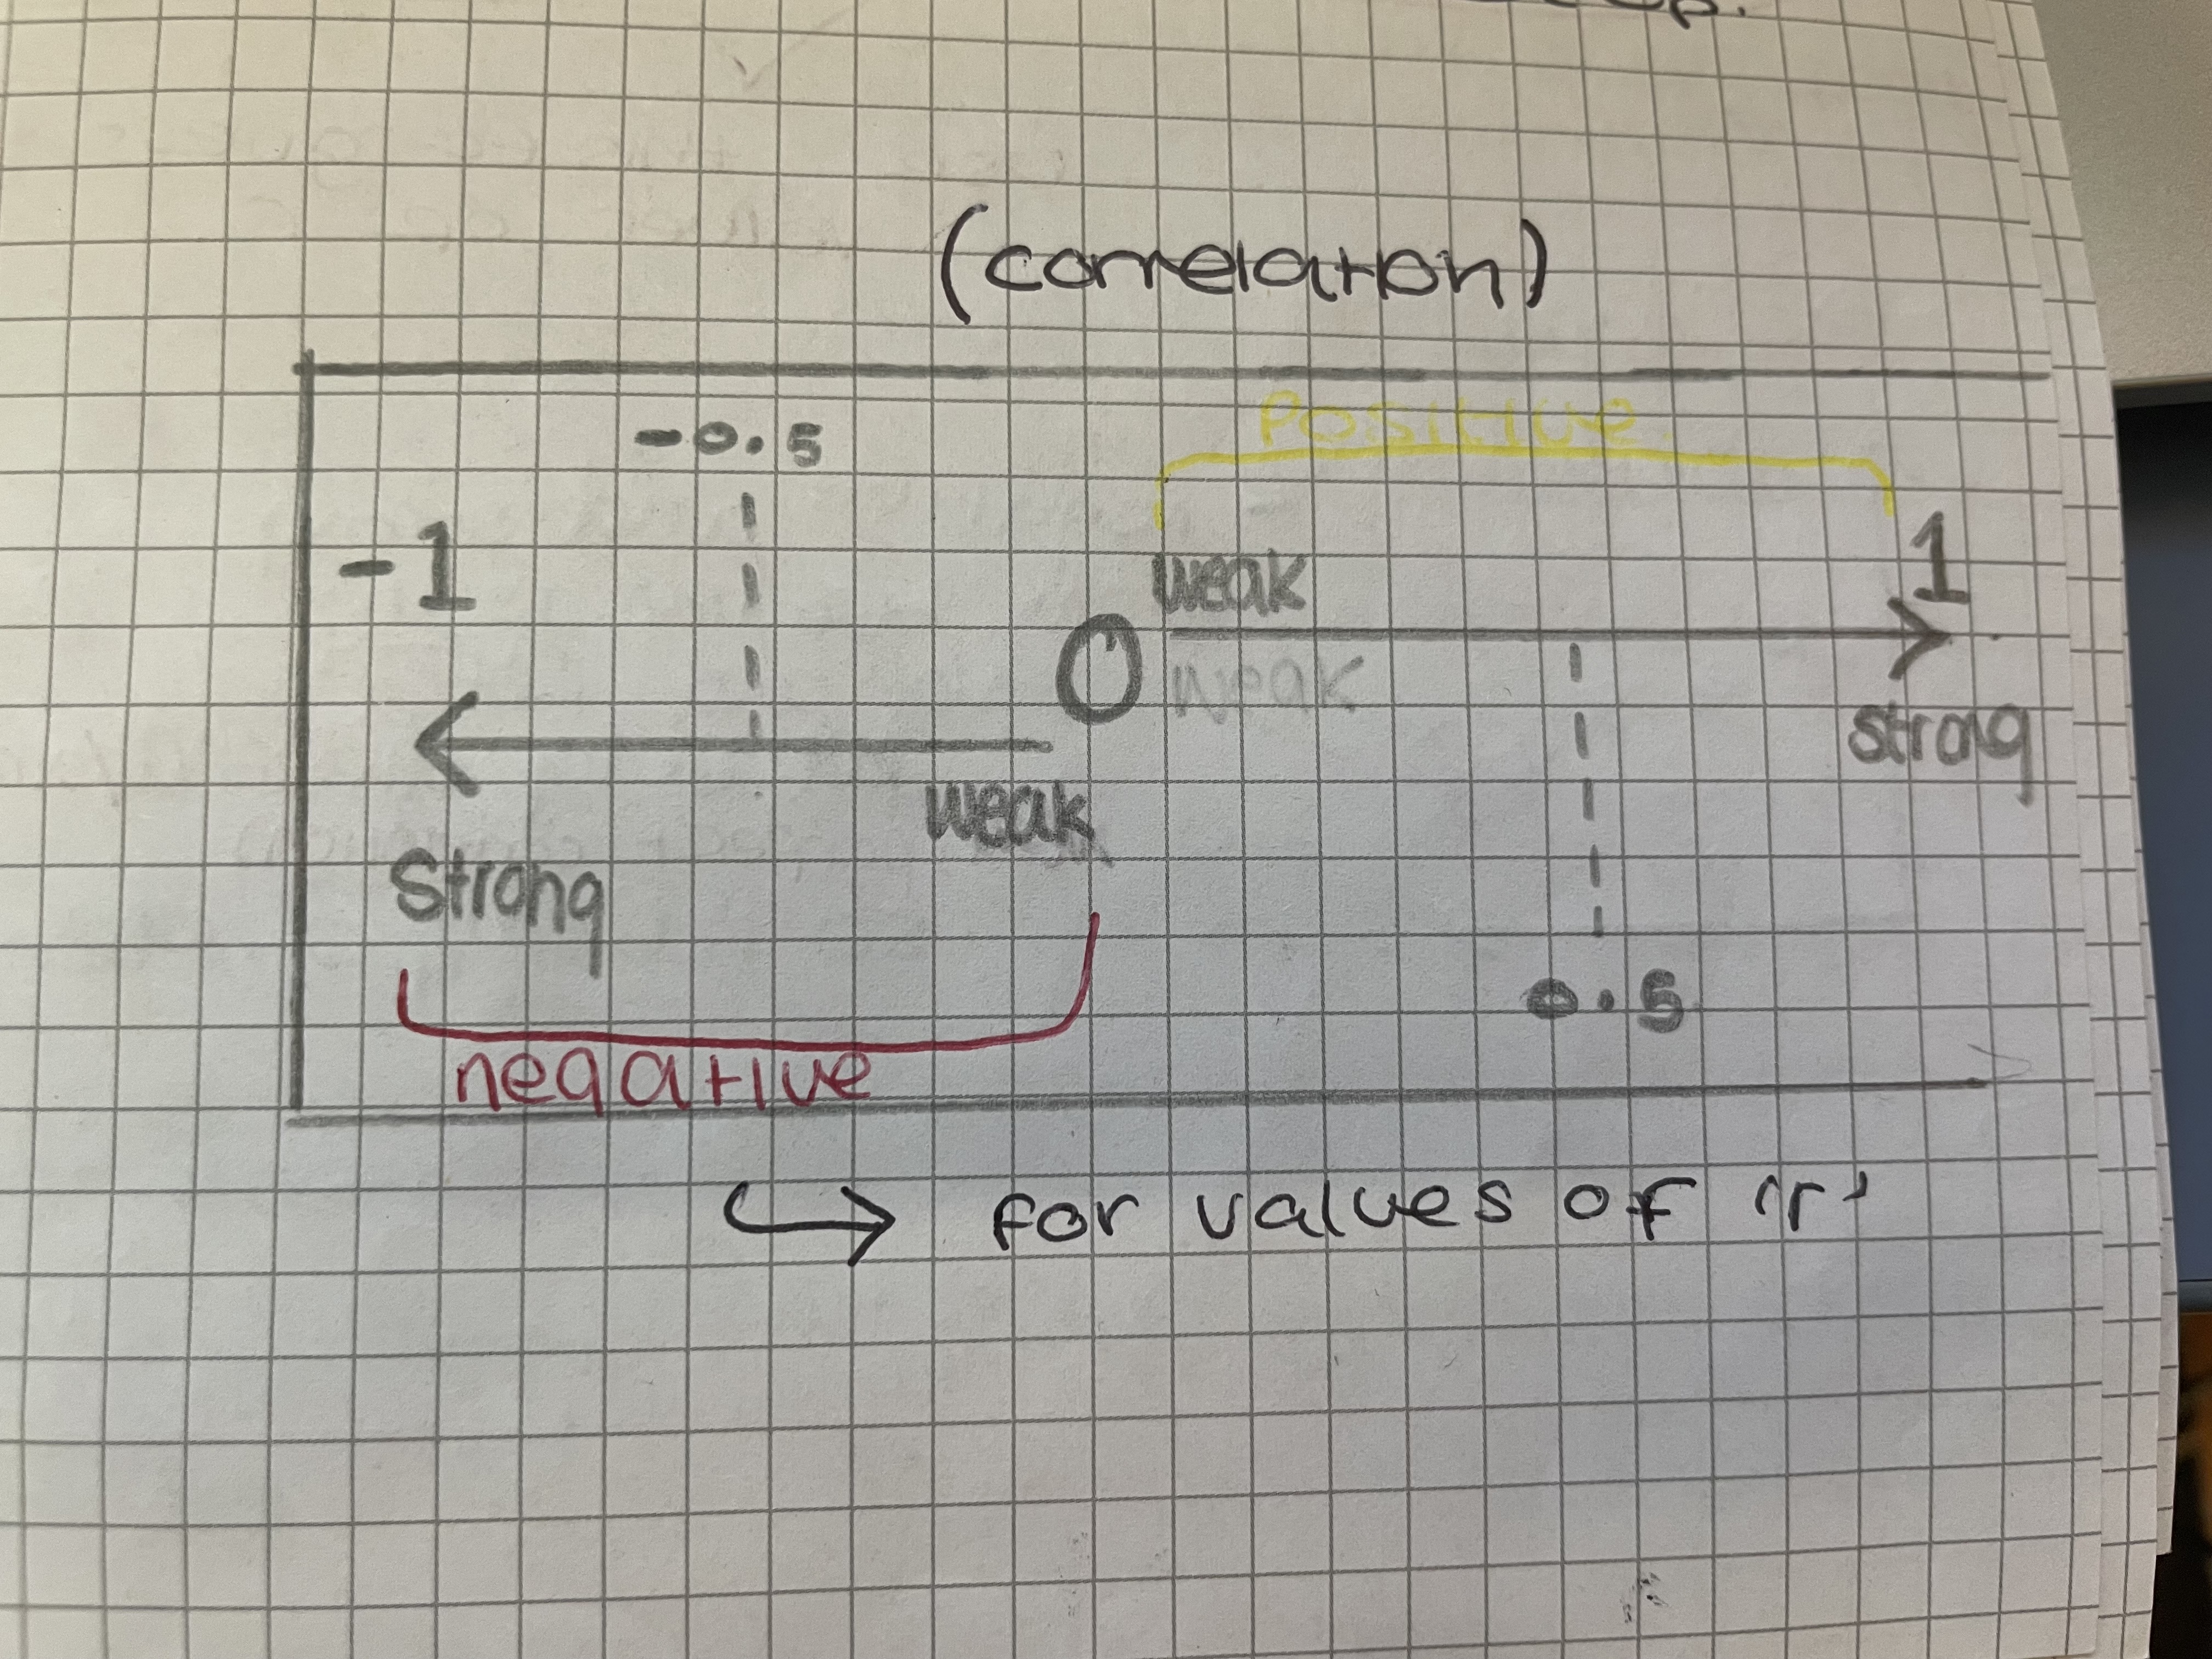
Guessing the PMCC
How do you calculate the PMCC on your calculator
Menu ➡ statistics (2) ➡ y = A + Bx (2) which puts you in bivariate data mode ➡ enter x values and y values (making sure they’re in the correct x1 , x2 … rows) ➡ press AC ➡ press option ➡ regression calculation (3) ➡ r value is our PMCC
Strong/ weak correlation is determined by…?
How close values are to each other.
No correlation = far apart and no specific direction
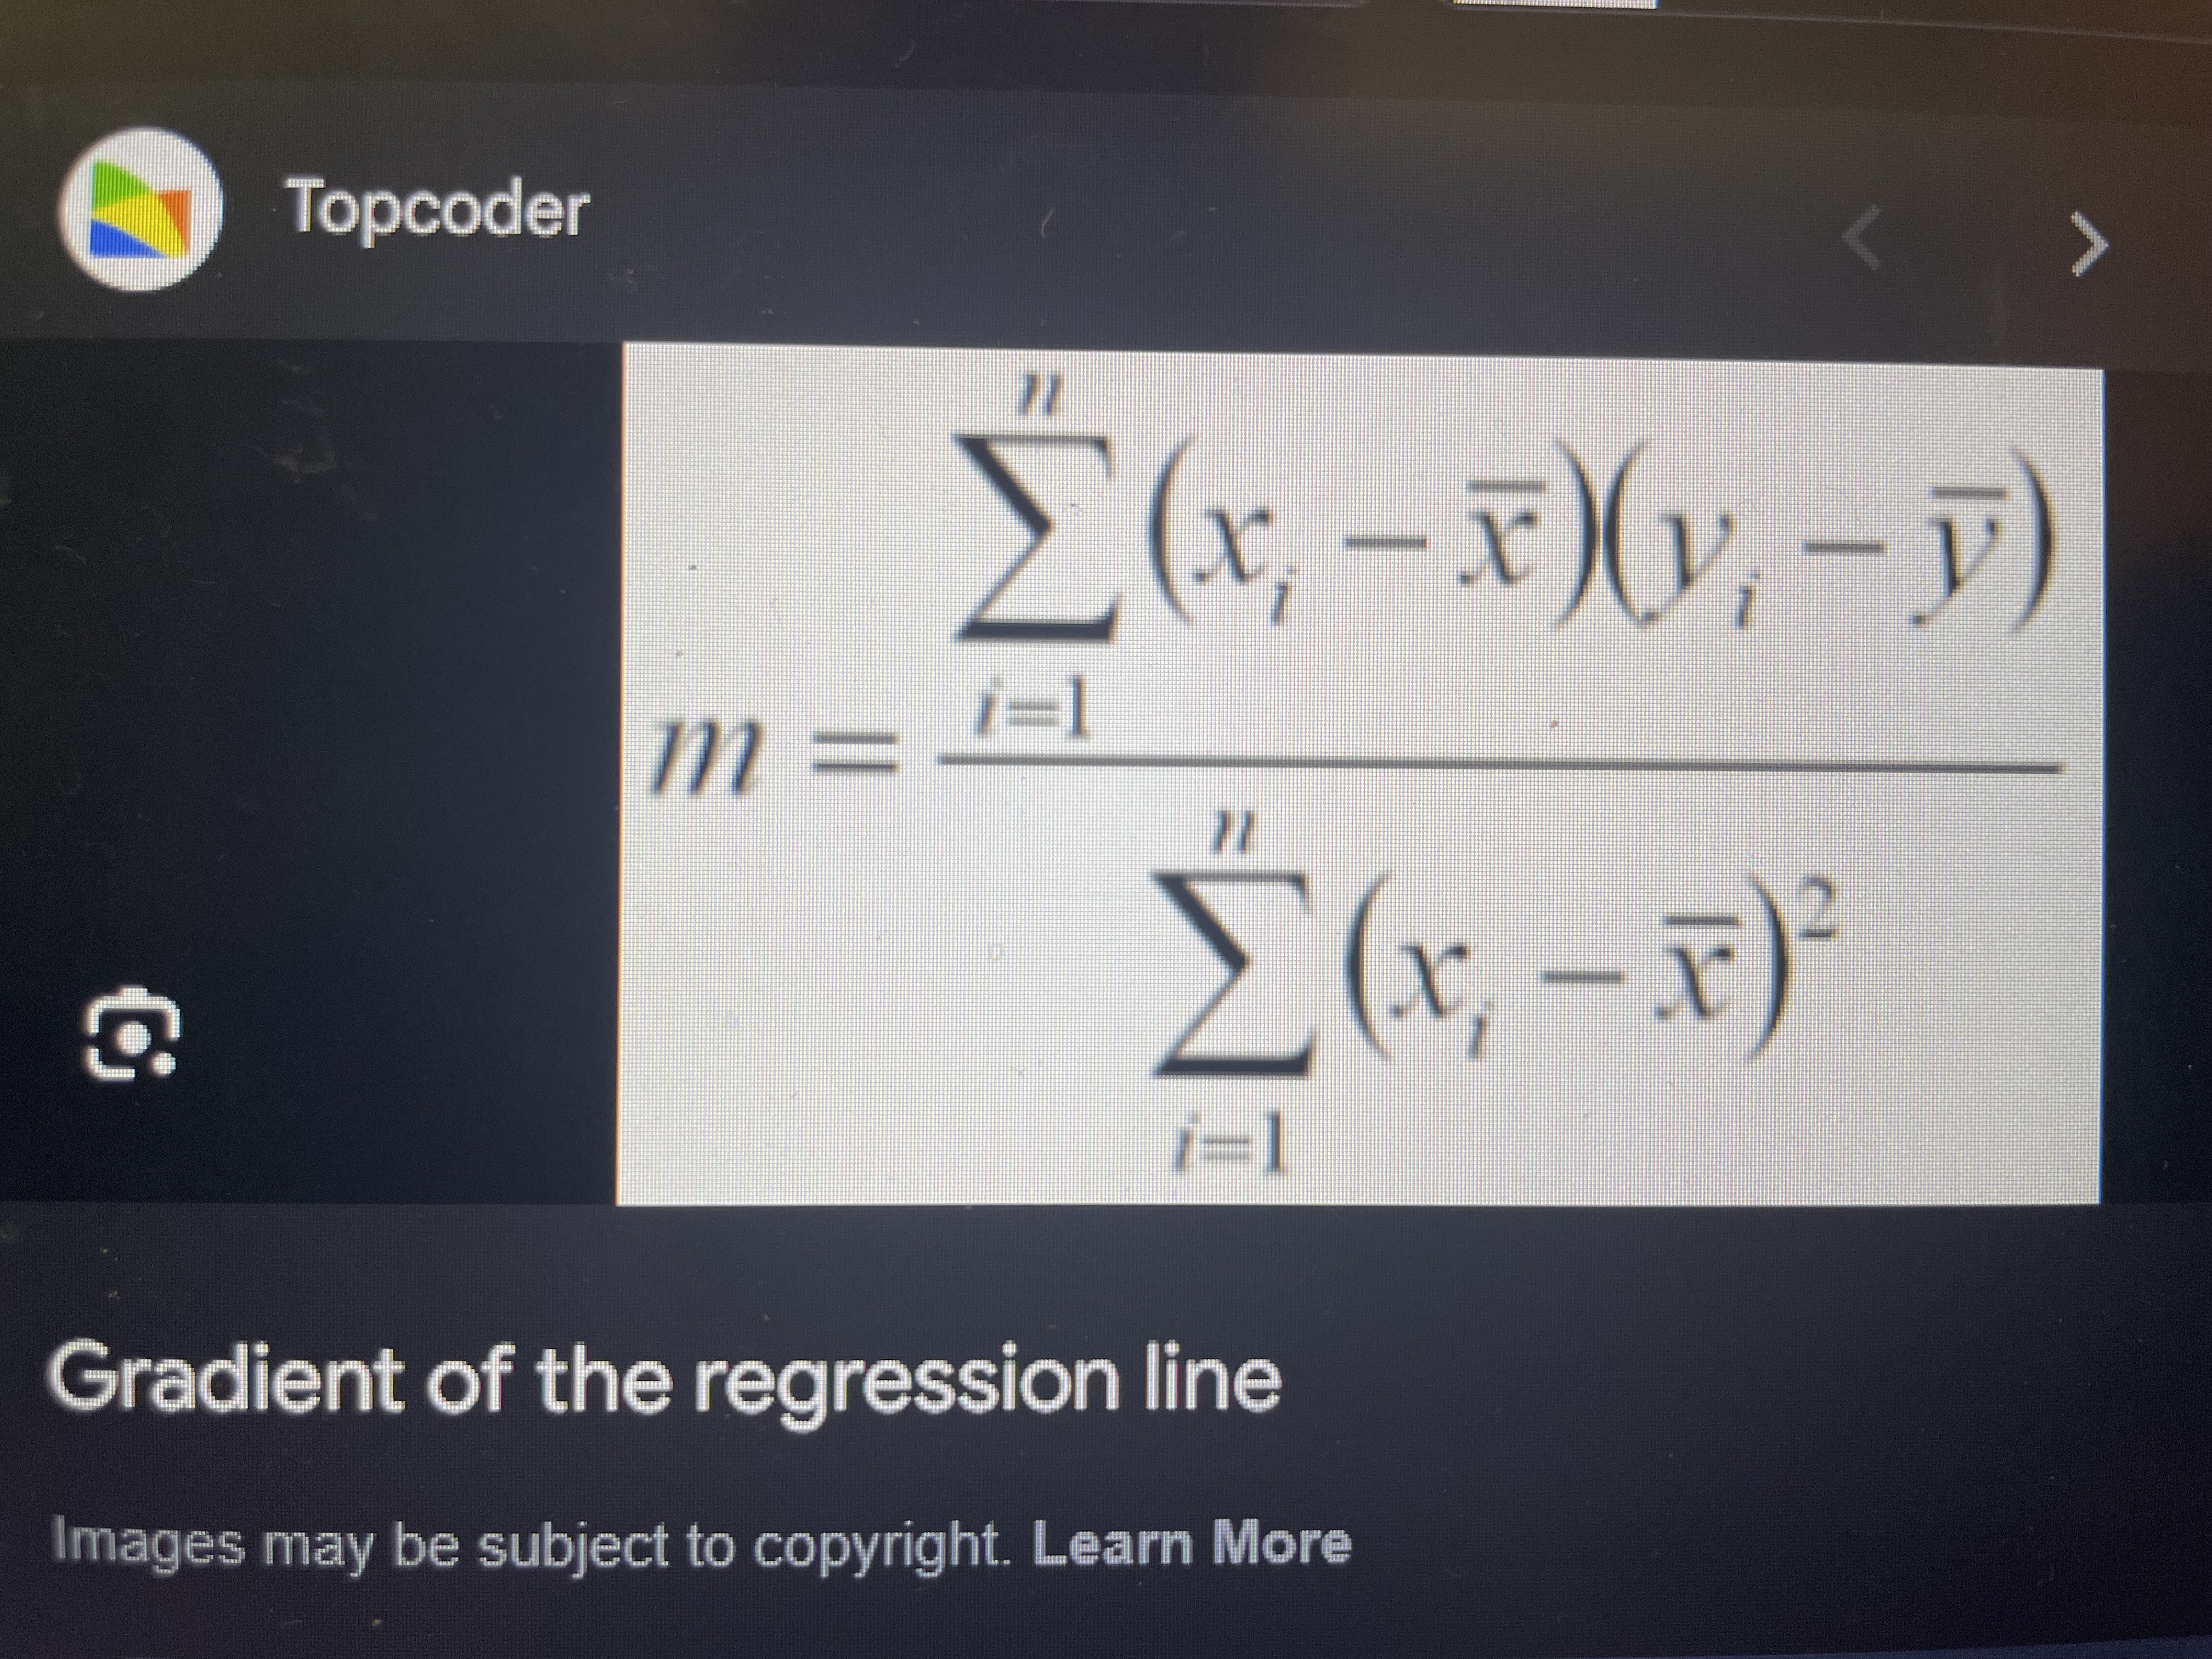
Finding the equation of a regression line.
. Equation if regression line….
. y = a + bx (basically… y = mx + c)
. b = gradient = Sxy/Sxx - See picture
. Passes through (x̄, ȳ) so just need another point to be able to work out equation
. Calculator can generate values for a and b, a is our y intercept so that will give us another point.
. If the regression line doesn’t have any y intercept then we can just choose a value of x, plug it into our new calculator- generated equation of regression line and find the y value
. Plot your new point and connect it to (x̄, ȳ) that is your regression line
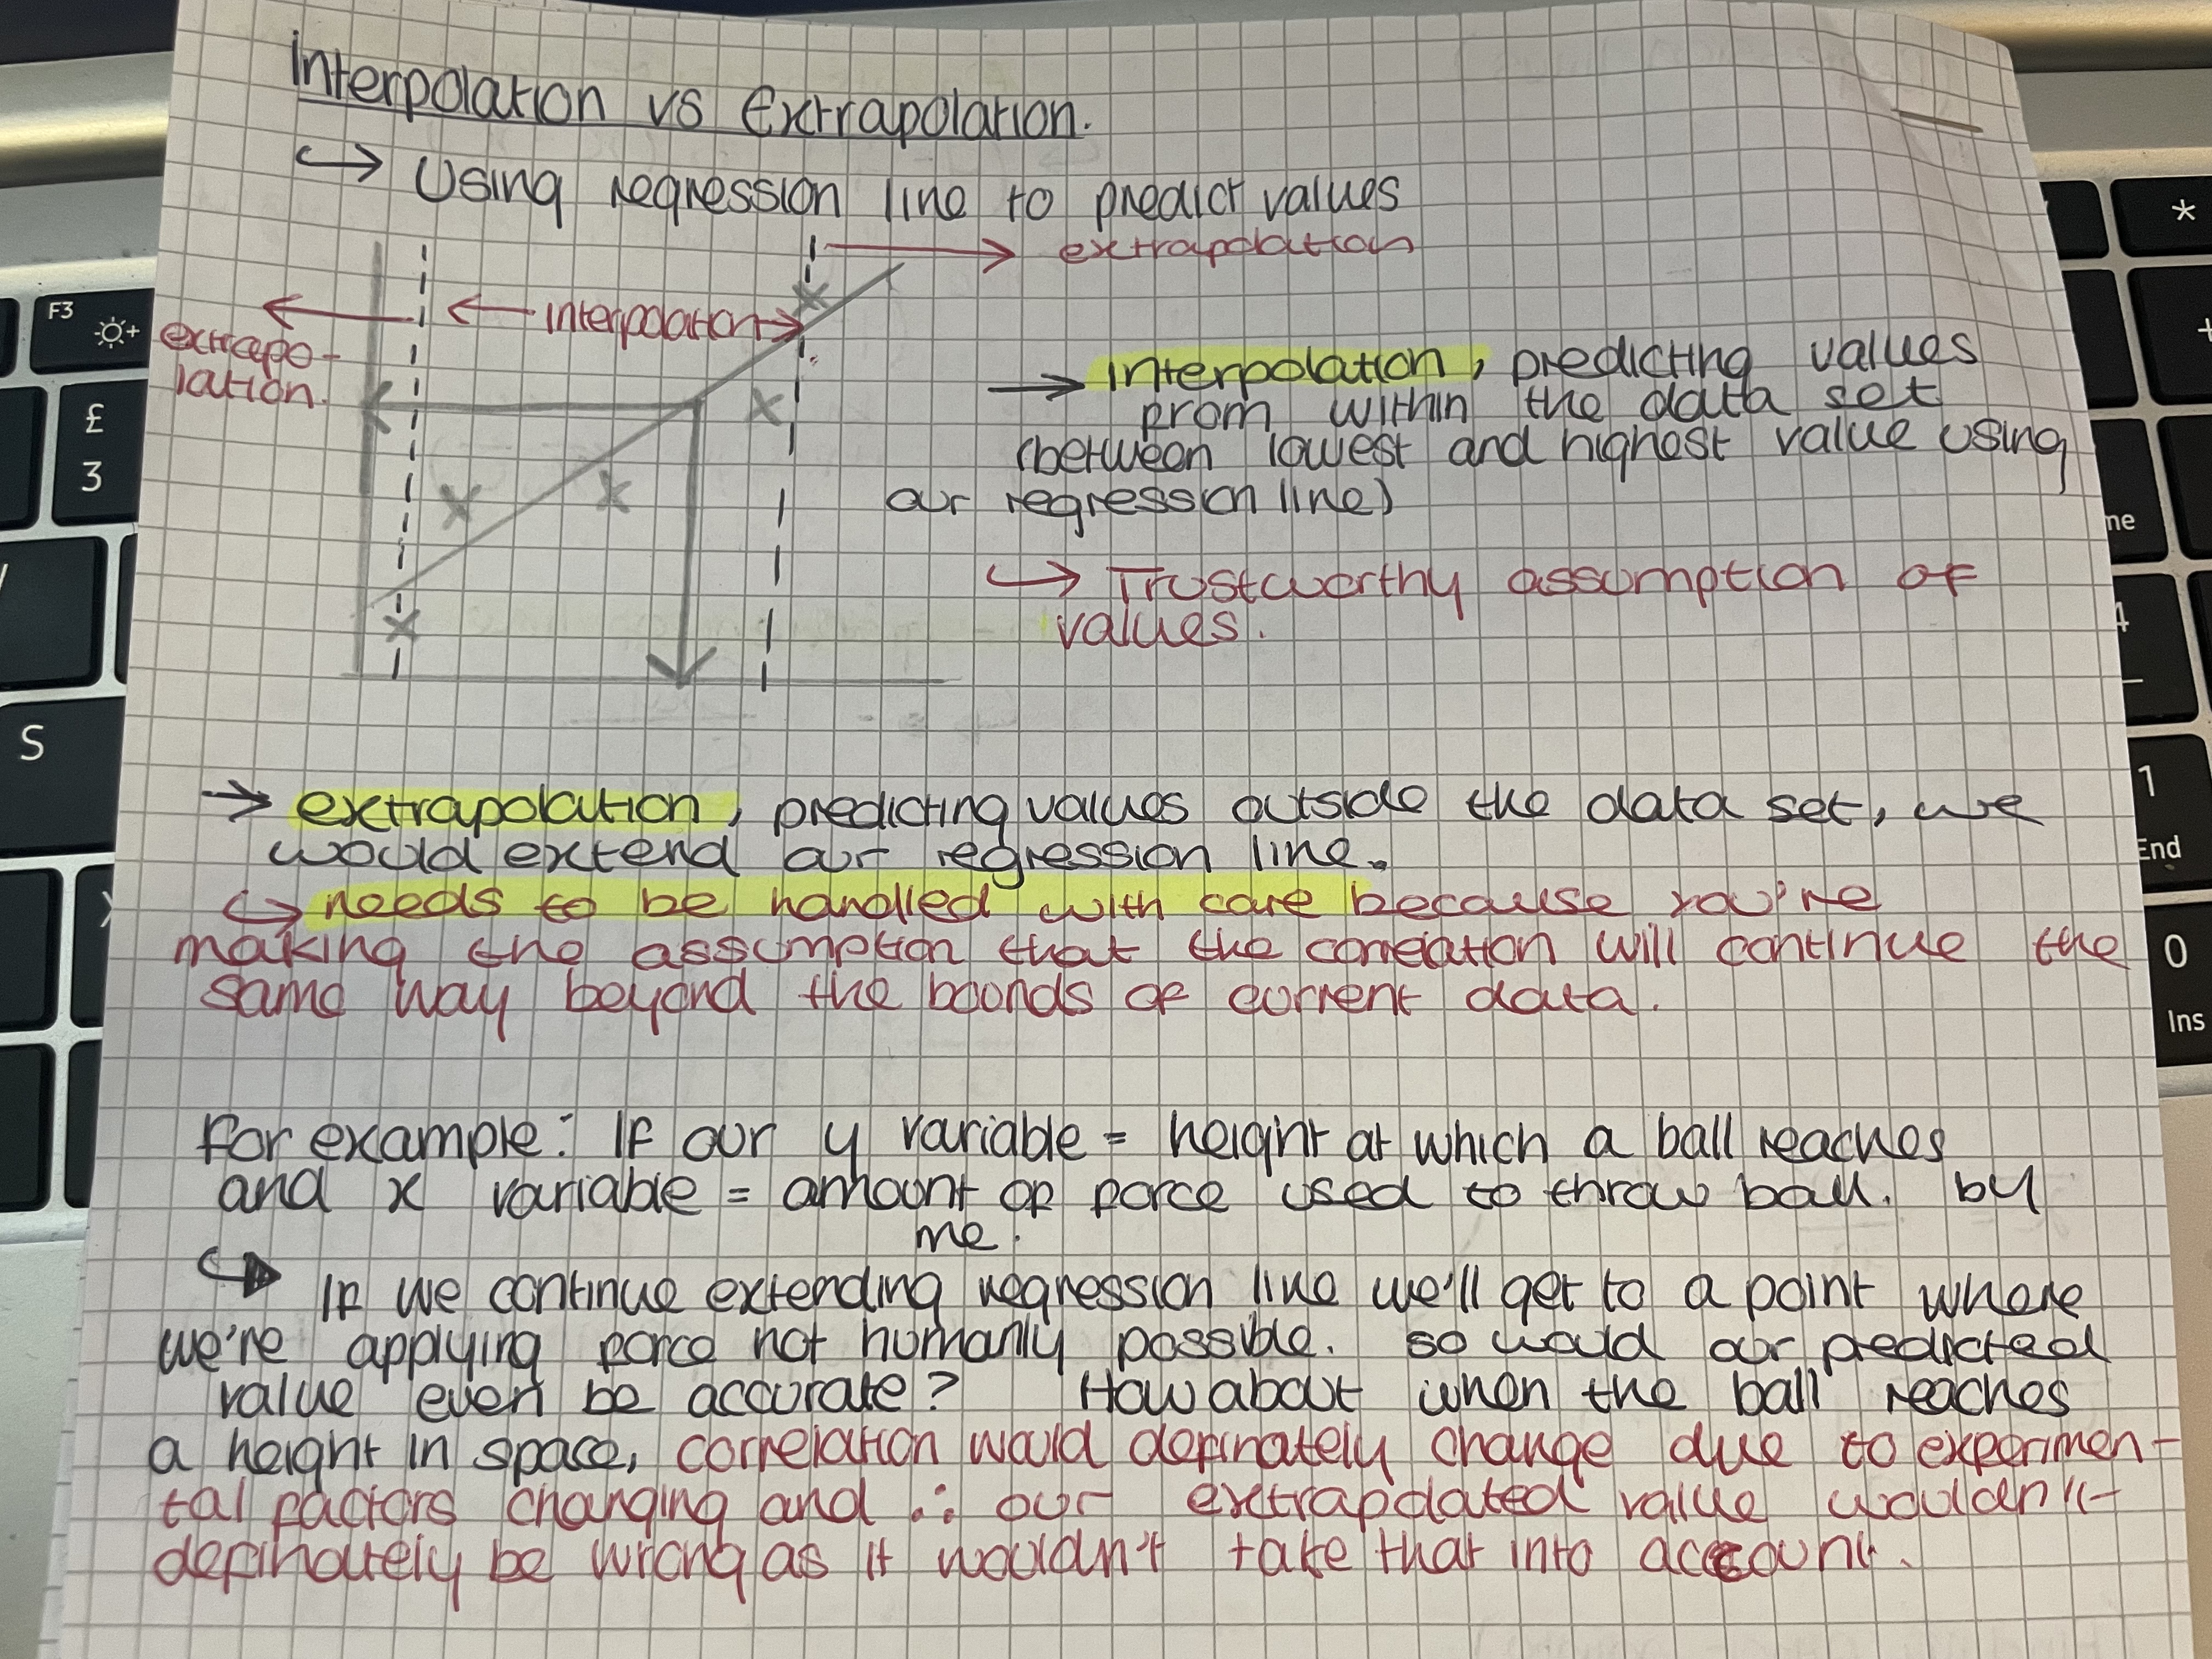
Interpolation and extrapolation
What is a trial? (Probability)
. A trial is when there are 2 possible outcomes from an experiment A and its complement A’ e.g flipping a coin
Theoretical probability
What is expected to happen based on mathematics - works when outcome are equally likely
. = number of outcomes you want/ total number of possible outcomes
. (Ts you always do)
What are expected frequencies
. When you estimate the number of times a specific event will occur during a certain number of trials
. Expected frequency = number of trials x probability of particular event occurring
. The more times an experiment is done, the closer the results are likely to be the expected frequency
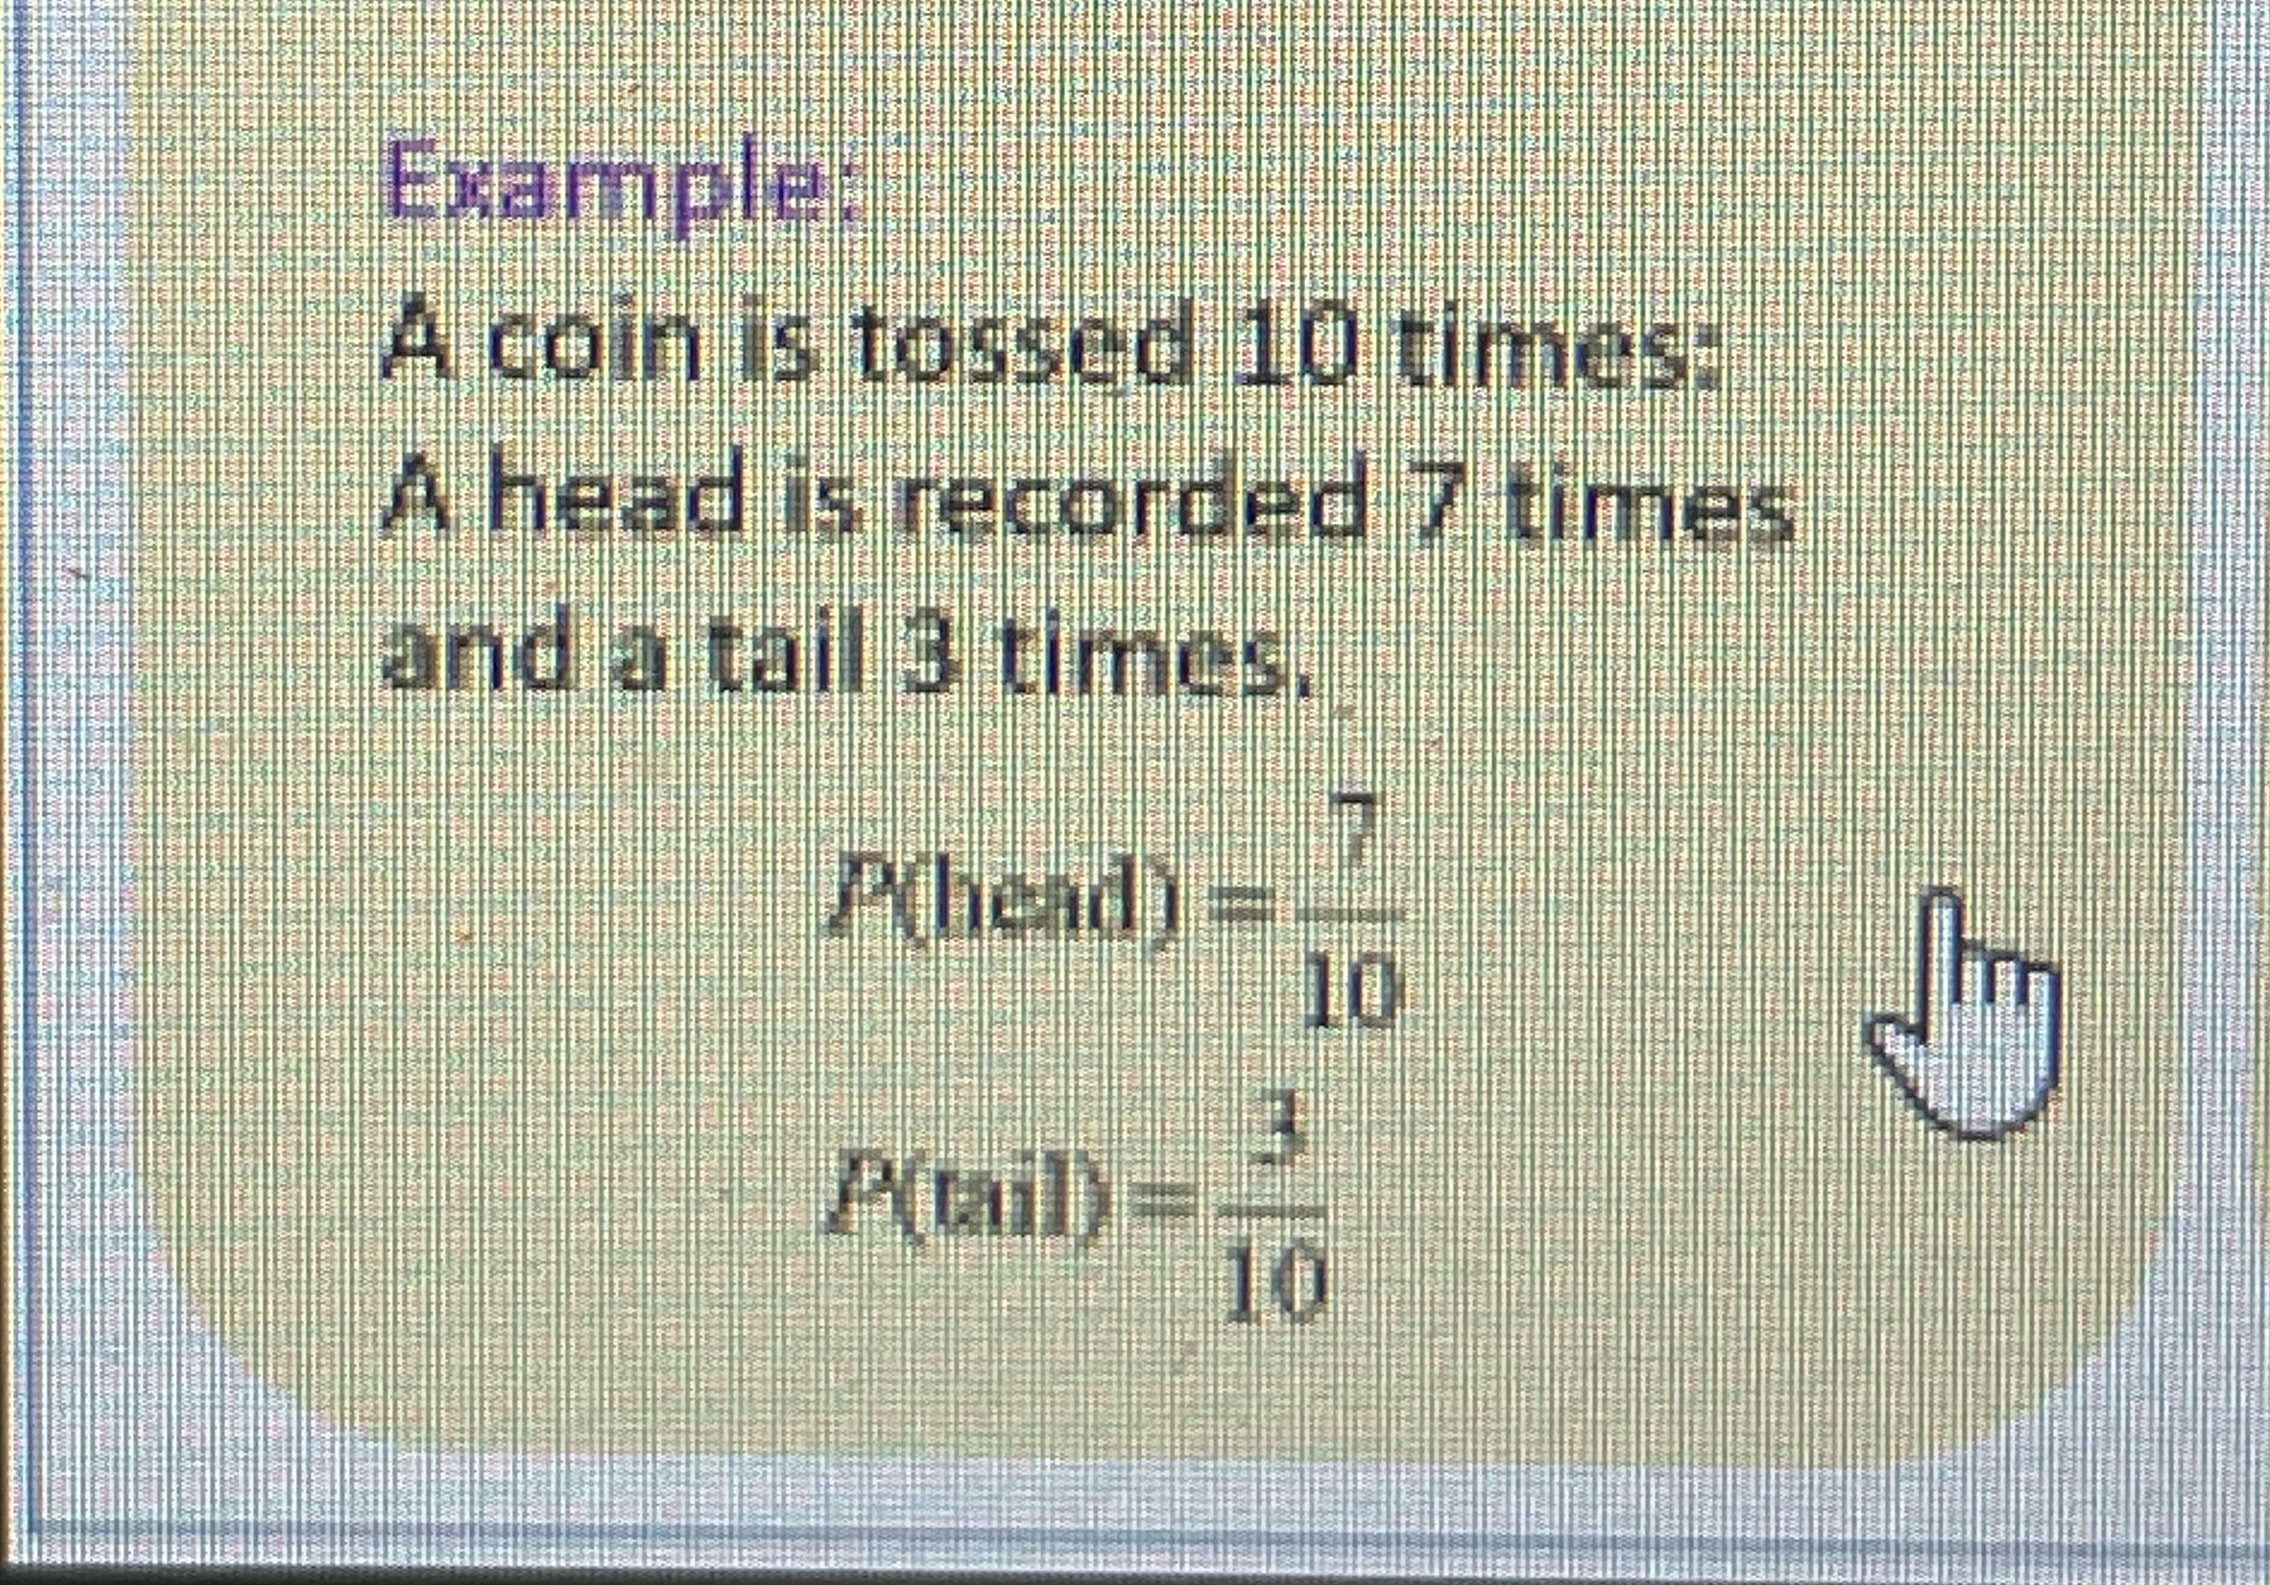
What is experimental probability
. Probability where there isn’t countable, equally likely outcomes like we don’t know the “contents of the bag”
. We take a sample of random draws and use that to make our assumptions
. Therefore experimental probability = number of favourable outcomes (from sample of random draws)/ total number of random draws
Calculate the experimental probability (example)
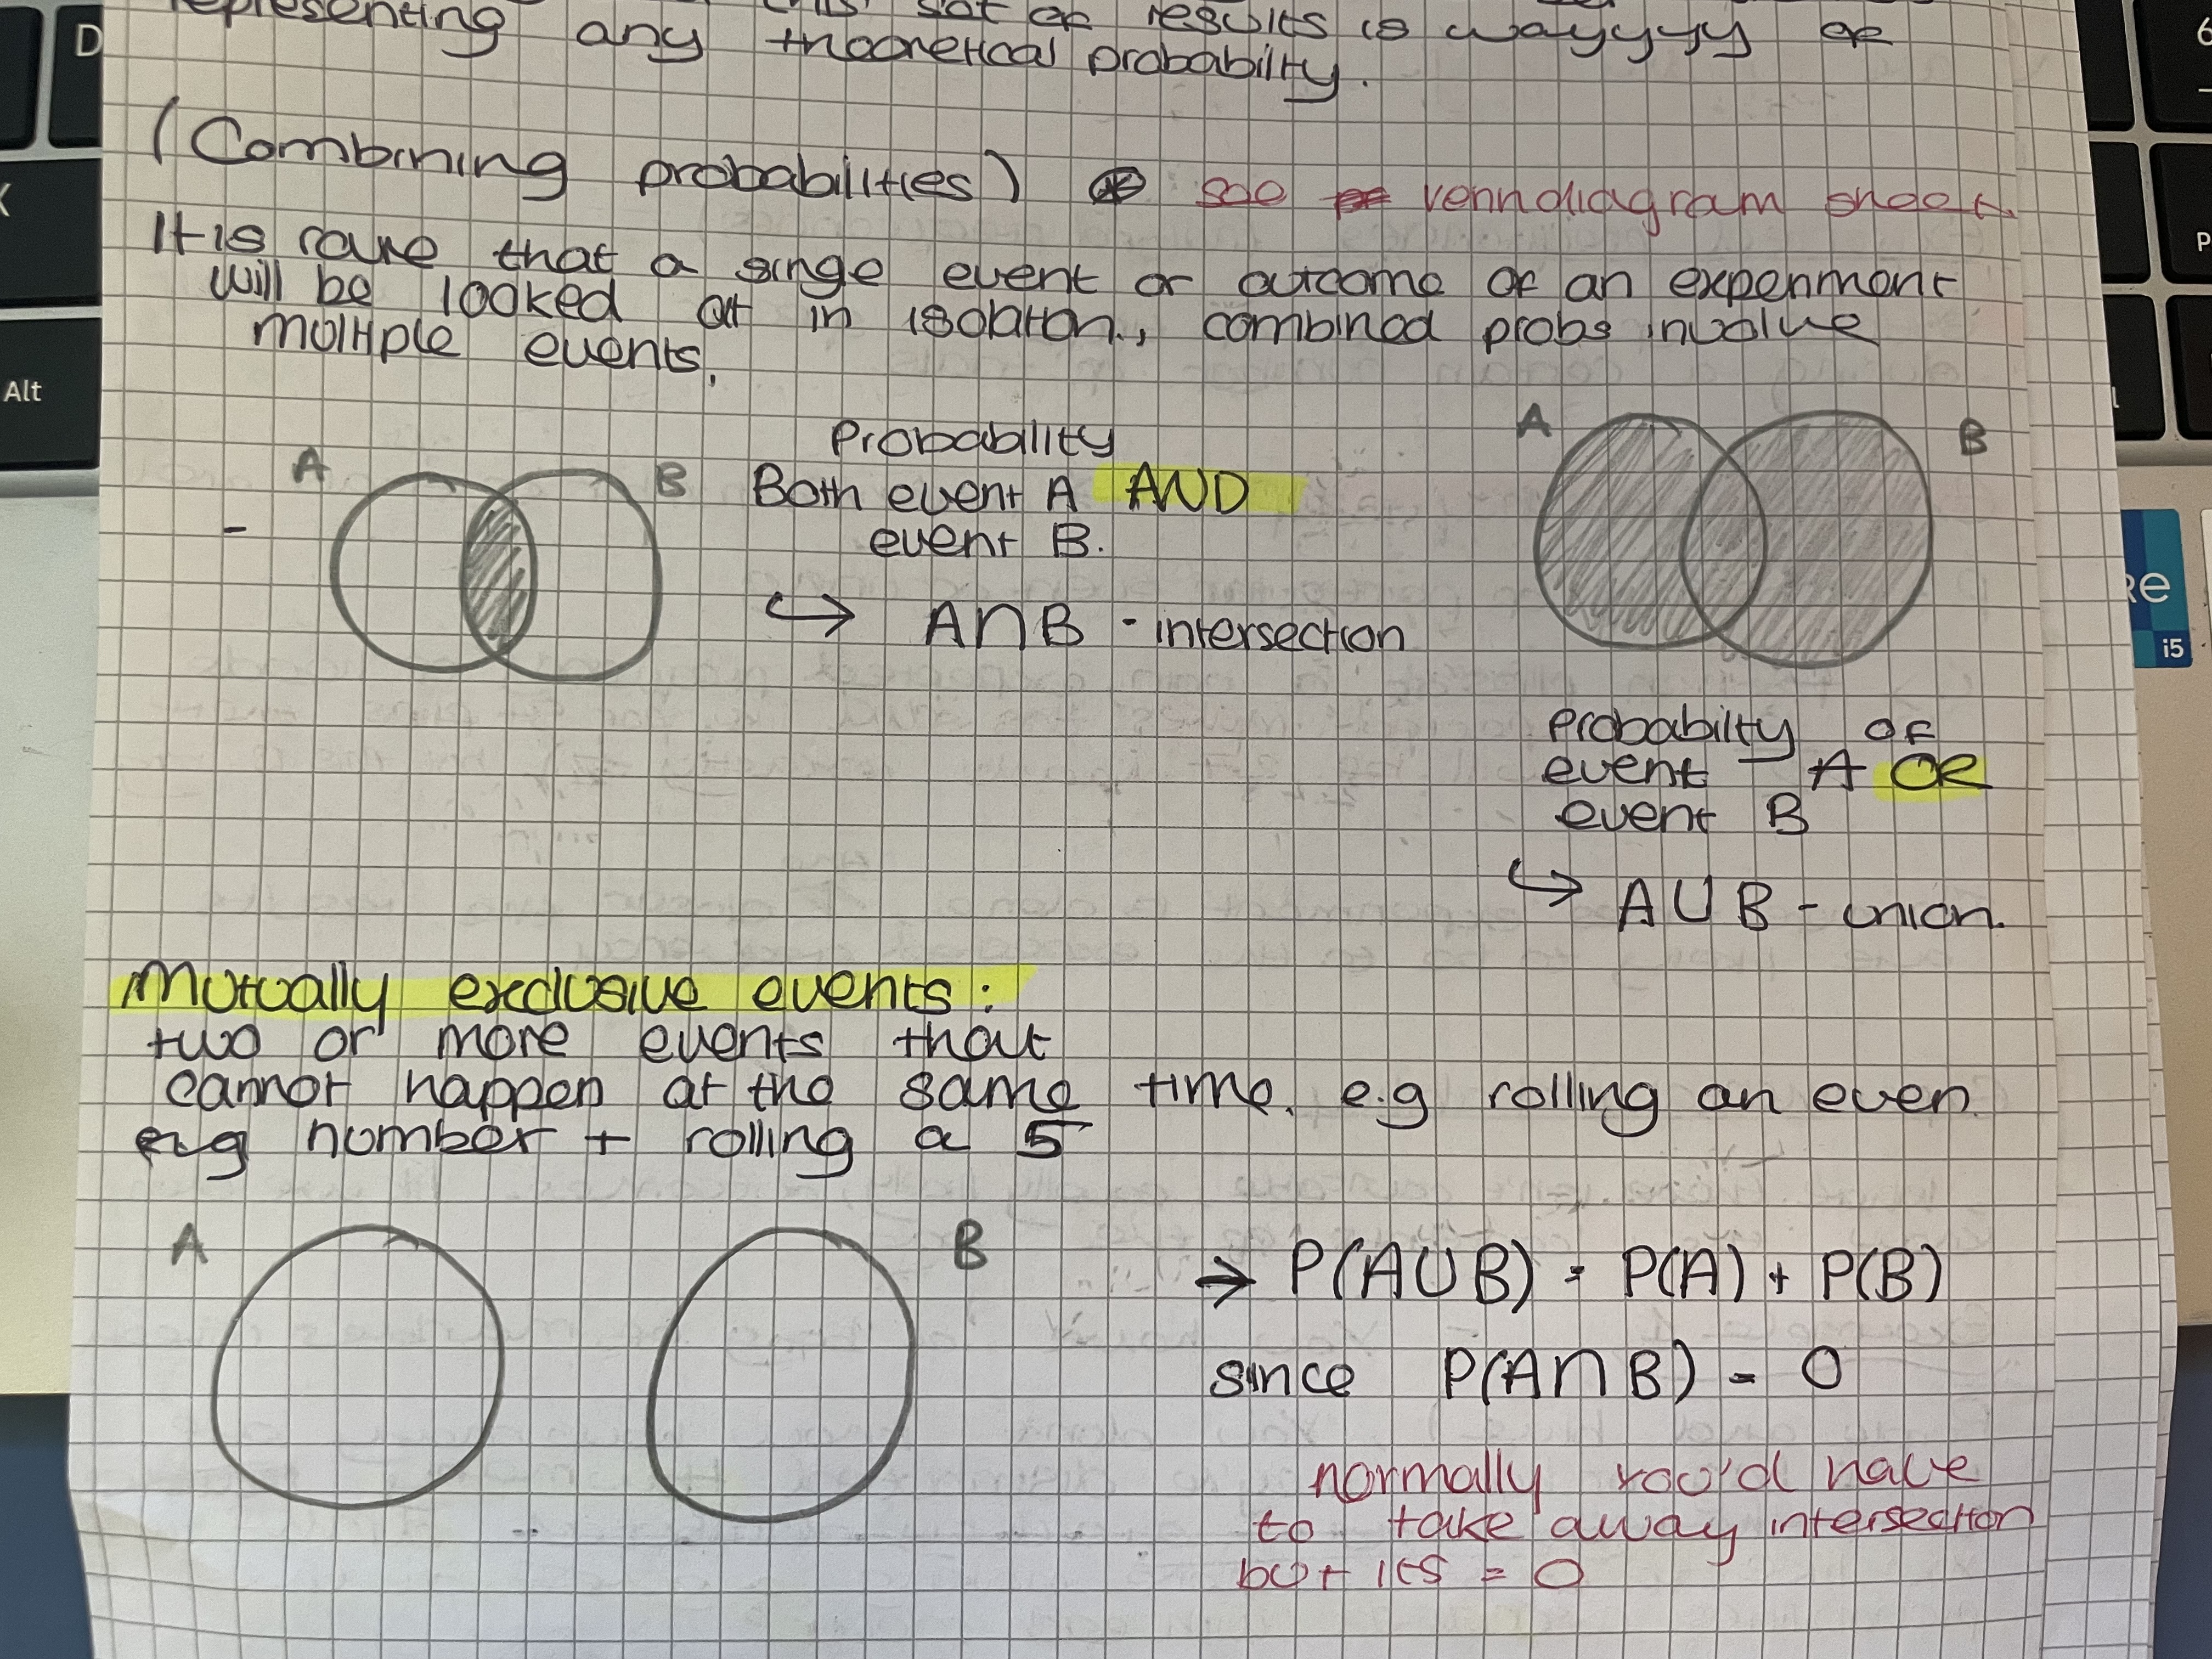
What are combined probabilities
Probabilities derived from multiple events.
Venn diagrams
What are exhaustive events?
. Events which include all the possible outcomes of an experiment. The probability of a SET of exhaustive events = 1 (since there’s an 100% chance you do any of them) e.g (A U A’)
. (A U A’) is exhaustive as you either get A or A’
. Almost all probability you do is exhaustive
Probability of mutually exclusive events
. Probability of mutually exclusive events - P(AUB) = P(A) + P(B) - P(A∩B) since they cannot occur together (A∩B) = 0
Probability of exhaustive events
= 1
e.g tree diagram of all possible outcomes in an experiment.
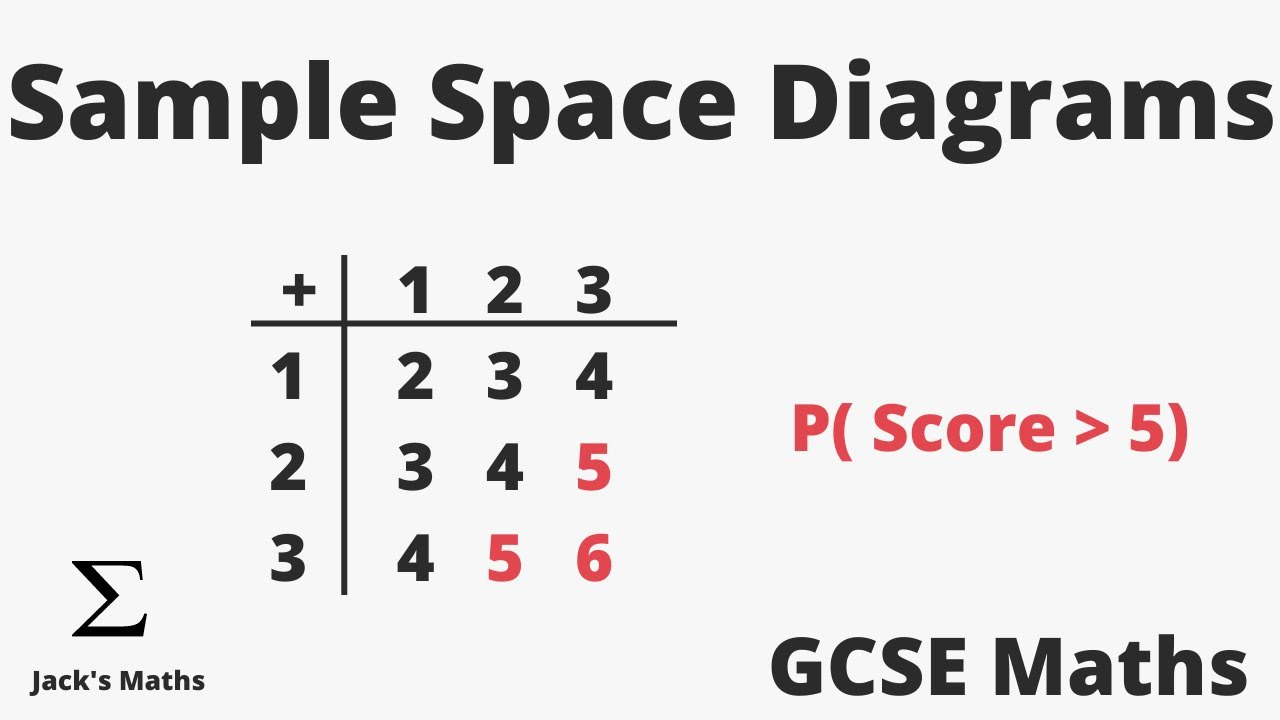
Sample space diagram
. Grid that shows all possible outcomes of an event
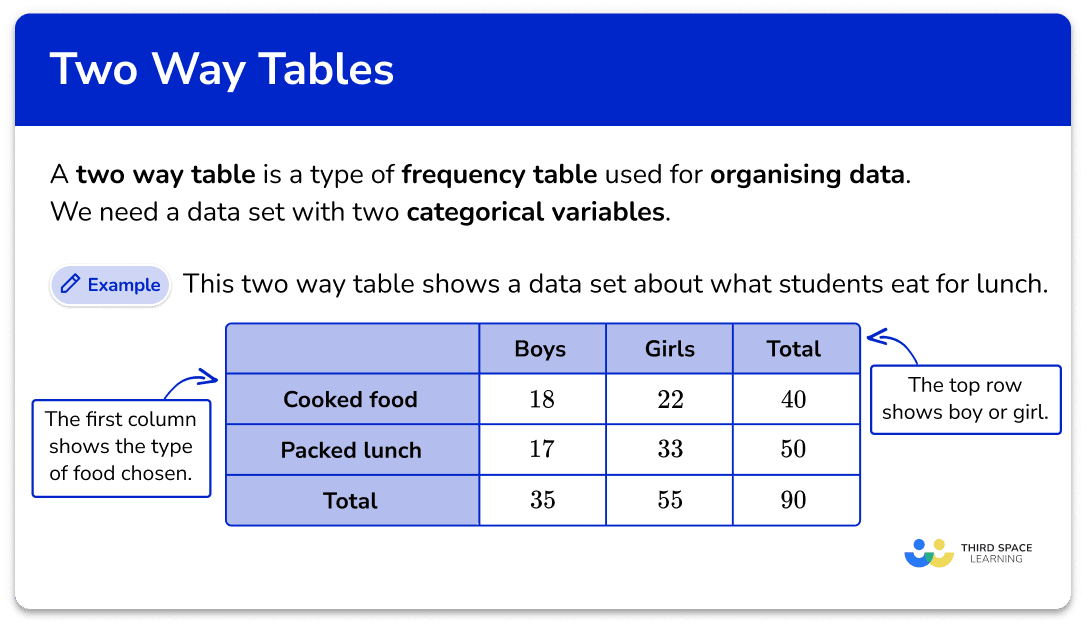
Two way table is..
. used to show frequencies from 2 variables, the cells within the table showing the combined frequencies of the 2 variables combined
. Use the formula P(AUB) = P(A) + P(B) - P(A∩B)
Discrete variables are
. Variables that can take discrete values from a given numerical set
Discrete = finite/countable number of outcomes e.g whole numbers or specific categories.
What is the discrete variable X (not always X used)
The possible set of values that are events from the experiment
e.g for rolling a di twice X = {1, 2, 3, 4, 5, 6,…,12} which represents the outcomes of rolling a die.
for the sum of
X = {x where XEZ+} meaning
x “belongs to” (E meaning belongs to) a set of integers that are positive
lowercase x representing all the values in the SET of positive integers
Categorical Discrete variable X example
X = {0 if results is tails, 1 if result is heads}
. Same thing as {0,1} except 0 and 1 represent something
Discrete random variables
Since the discrete variables you are considering are outcomes from an experiment who’s outcome is random these variables are called discrete random variables.
Notation P(X=x)
represents the probability that a discrete random variable X takes the value x.
discrete uniform distribution
all possible values are equally likely in a given range or set.
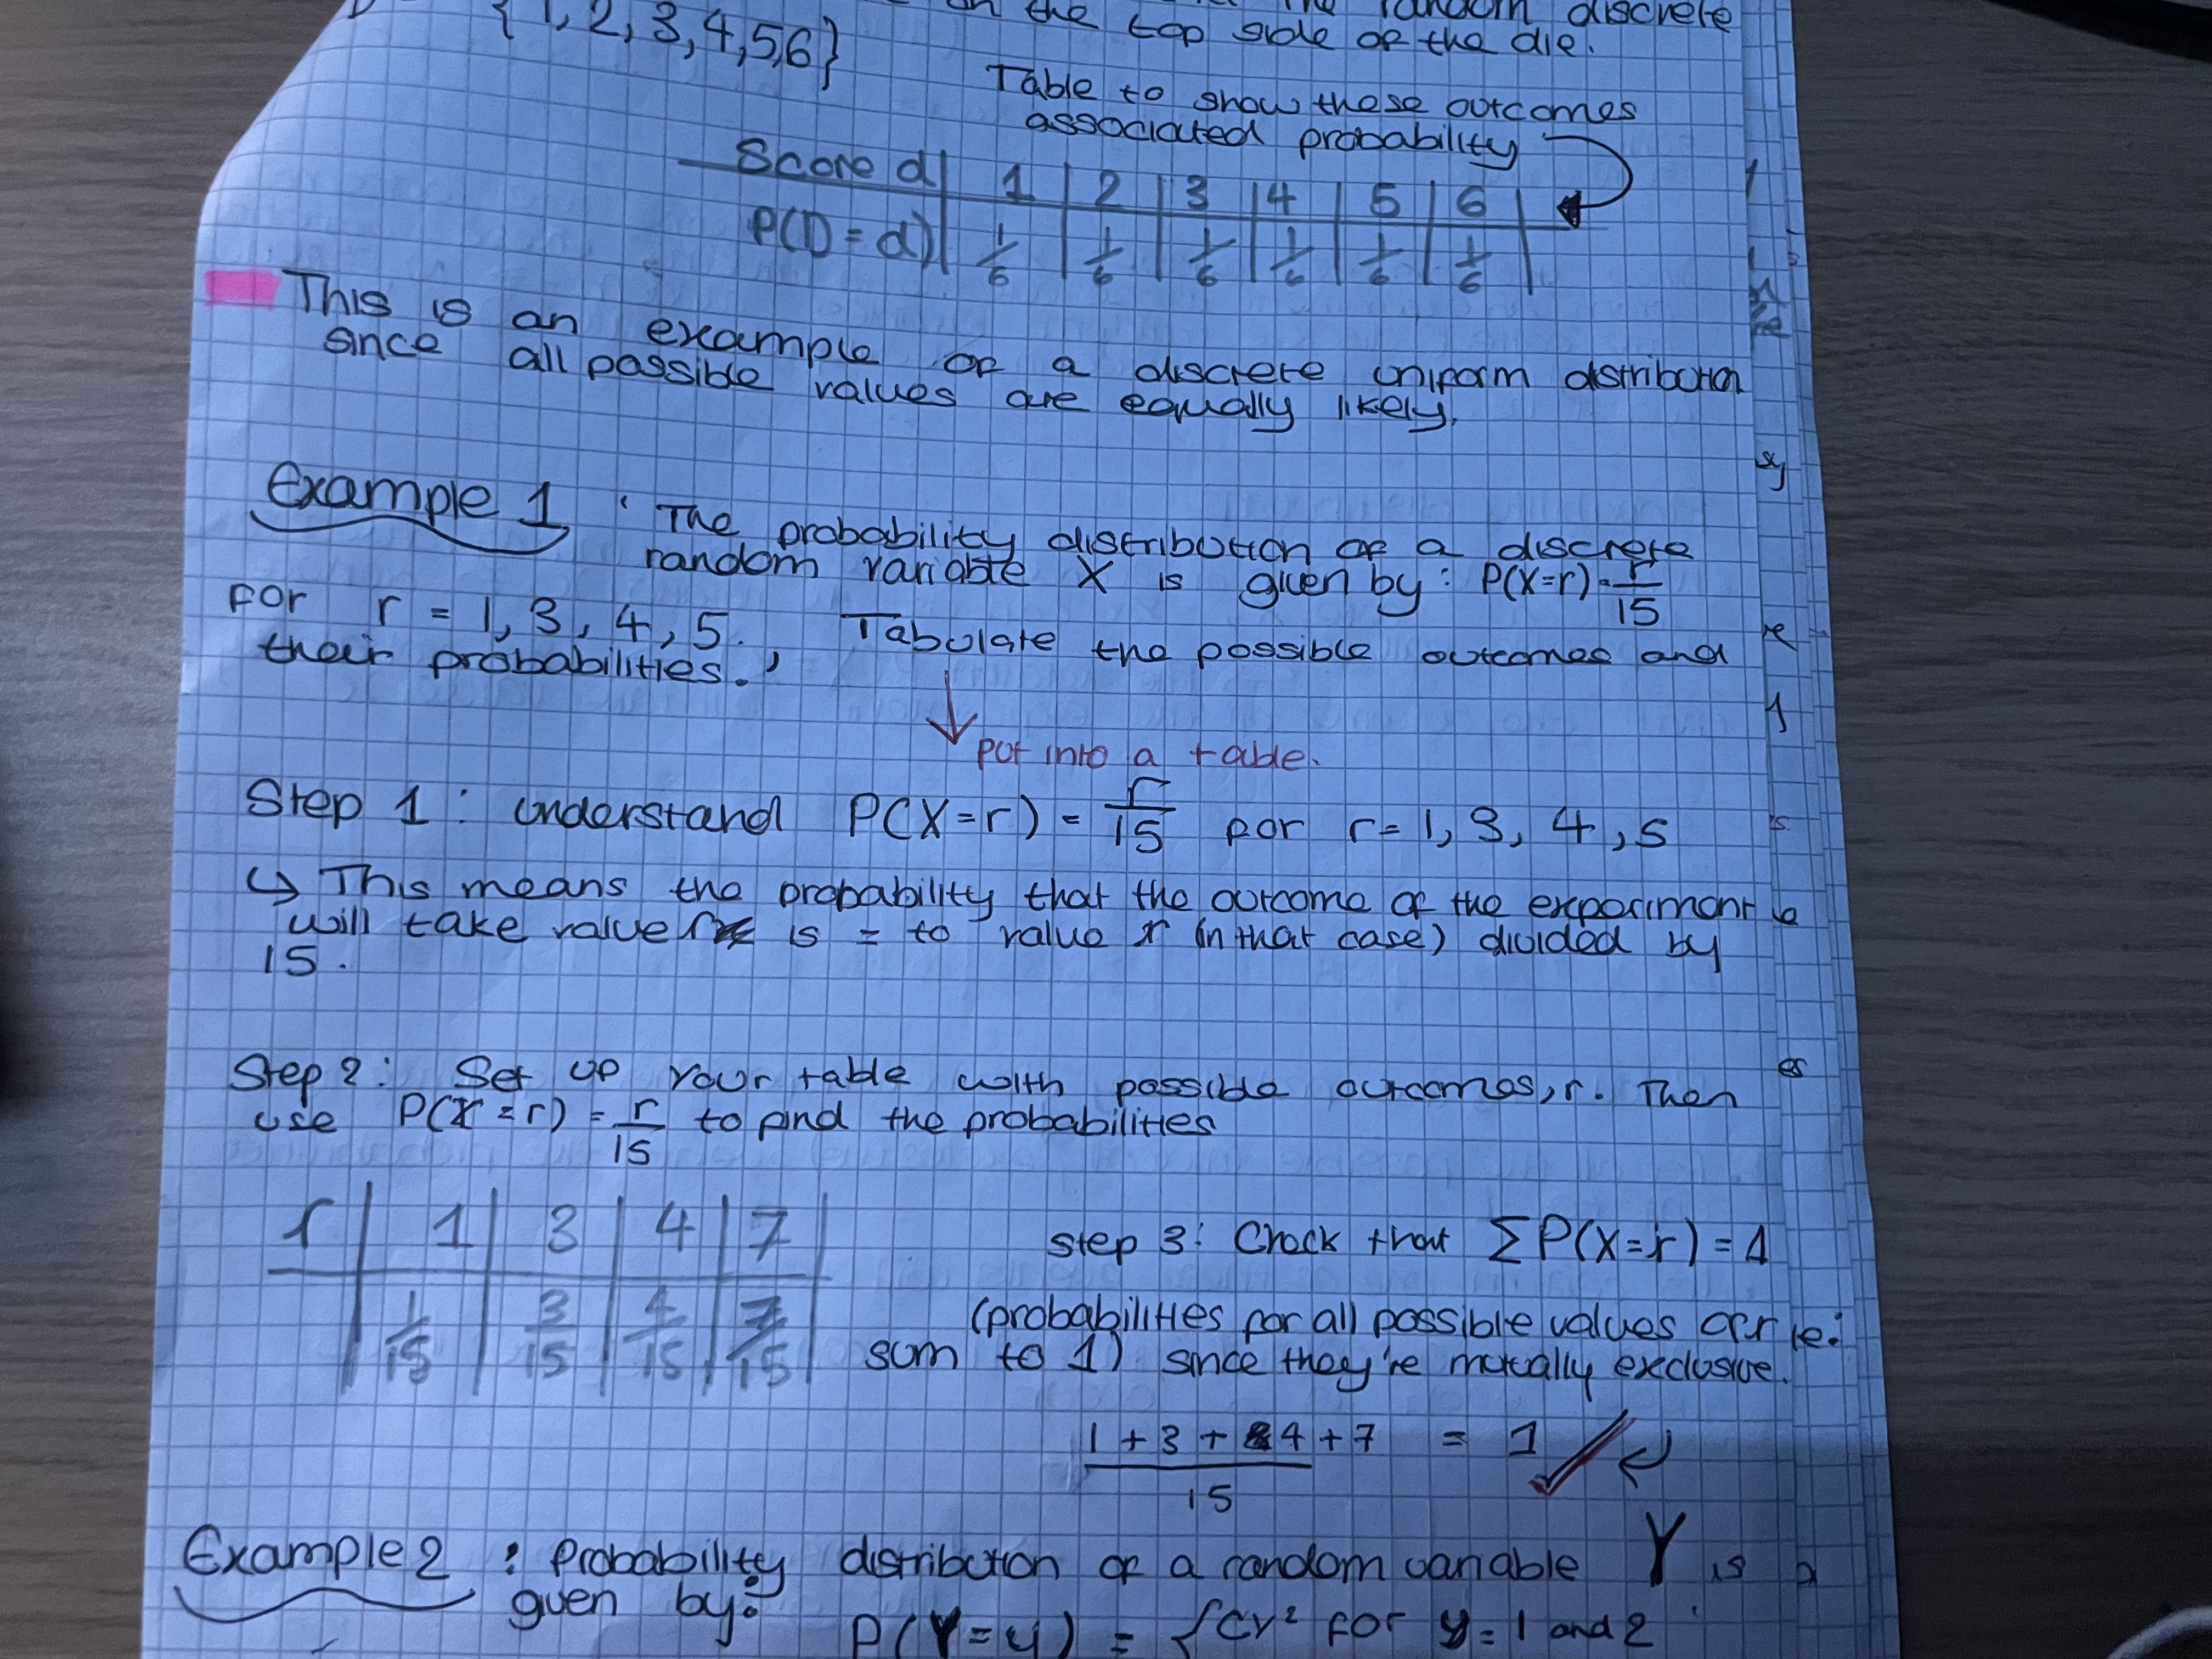
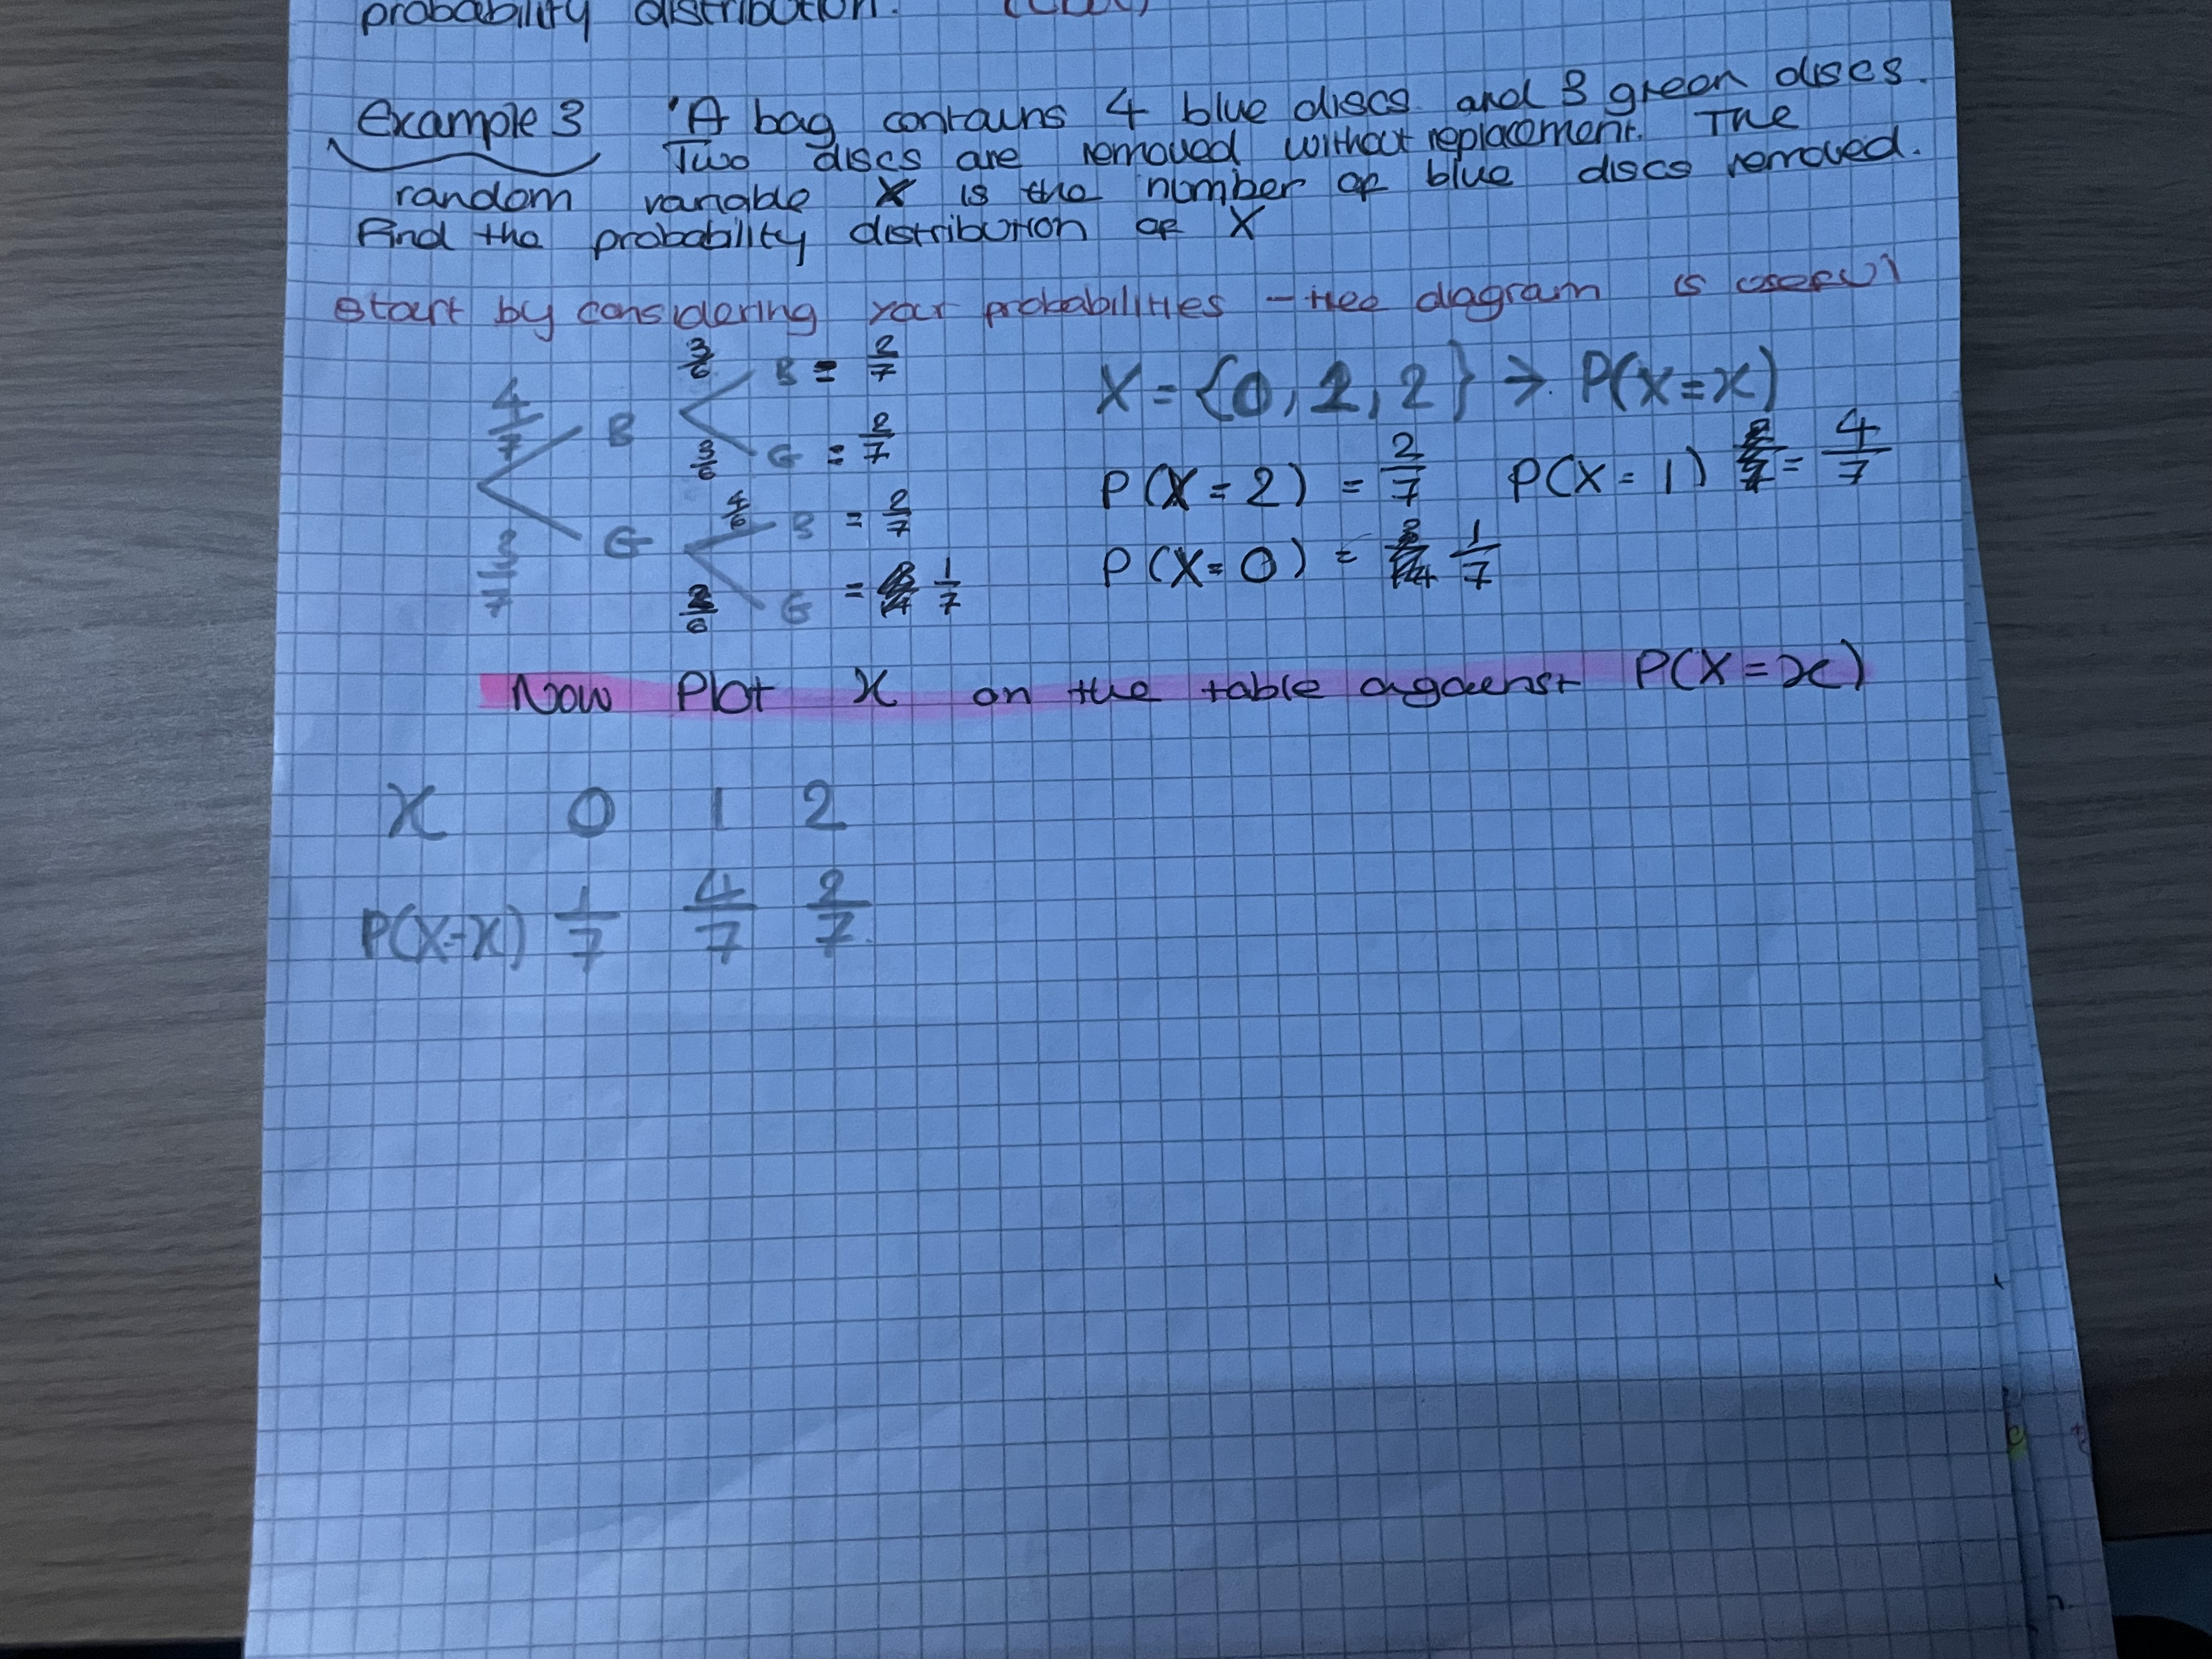
Examples of probability distribution- Questions
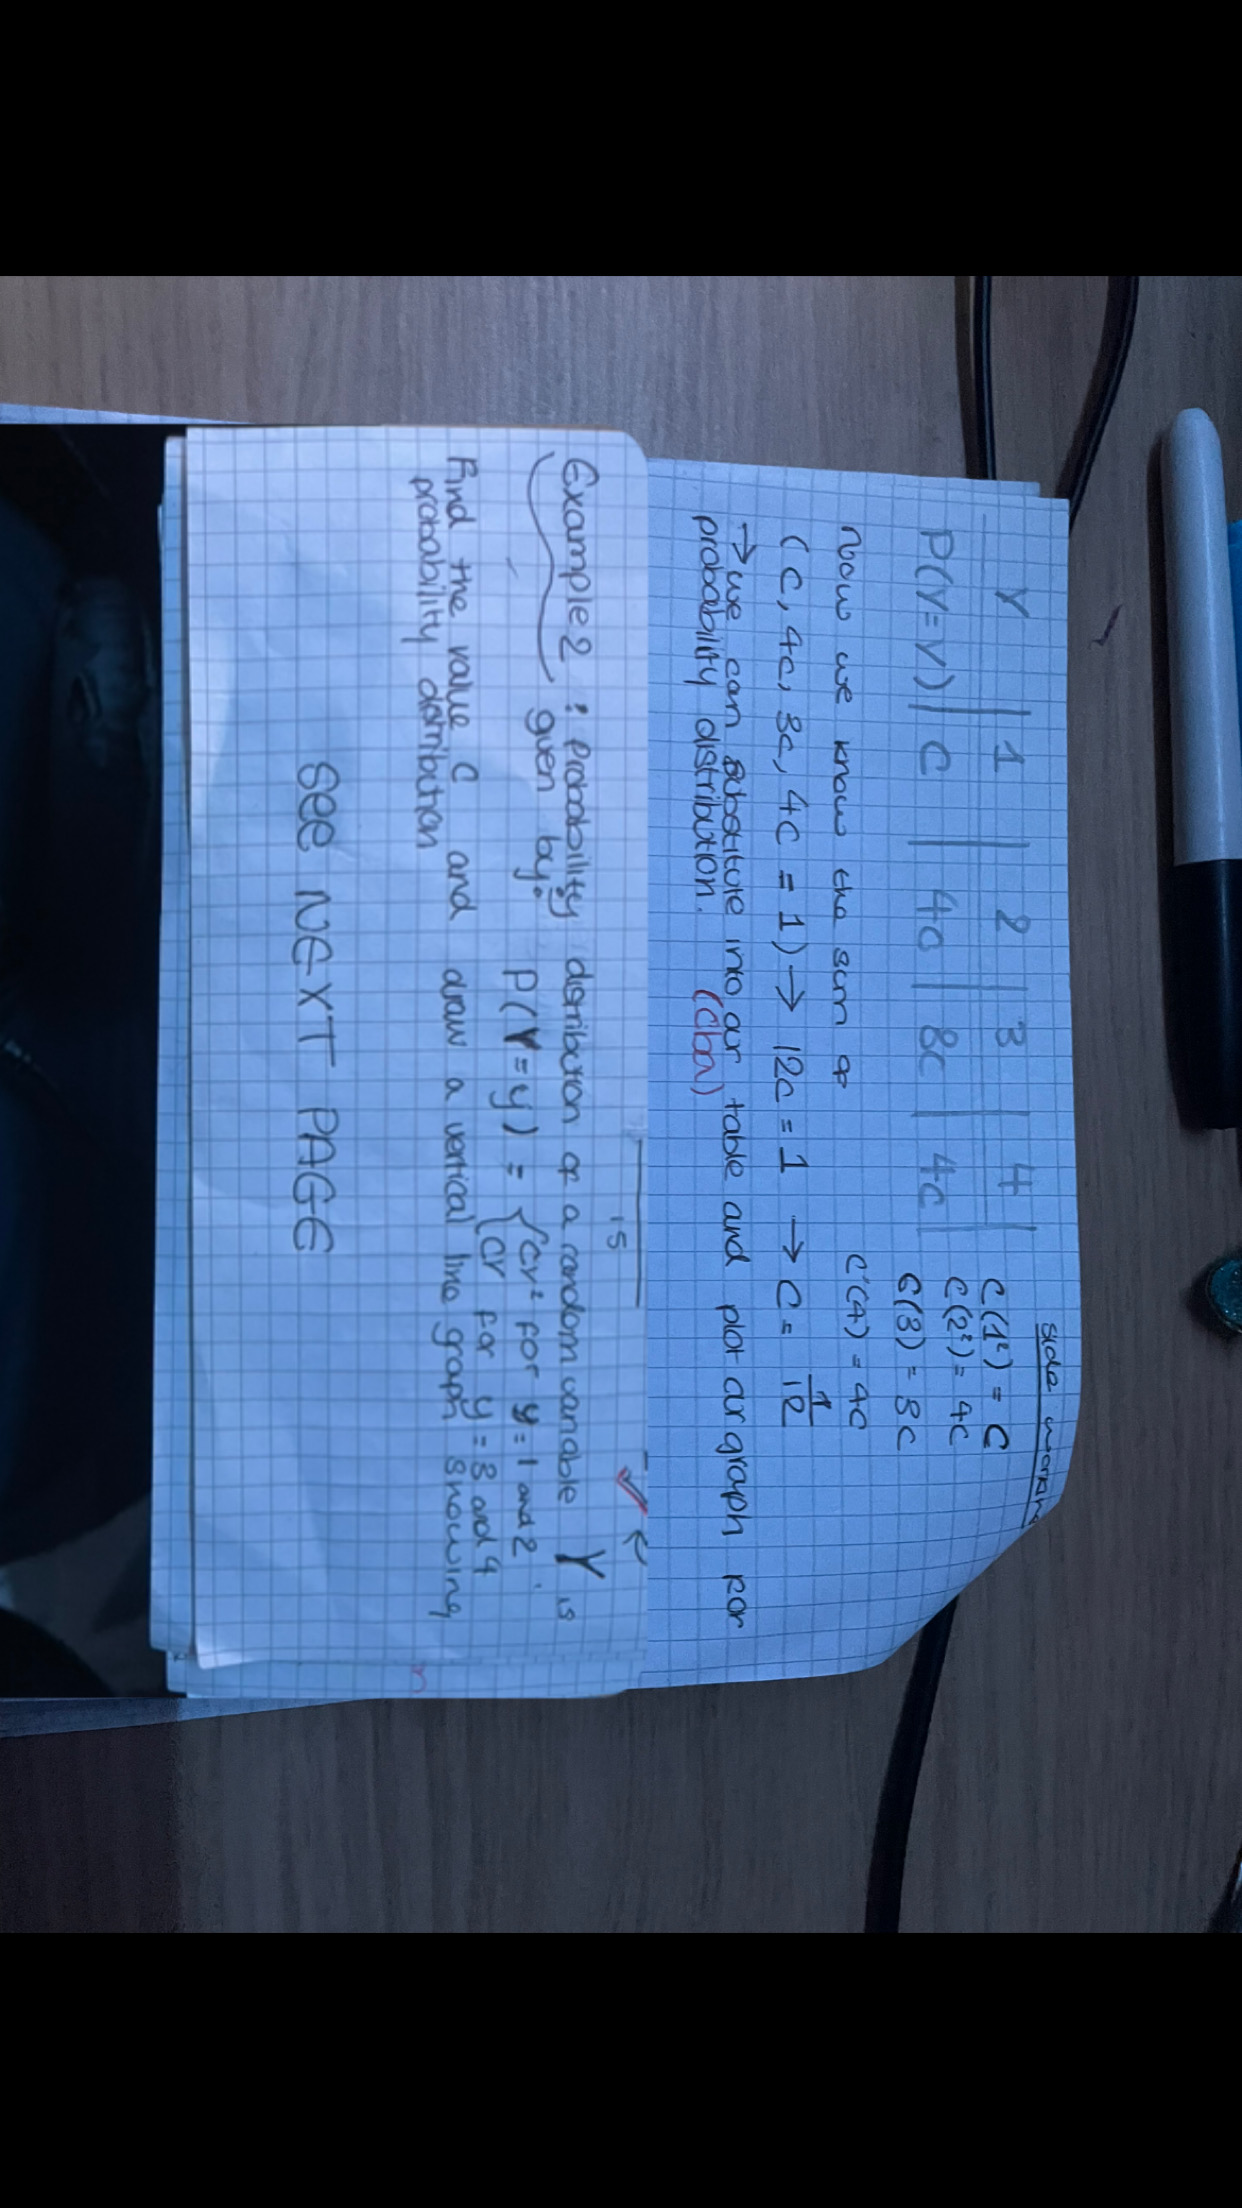
Examples of probability distribution- Questions (2)
Using the derivative to find rates of change
dy/dx = rate of change of y with respect to x
Different letters can replace y and x
. To find velocity at a specific time find ds/dt and sub in the appropriate value for t
. To find acceleration at a specific time find dv/dt sub in appropriate value for t
Finding tangents and normals to a curve
. To find the equation of a tangent to a curve, find dy/dx and sub in the relevant value for x to get the gradient (m)
. Sub in your gradient (m) and values (x1, y1) into the equation (y-y1) = m (x-x1)
. Simplify to find your equation in the form y = mx + c
Finding the equation of the normal to a curve
. Find the gradient of the tangent at the relevant point
. The gradient is of the normal will be the negative reciprocal of this value
. Substitute the relevant point into (y - y1 ) = m (x - x1)
. Simplify to find your equation in the form y = mx + c
A function is increasing/decreasing when…
. Increasing when dy/dx > 0 or d²y/dx² < 0
. Decreasing when dy/dx < 0 or d²y/dx² > 0
A function is stationary/at a turning point when…
. dy/dx = 0
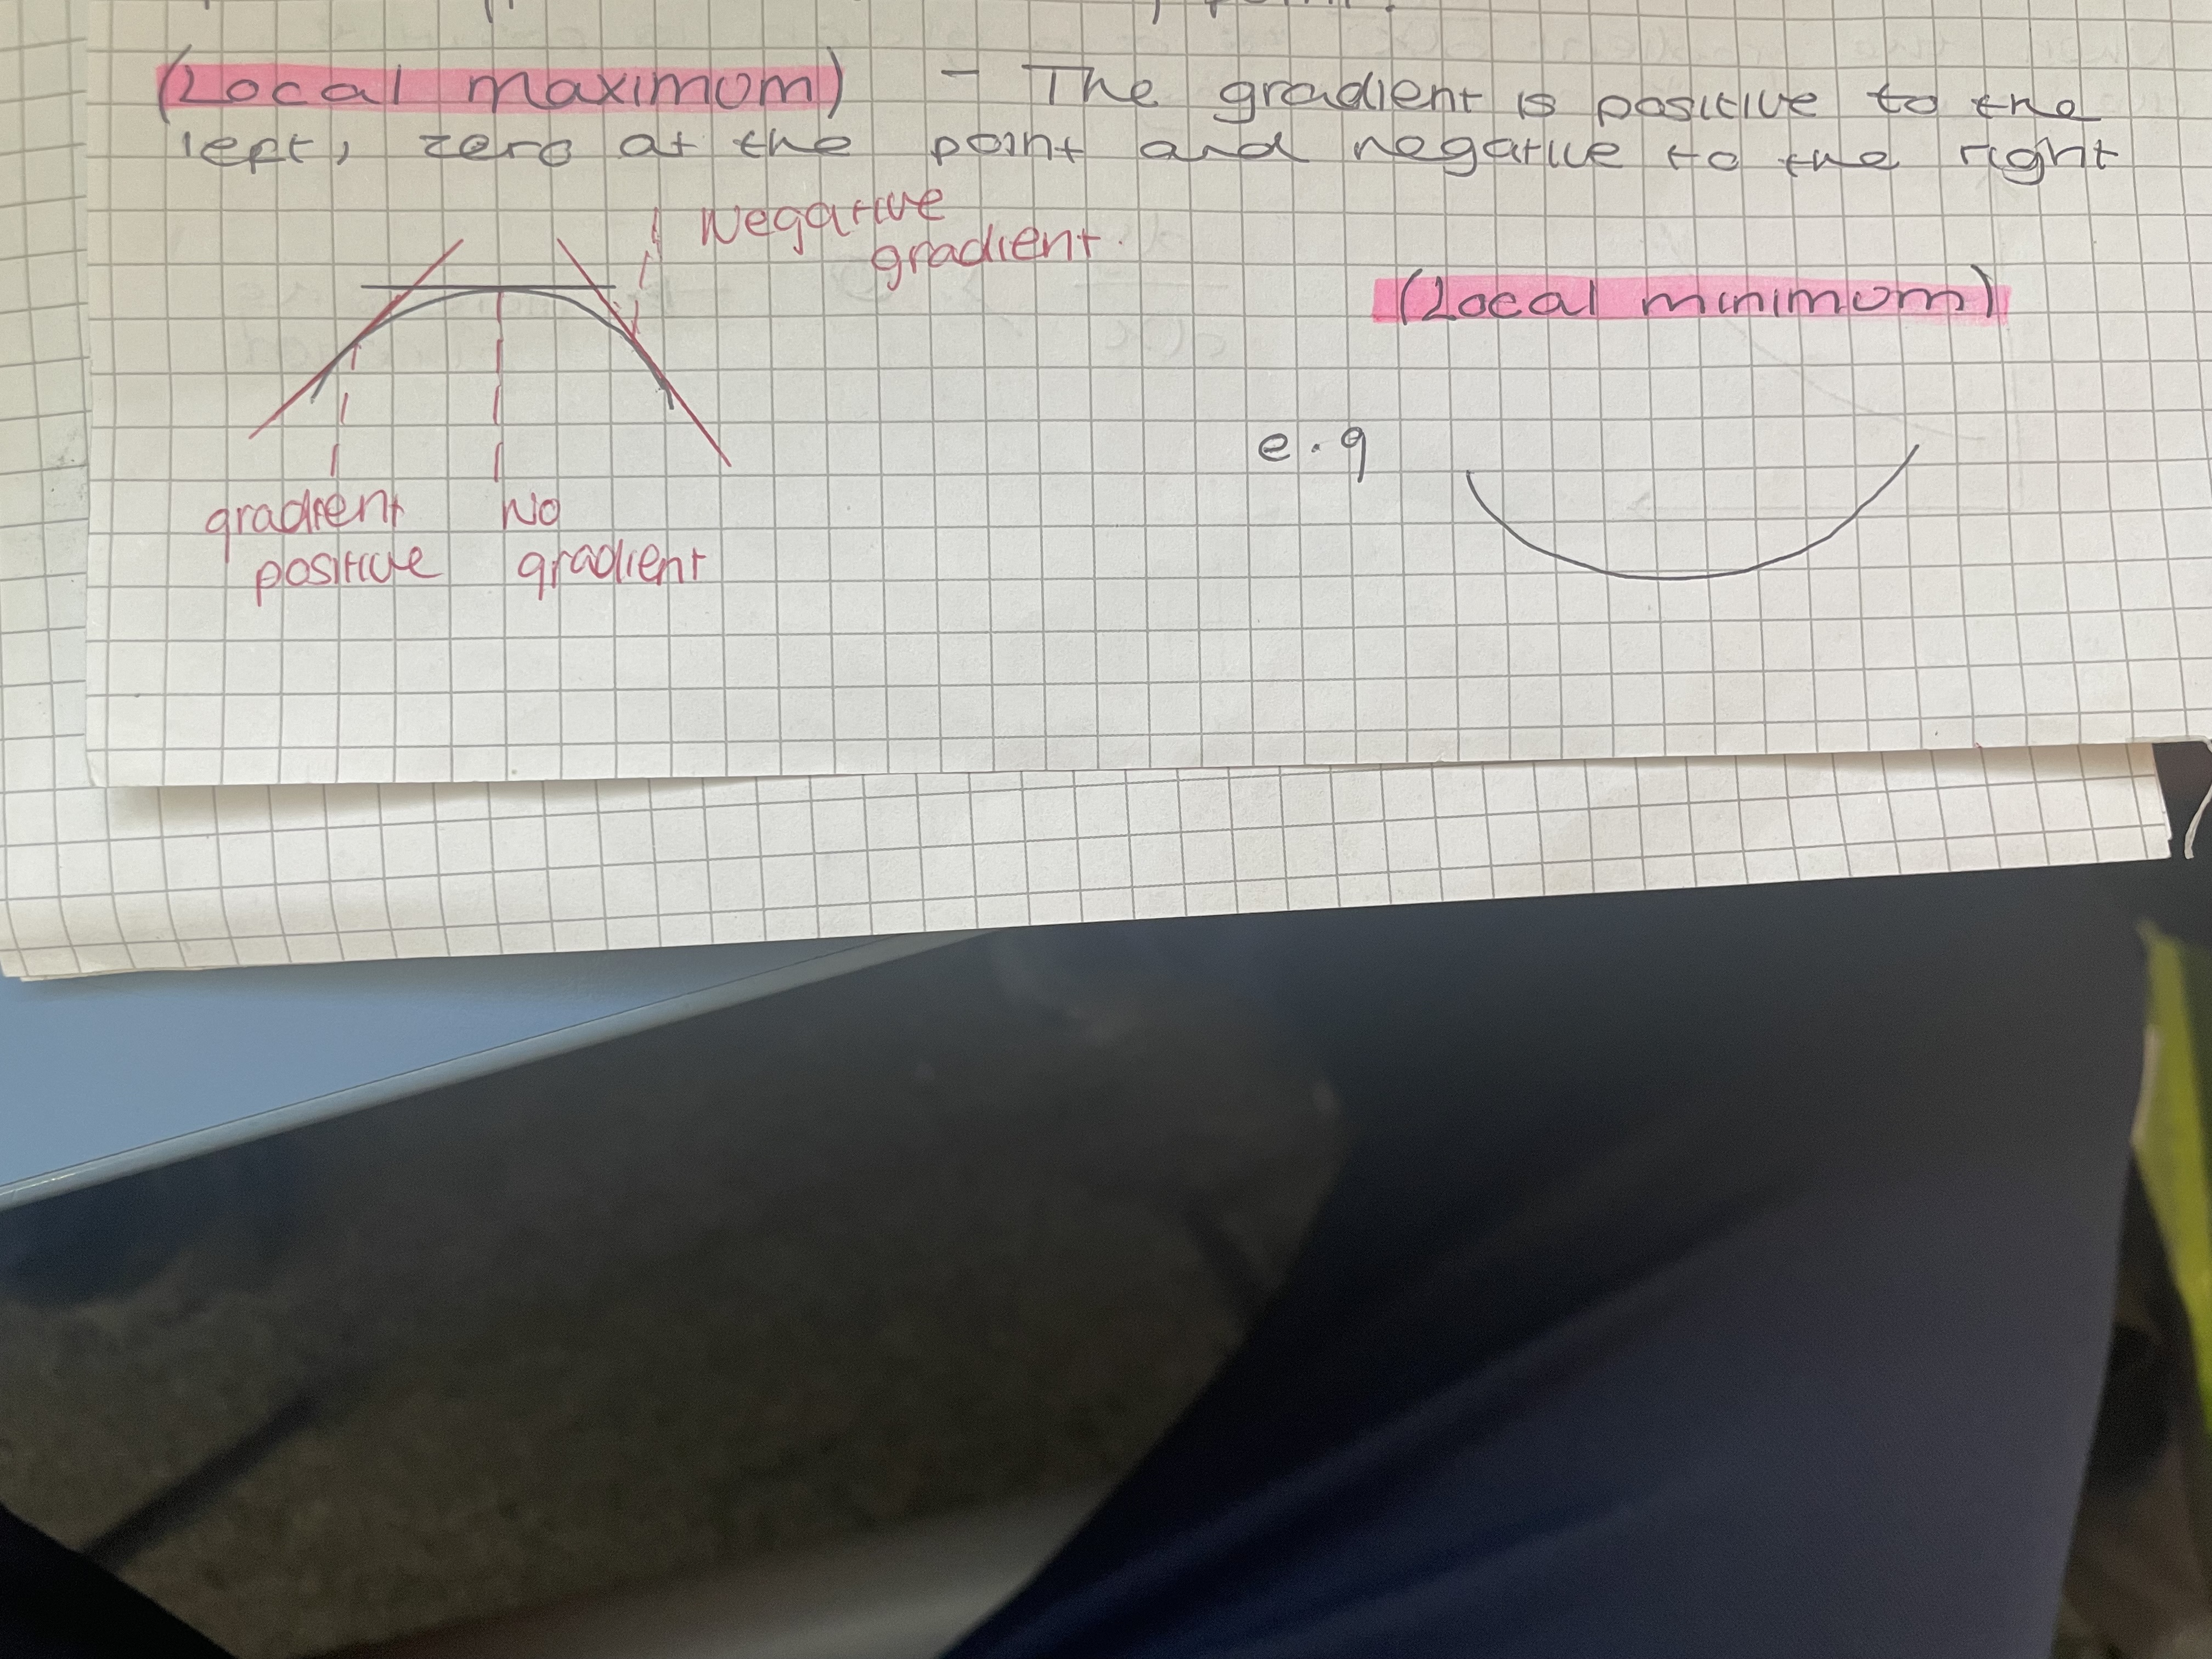
Finding local minimums/maximums
. Therefore when sketching a graph we can locate y and x intercepts, any other points we know (can find one by inserting random values into equation) and stationary points…And then connect them accordingly to work out wether our stationary points are minimums or maximums
. We can also test the value of the gradient (worked out from derivative) either side of the stationary point to see wether it is a local maximum or minimum…. See photo
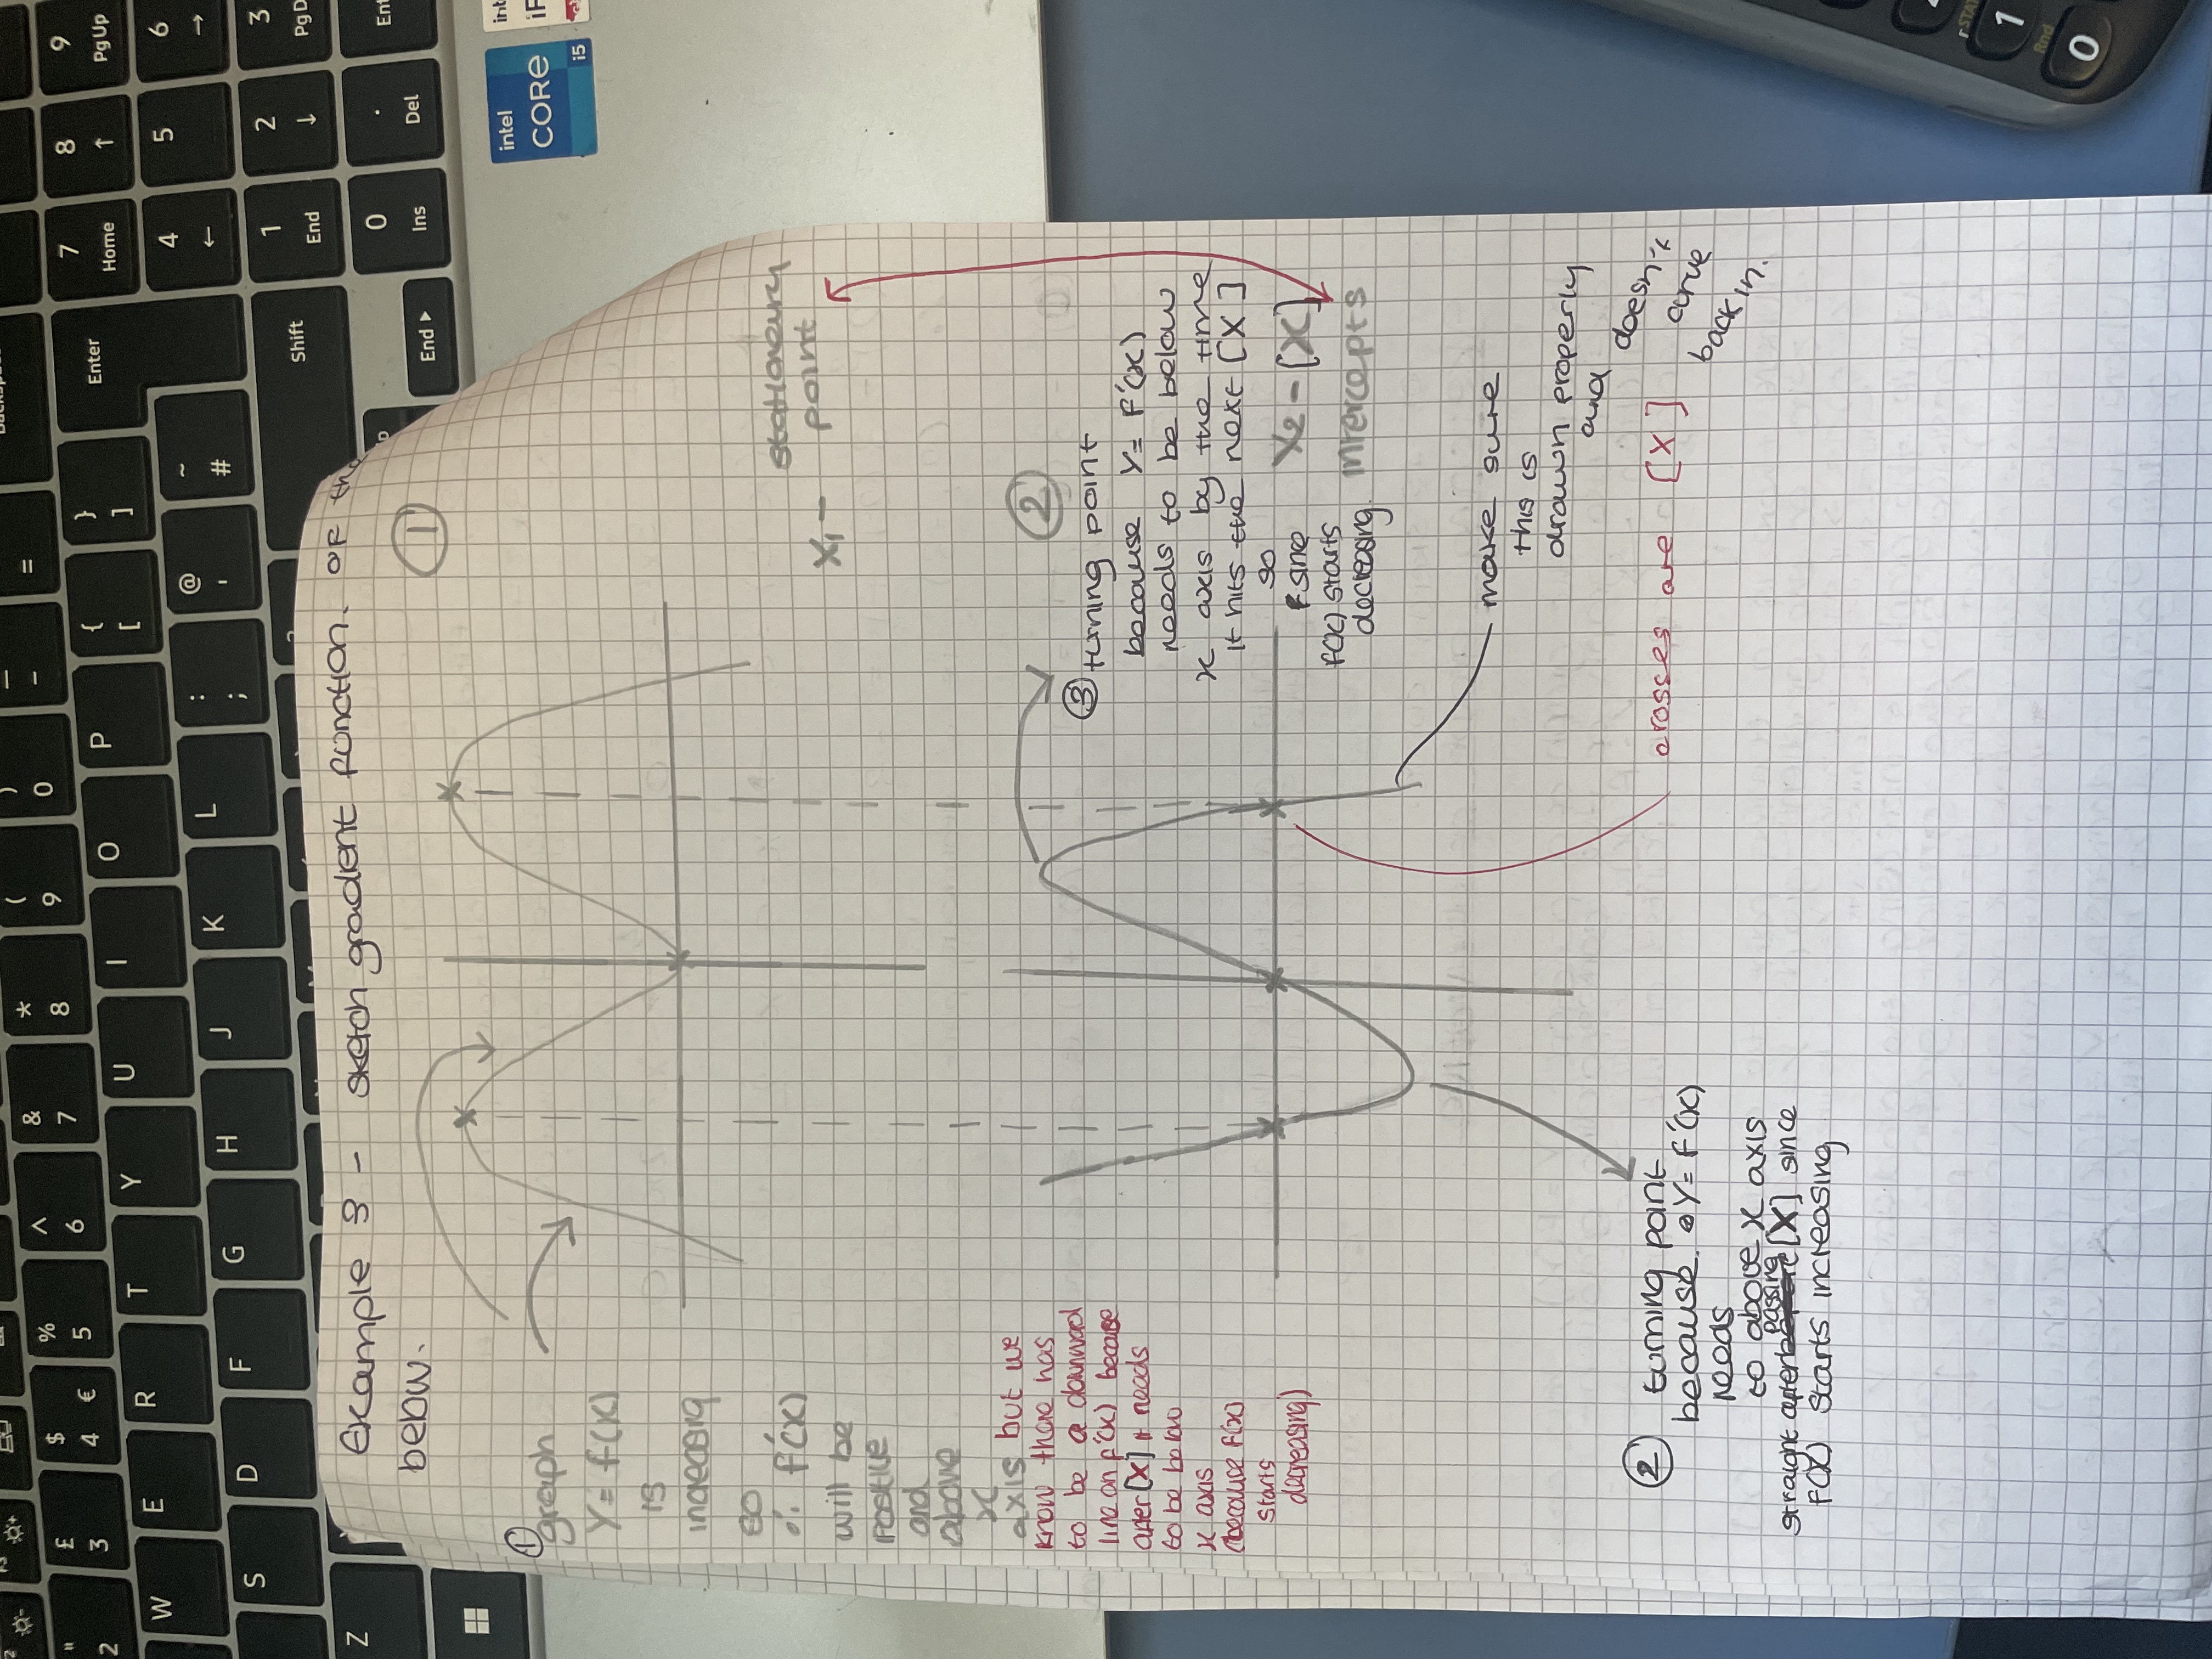
Sketching the graph of a derivative
. Where there is a turning point the gradient of y = f(x) = 0 so dy/dx will also be set to = 0 therefore f ‘(x) will cross the x axis
. When the graph f(x) is increasing the gradient of y = f(x) is above 0 so dy/dx will also be set to > 0 therefore f ‘(x) will cross the x axis and go above it
. When the graph f(x) is decreasing the gradient of y = f(x) is below 0 so dy/dx will also be set to < 0 therefore f ‘(x) will be below the x axis
. Sketch the derivative by observing these facts (see photo)
Differentiation from first principles equation explained
. See photo and understand that then read the rest (notice the green “h” comes from (x+h - x)
. Therefore our gradient of the function will = (change in y)/(change in x) = [f(x+h) - f(x)] / [ x+h - h] as h approaches 0
. This simplifies to f'(x) = lim h (arrow) 0 [f(x+h) - f(x)] / h
. Lim h (arrow) 0 means as h tends to 0
![<p><strong>. See photo and understand that then read the rest (notice the green “h” comes from (x+h - x)</strong></p><p>. Therefore our gradient of the function will = (change in y)/(change in x) = [f(x+h) - f(x)] / [ x+h - h] <strong> as h approaches 0</strong></p><p>. This simplifies to f'(x) = lim h (arrow) 0 [f(x+h) - f(x)] / h </p><p>. Lim h (arrow) 0 <strong>means as h tends to 0</strong></p>](https://knowt-user-attachments.s3.amazonaws.com/a3835d28-d820-4e29-8e96-6d4542281c2f.png)
Solving first principles
If f(x) = value “a” then you would substitute a into the equation where necessary.
. Then sub in the value of h as 0 (if h is the dominator and you’re dividing by 0, get rid of the denominator then sub in 0)
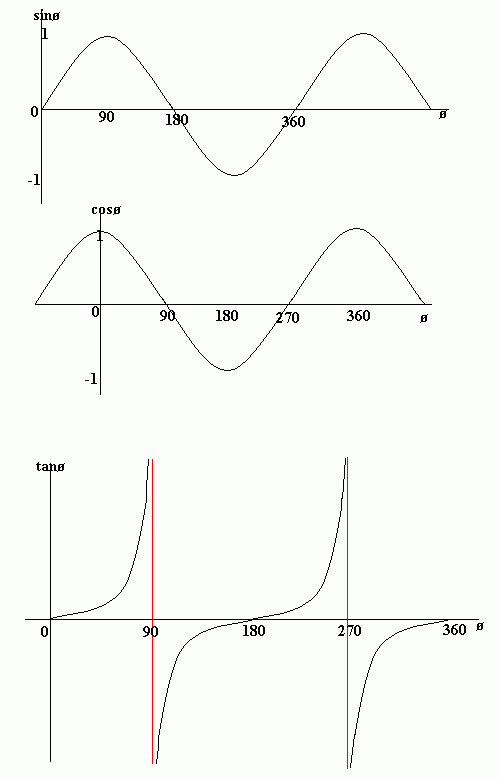
Sketch graphs for sin, cos and tan
Period and rotational symmetry of sin graph in degrees and radians…
. The sin graph as a period of 360o (2π)(curve repeats every 360o/2π)
. The curve has a rotational symmetry about the origin meaning sin(15) = - sin(-15)
Period and rotational symmetry of cos graph in degrees and radians…
. The cos graph as a period of 360o (2π)(curve repeats every 360o/2π)
. The curve has a rotational symmetry in the y axis meaning cos(60) = cos(-60)
. Basically just the sin graph shifted 90o
Period and rotational symmetry of tan graph in degrees and radians…
. The tan graph as a period of 180o (π)(curve repeats every 180o/π)
. The curve has a rotational symmetry about the origin meaning tan(45) = -tan(-45)
. Doesn’t stay between 1 and -1, goes to infinity cuz asymptote
. Asymptotes occur at ±90o and ±270o
Second application of Cast diagram
. C = only Cos is positive
. A = all postive
. S,T…
. You can find sin(θ) = x and then find equivalent values for other trigonometric functions based on the quadrant of θ, then CAST is used to tell you whether x would be positive or negative in that quadrant.
NcR =
NcR = n! / r!(n-r)!
Given that we have “n” items and we are choosing R of them what is the number of combinations/ways to choose them.
. In terms of binomial expansion n is the coefficient of xr in (x+y)n. and r is the number of items chosen from the total.
How to use NcR
. Row in Pascals triangle which = our indicie (x+y)n and then r gives how far across in the row/ the number of the term were on for working out the coefficient
When are sampling methods used?
When a census cant be taken (whole population)
The bigger the sample the more representative it is.
What is simple random sampling?
random selection from population to use as a sample
What is stratified sampling?
If the population has clear subgroups it is possible to take a sample that proportionally represents each subgroup.
. Number in subgroup/population X sample size = number from each subgroup to be randomly selected as part of sample
Quota sampling?
Taking a sample from a a population’s subgroups (doesn’t have to be proportional or random)