Aggregate supply
1/13
There's no tags or description
Looks like no tags are added yet.
Name | Mastery | Learn | Test | Matching | Spaced | Call with Kai |
|---|
No analytics yet
Send a link to your students to track their progress
14 Terms
What is Aggregate Supply?
The total amount that producers in a whole economy are willing and able to supply at a given price level in a given time
Aggregate Supply Graph
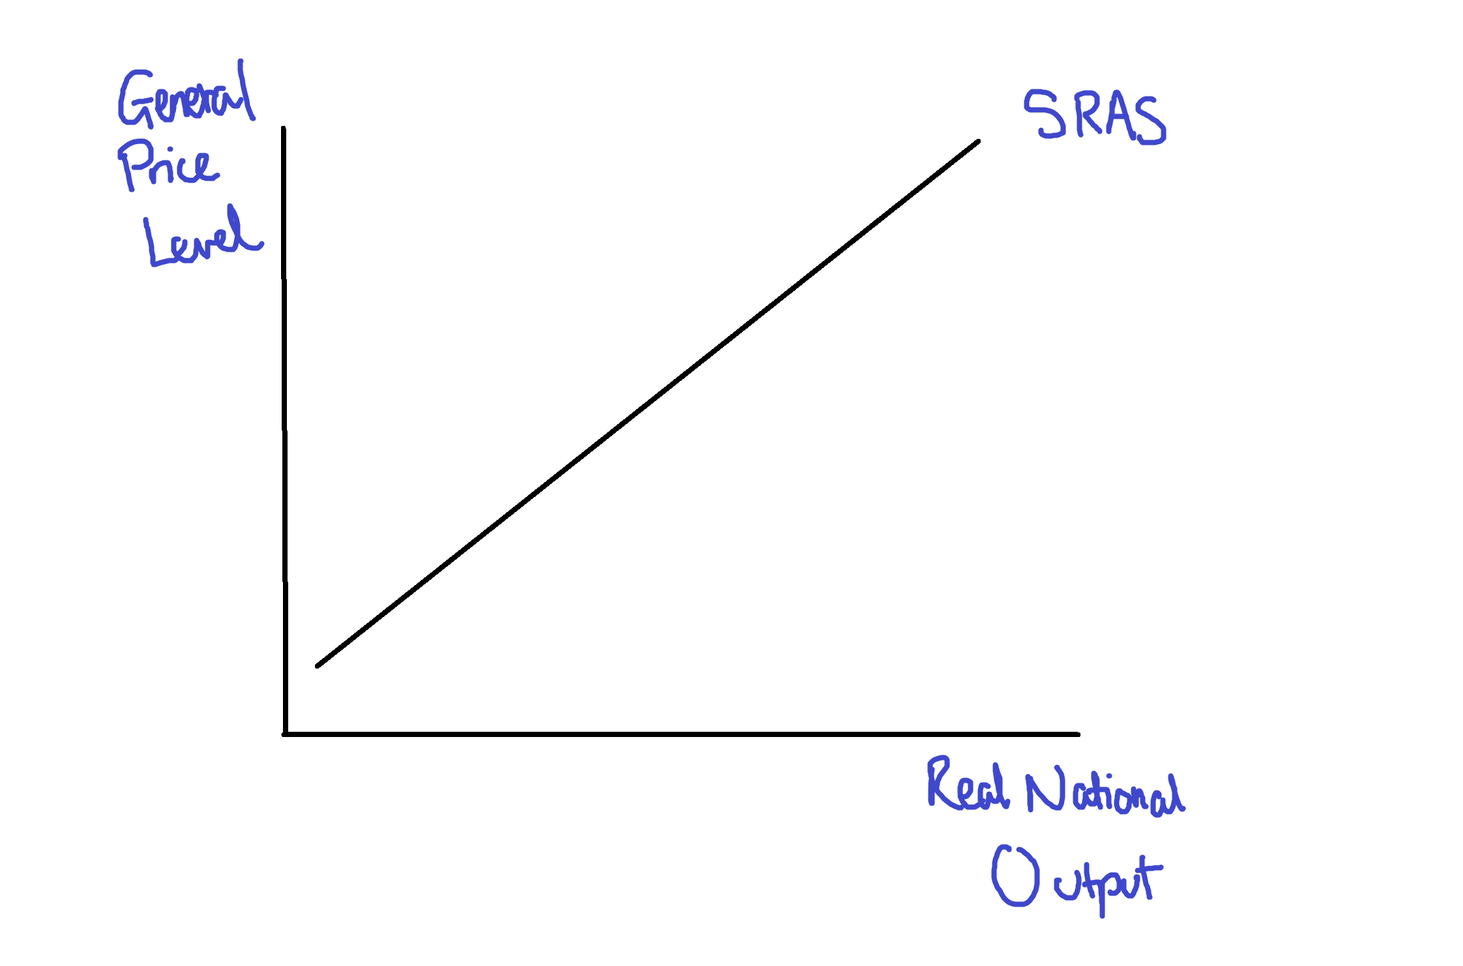
Impacts of Price Level
Higher prices will encourage businesses to employ more workers, increase output and purchase more supplies
AS in Short Term
The relationship between planned national output and the general price level.
AS in Long Term
The relationship between potential national output and the general price level
LRAS Graph
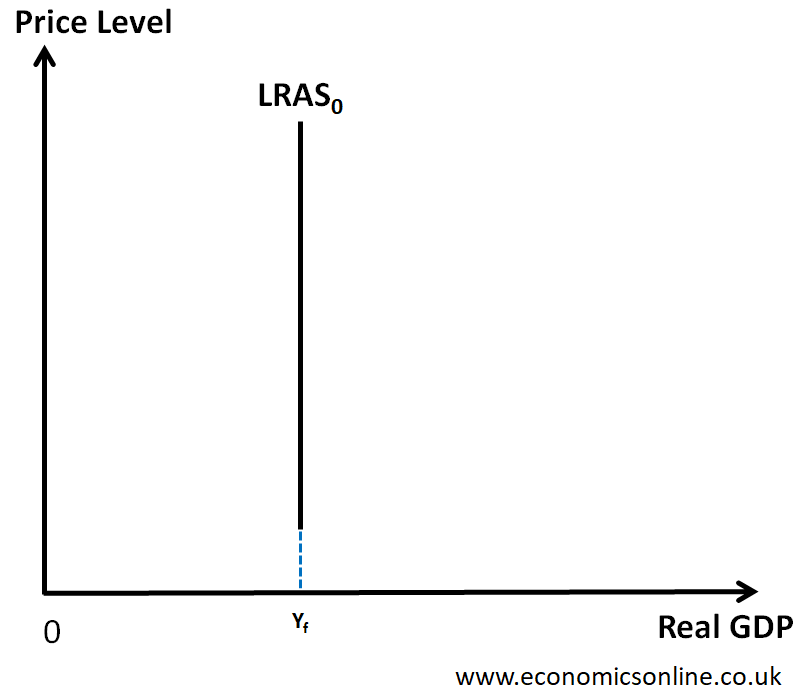
Why is LRAS this shape
LRAS depends on available resources: capital, enterprise and technological developments. Not related to Price Level.
Equilibrium output
When AS and AD curves are put together it shows the AS/AD equilibrium in the economy. Any shifts have impact on real GDP
Causes of shifts in Aggregate supply
Wages of workers to produce output
Price of raw materials
Energy Costs
Tax
Supply Shocks
Keynesian LRAS Graph
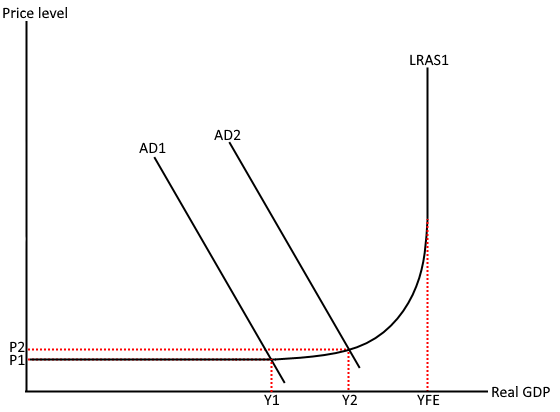
Keynesian Range (Spare capacity)
Increase Demand & Employment to increase Output & GDP, no impact on price level
Intermediate Range (Approaching full capacity)
There is a trade-off where there can be more output however there is also higher prices. Must accept inflation for growth
Classical Range (full capacity)
LRAS curve becomes vertical as price level has no impact on total output.
How can the LRAS curve be moved outwards
Increase productivity
Invest in education
Invest in tech
Increase govt spending on capital goods