MIS Exam 2
1/62
There's no tags or description
Looks like no tags are added yet.
Name | Mastery | Learn | Test | Matching | Spaced | Call with Kai |
|---|
No analytics yet
Send a link to your students to track their progress
63 Terms
Central Limit Theorem
Bigger the samples, more normal and narrower distribution
Law of Large Numbers
As number of trials increase, actual value moves toward expected value
As sample size increases, observed stat will move toward actual (true) parameter
Confidence Intervals
A range of values, derived from sample data, that likely contains the true, unknown population parameter
Less about knowing and more about sensing
Confidence interval formula
Sample mean + Z score (s/quare root of n)
Degree of freedom formula
n-1
When would we use T Distribution
When n<30 and we don’t know sigma
When should we use z distribution
n is 30 or greater and know sigma
If DF > CL then
there is more uncertainty with smaller samples
Why do we need to make compromises when dealing with samples
As we increase confidence, the confidence widens
As we increase or decrease n, confidence interval lengthens
There’s natural tension between formulas
6 steps of Hypothesis Testing
1 - determine which of 4 facets of null correlate with problem
2 - Find alpha (usually given)
3- Calculate Test Stat
4 - Determine Current Value
5 - Make your test decision
If |TS| > |CV|
Reject the Null
If |TS|<|CV|
FTR null
(T/F) Failing to reject null does not mean its true
True
Type I Error
Reject true null (a)
Type II Error
FTR false null b
4 Facets of Null
1) status quo (normal state of events)
2) everything is unrelated
3) no difference between groups
4) everything arises from chance
Why can’t we subtract 1 - a to find b (beta)
Beta is part of a theoretical dataset that we don’t know - it’s actually a curve
Z test assumptions for sample 1 test
1) null is true
2) random sampling
3) central limit theorem is satisfied
4) interval ratio data
TS Formula
(Observed value - expected value)/ chance aka standard error of mean
What sign is used for Left tailed test
<
What sign is used for R tail test
>
What sign is used for 2 tailed test
not equal sign
SEM formula
s/ sqr root n
Why should we not put an = sign for all nulls?
Violates rule for being collectively exhausted (but since we’re aware we’ll put an = sign to make it easier)
Why is a (aka CV or “line of bs”) on such a low part of graph?
truly shows the reason for rejecting null
T Test sample instruction
1) null = true
2) random sampling
3) central limit theorem is satisfied
4) interval ratio data
What does the left side of the 2×2 matrix
No new action will be taken
What does the right side of the 2×2 matrix
New action will be taken
What are the rules of SED (Standard Error of Difference)
1) assume there are 2 population variances are not equal —> Non Pooled equation
2) If you know population is equal —> equal
3) n1 is close to n2 and s1=s2—> pooled
Degrees of Freedom formula
n1 + n2 - 2
When might there be dependent samples
1) 2 samples are paired or matched on related criteria (same shopper different store)
2) 1 sample is repeated measurement (before and after weightloss challenge)
P Value
Probability of attaining a value equal to or greater than the test stat. Given the test assumptions are true and a sound test structure
In a hypothesis test, if p-value < alpha we should....
Reject the null
What is\are the primary difference(s) between a one-tailed and two-tailed test?
one-tailed tests are used when there is reason to believe the results will fall either above or below the mean, while a two-tailed test are used when there is reason to believe the results could fall either above or below the mean.
one-tailed tests place all of alpha in either tail, while a two-tailed test tests evenly splits alpha into both tails
1 and 2
What is the key characteristic of a paired-difference test?
the 2 datasets are somehow related
or
the 2 datasets do NOT need to be of the same size
the 2 datasets are somehow related
If we create a 95% confidence interval…
there is no guarantee that the true population mean falls within our CI
we are 95% confident the true population mean falls within our CI
there is no guarantee that the true population mean falls within our CI
Which situation requires a one-tailed hypothesis test?
Group of answer choices
a company tests if a machine fills bottles with exactly 500 ml of shampoo
a researcher wants to know if a new process increases productivity
a manager tests whether two departments have different satisfaction scores
a researcher wants to know if a new process increases productivity
The CLT requires the population to be normally distributed.
Group of answer choices
false
true
False
The paired-difference test can be used for --
A\ 2 samples that have been matched together based on some criteria
B| 1 sample with repeated measures.
C) Both
Which is true?
Both
Which of the following is true regarding the right tail of the distribution:
A\ As the Test Statistic increases, the p-value decreases.
B\ As the Test Statistic increases, the p-value increases
In a right-tailed test:
The p-value is the area to the right of the test statistic.
As the test statistic moves further right (increases), there is less area remaining to the right.
👉 So:
Larger test statistic → smaller p-value
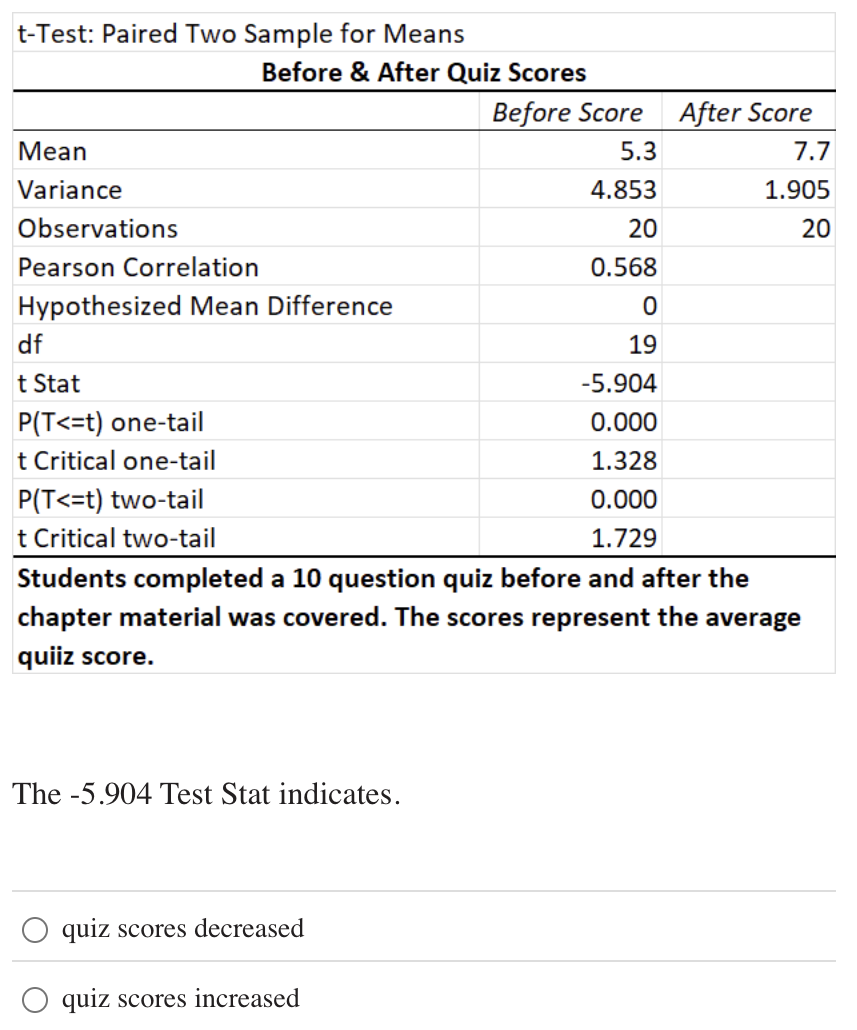
The -5.904 Test Stat indicates.
quiz scores decreased
quiz scores increased
✅ quiz scores increased
Why:
The mean before = 5.3
The mean after = 7.7 → clearly higher
The t-stat = -5.904 is negative because of how the difference was calculated (likely Before − After):
Since After > Before → the difference is negative → t-stat is negative
👉 Negative t-stat here actually reflects an increase in scores.
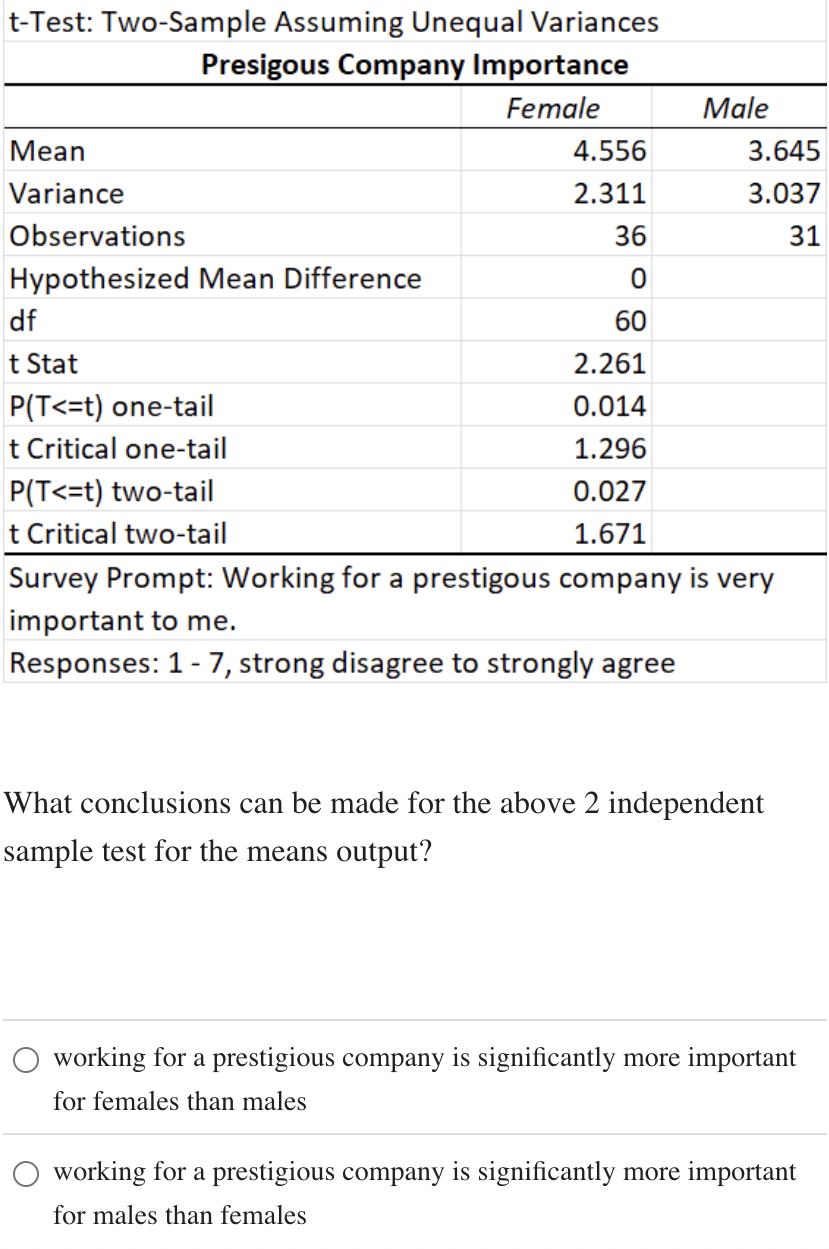
It’s more important for females
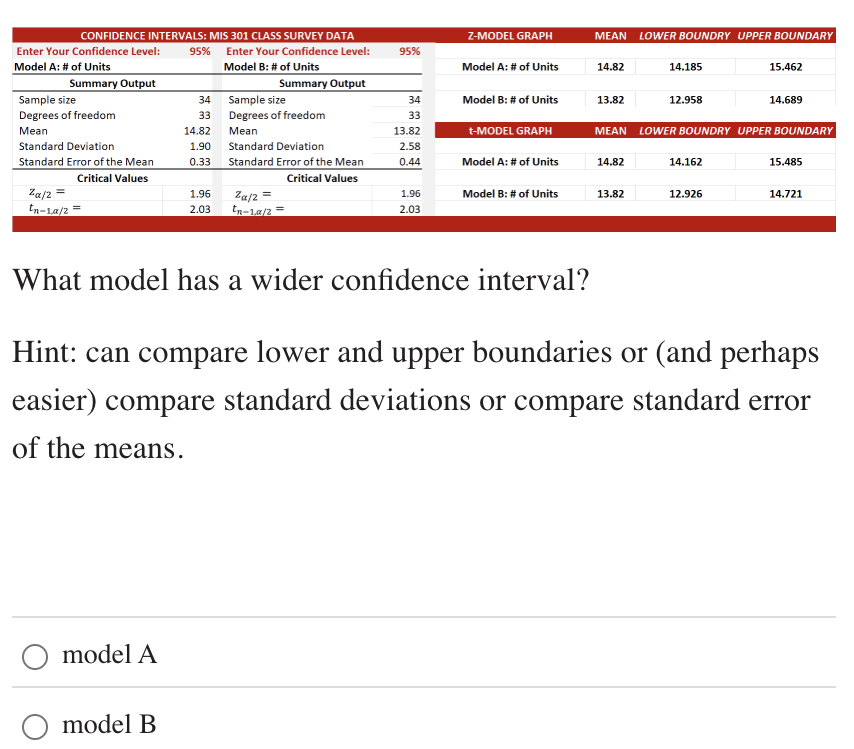
Which model has a wider confidence interval
Model B
A\ The (shape of the) t-distributions accounts for the greater uncertainty we have when working with small populations.
B\ The (shape of the ) t-distribution accounts for the greater uncertainty we have when working with small samples.
Which of the above is true?
Group of answer choices
A
B
B
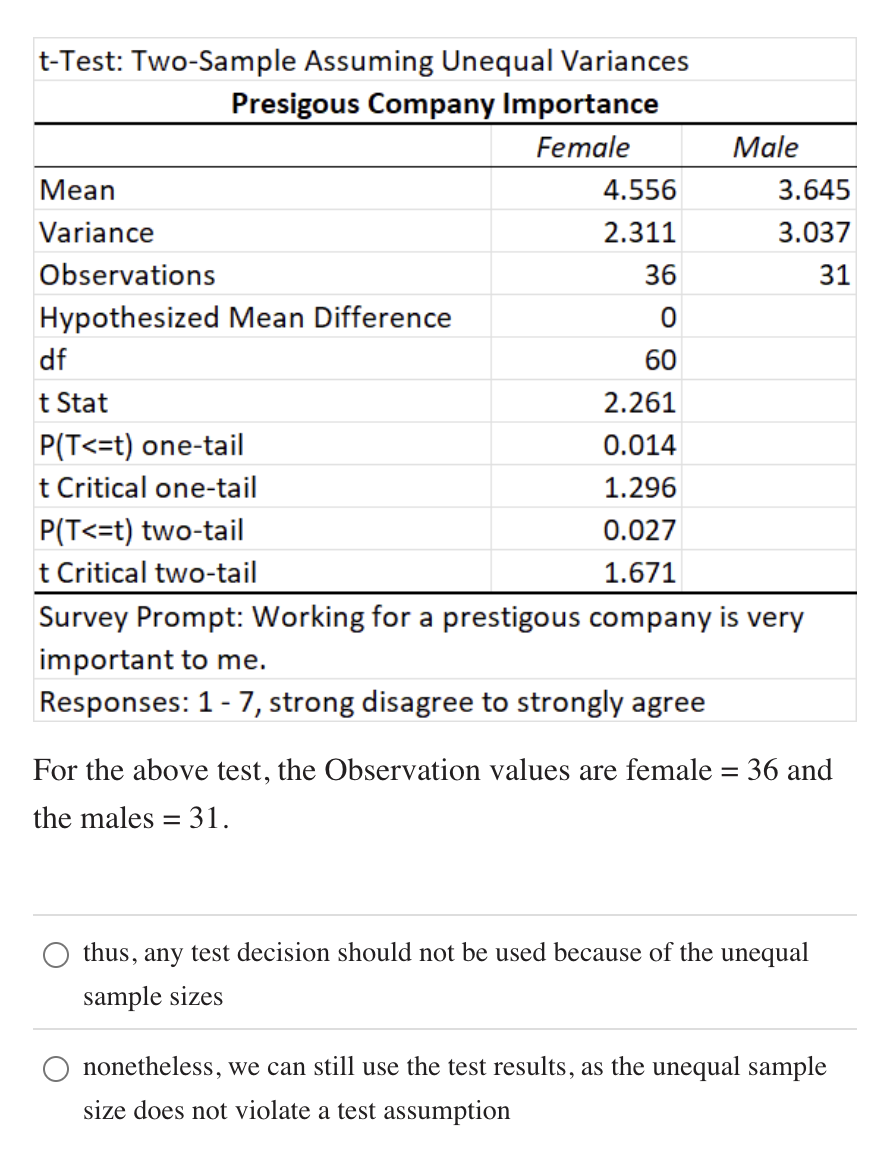
For the above test, the Observation values are female = 36 and the males = 31.
thus, any test decision should not be used because of the unequal sample sizes
nonetheless, we can still use the test results, as the unequal sample size does not violate a test assumption
nonetheless, we can still use the test results, as the unequal sample size does not violate a test assumption
Which of the following is always an assumption of a hypothesis test?
Group of answer choices
the null is true
everything is related
none of the other choices
Null is true
In a hypothesis test, what is a type II error?
failing to reject a null that is really false
failing to reject a null that is really true
failing to reject a null that is really false
In step 3 of a 1 sample t-test -- the larger the Test Statistics the ____________ the difference between the sample mean and the expected value (population mean)
Group of answer choices
larger
smaller
A larger t value means the sample mean is farther away from the expected value.
(larger)
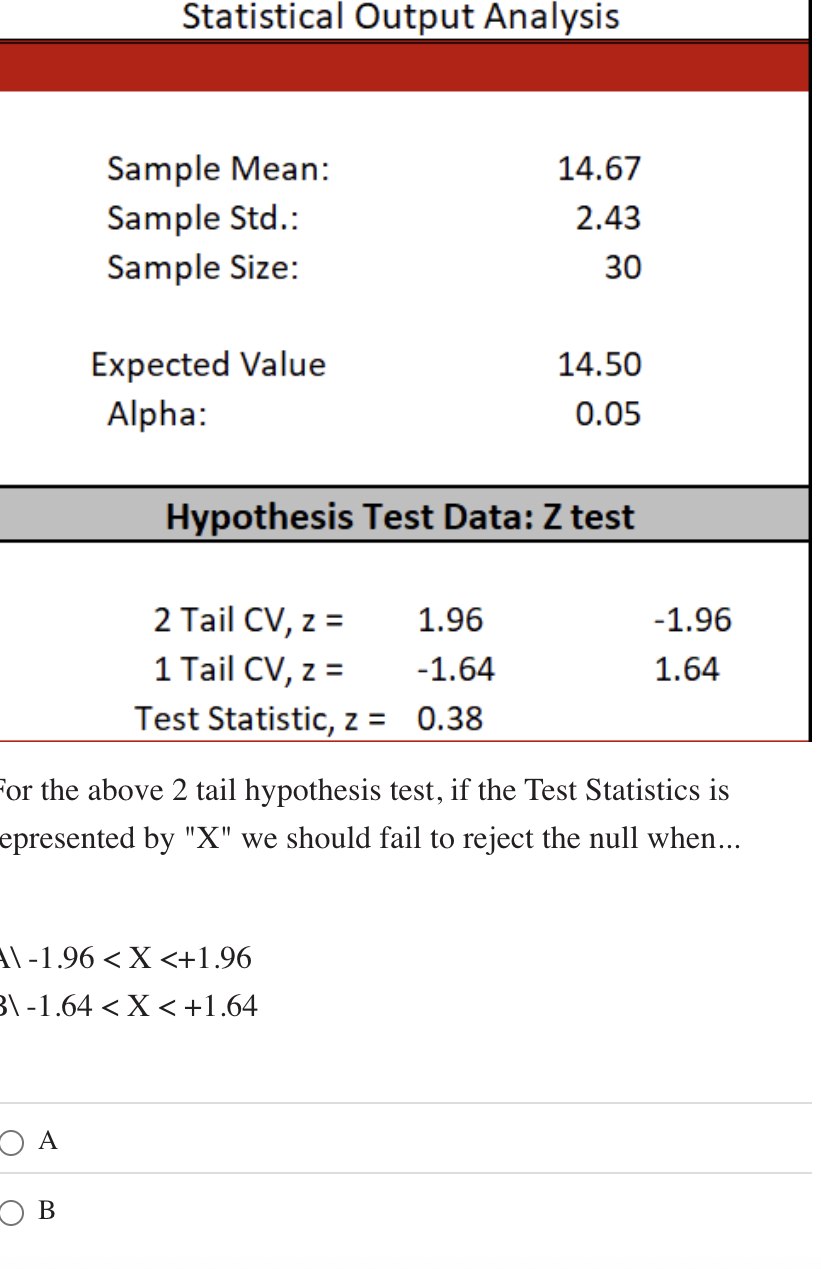
For the above 2 tail hypothesis test, if the Test Statistics is represented by "X" we should fail to reject the null when...
A\ -1.96 < X <+1.96
B\ -1.64 < X < +1.64
A
In a one-sample Z-test for the means, the alternative hypothesis can be setup to test...
both tails
either the left or right tail
both of the other choices
both of the other choices
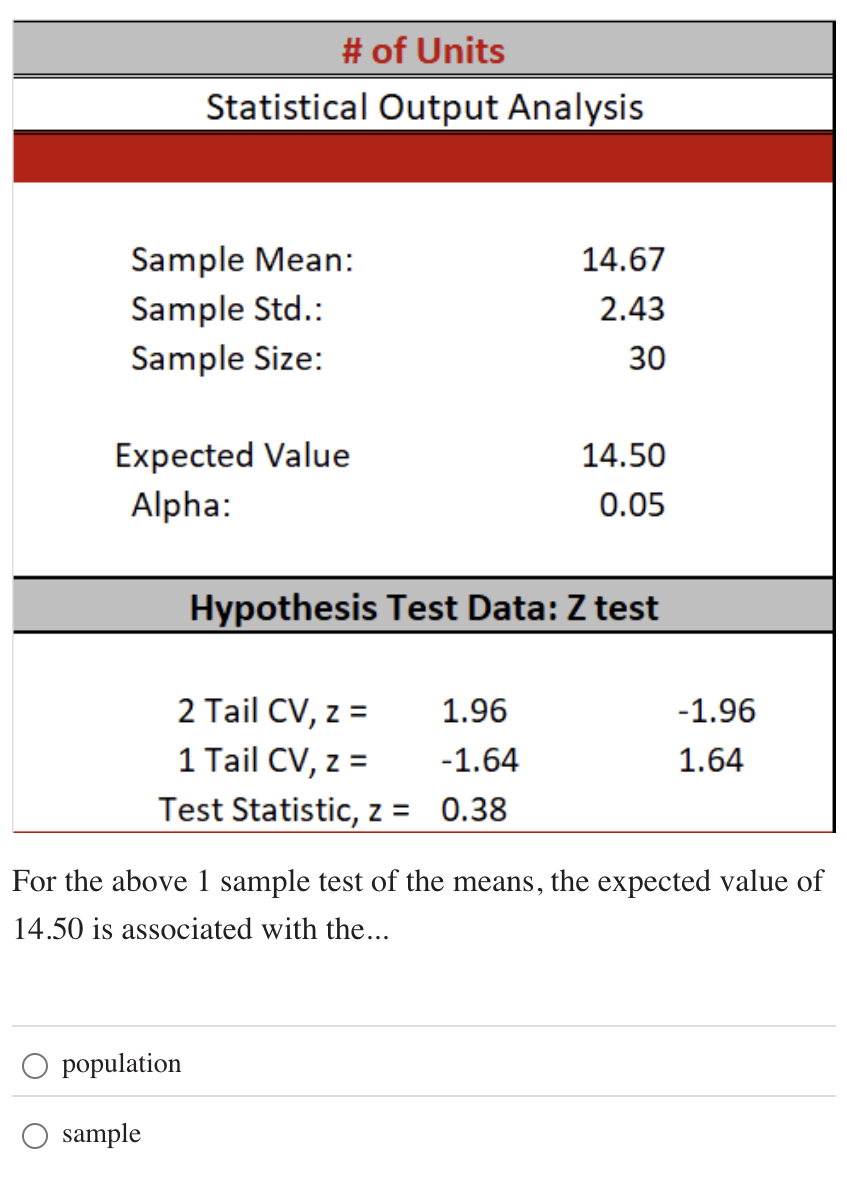
For the above 1 sample test of the means, the expected value of 14.50 is associated with the...
population
sample
population
In a one-sample Z-test for means, we are testing to see if the sample mean is...
equal to the population mean
not equal to the population mean
equal to the population mean
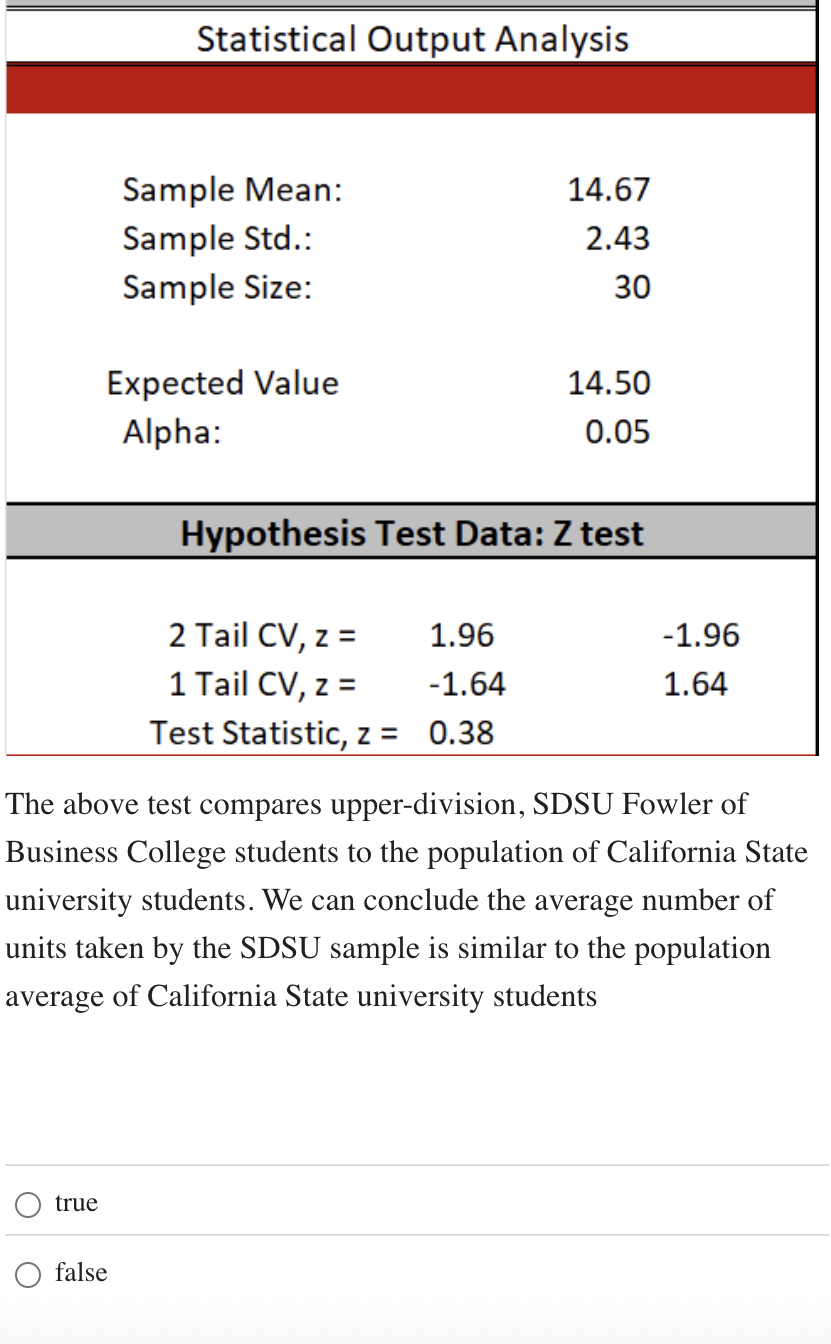
The above test compares upper-division, SDSU Fowler of Business College students to the population of California State university students. We can conclude the average number of units taken by the SDSU sample is similar to the population average of California State university students
Group of answer choices
true
false
true
Why:
Test statistic: z = 0.38
Critical values (two-tailed, α = 0.05): ±1.96
👉 Since 0.38 is between -1.96 and 1.96, we fail to reject the null hypothesis
If n > 30, the CLT states that the sampling distribution of the means will be...
Group of answer choices
normally distributed
skewed left
skewed right
normally distributed
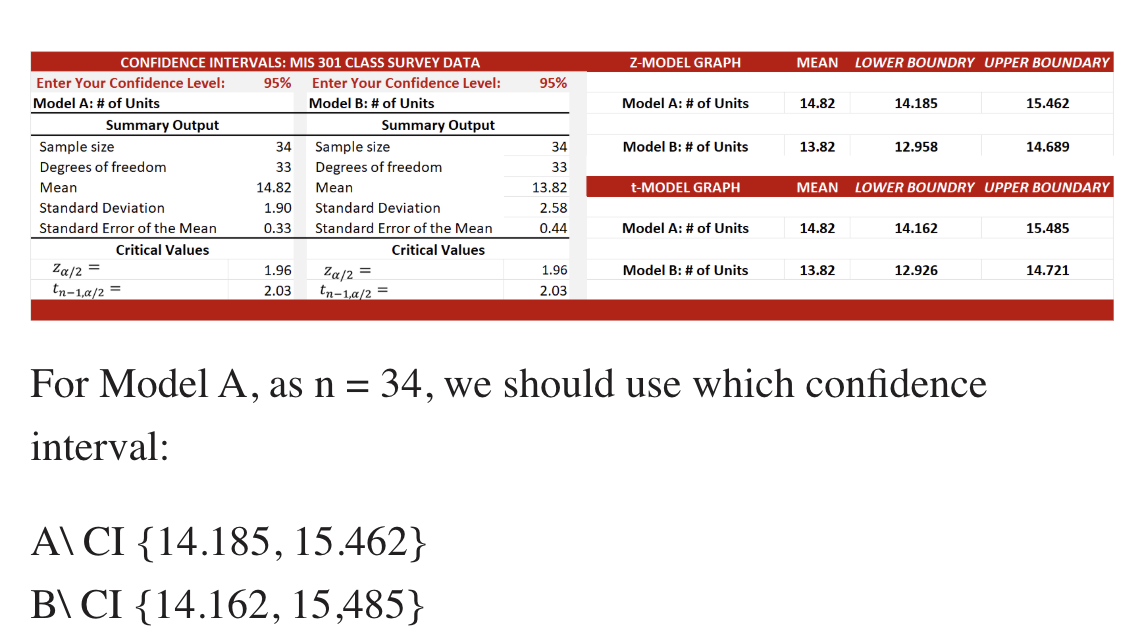
For Model A, as n = 34, we should use which confidence interval:
A\ CI {14.185, 15.462}
B\ CI {14.162, 15,485}
A\ CI {14.185, 15.462}
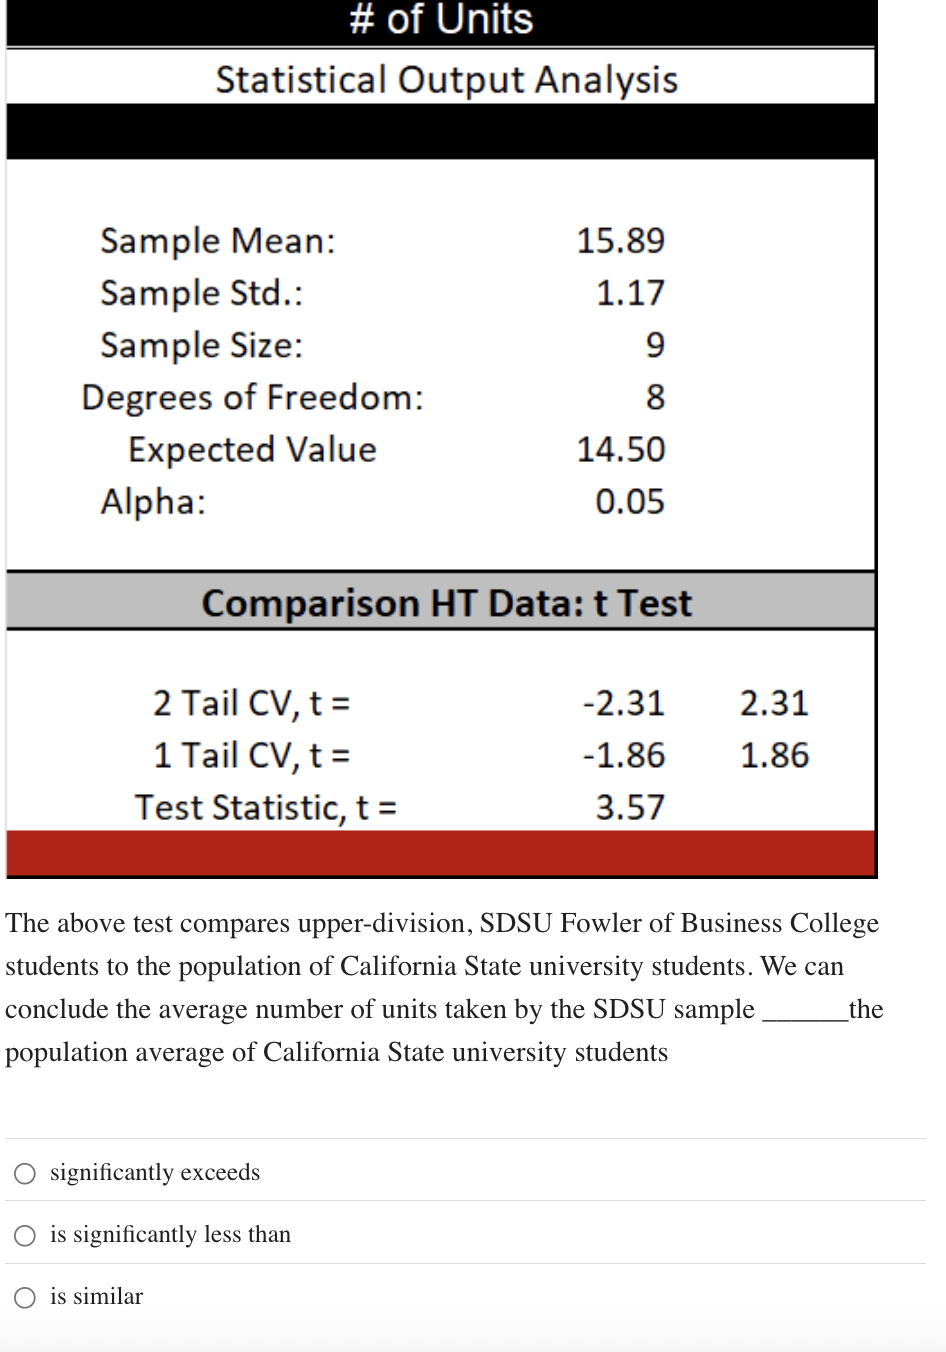
The above test compares upper-division, SDSU Fowler of Business College students to the population of California State university students. We can conclude the average number of units taken by the SDSU sample ______the population average of California State university students
significantly exceeds
is significantly less than
is similar
significantly exceeds
Why:
Sample mean = 15.89
Population mean = 14.50
👉 Sample is higher
Check significance:
Test statistic: t = 3.57
Critical value (two-tailed, α = 0.05, df = 8): ±2.31
👉 Since 3.57 > 2.31, we reject the null
In Step 3 of a 2-independent sample t-test, the T-statistic is the result of what measurement?
Group of answer choices
a comparison of the 2 sample means
a comparison of the 2 population means
a comparison of the 2 sample means
Which hypothesis is used when there is enough evidence to overthrow the status quo?
the null hypothesis
the alternative hypothesis
the alternative hypothesis
The null hypothesis (H₀) represents the status quo
When there is enough evidence to reject H₀, we support the alternative hypothesis (H₁)
In a hypothesis test our critical value is based upon --
1\ alpha, and
2\ the type of test we are doing (ex: Z or t), and
3\ whether we are doing a 1 or 2 tail test.
The above statement is ....
Group of answer choices
true
false
true
In a hypothesis test the p-value is a probability associated with obtaining the..
the Test Statistic
alpha
the Test Statistic
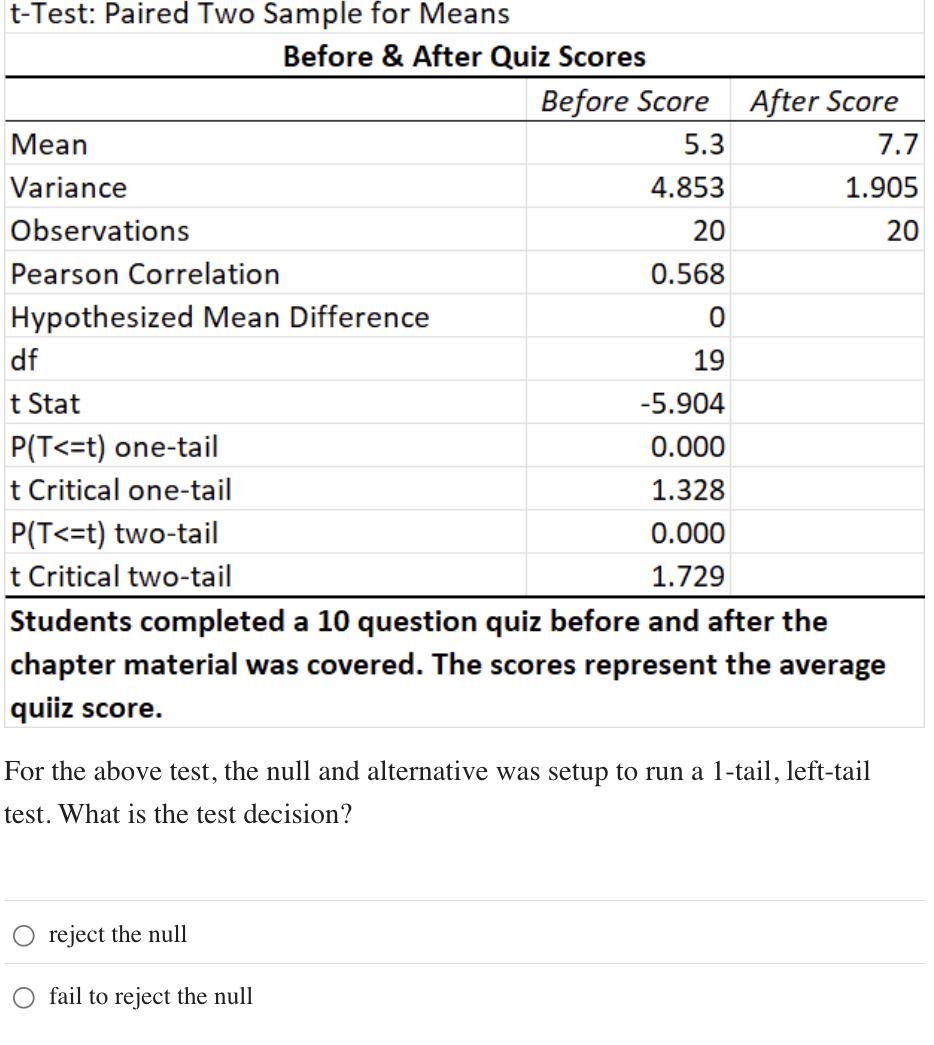
For the above test, the null and alternative was setup to run a 1-tail, left-tail test. What is the test decision?
Group of answer choices
reject the null
fail to reject the null
reject the null
As the sample size increases, the sample mean approaches the ...
Group of answer choices
population mean
the sample size
population mean