ECON 2000 - Exam 3
1/64
Earn XP
Description and Tags
Includes Homework and Practice Exam Questions
Name | Mastery | Learn | Test | Matching | Spaced |
|---|
No study sessions yet.
65 Terms
A difference between explicit and implicit costs is that
implicit costs do not require a direct monetary outlay by the firm, whereas explicit costs do.
Cold Duck Airlines flies between Tacoma and Portland. The company leases planes on a year-long contract at a cost that averages $600 per flight. Other costs (fuel, flight attendants, etc.) amount to $550 per flight. Currently, Cold Duck's revenues are $1,000 per flight. All prices and costs are expected to continue at their present levels. If it wants to maximize profit, Cold Duck Airlines should
continue flying until the lease expires and then drop the run.
A firm produces 300 units of output at a total cost of $1,000. If fixed costs are $100,
average variable cost is $3.
Average total cost is very high when a small amount of output is produced because
average fixed cost is high.
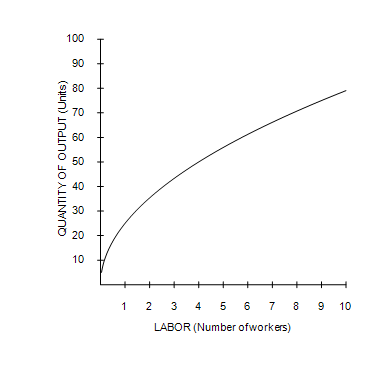
Refer to Figure 13-1. As the number of workers increases,
marginal product decreases.

Refer to Figure 13-2. Curve A is always declining because
we are dividing fixed costs by higher and higher levels of output.
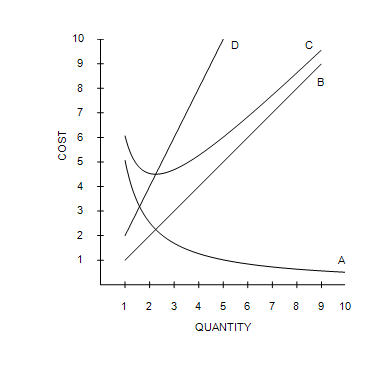
Refer to Figure 13-2. Curve D intersects curve C
at the efficient scale.

Refer to Figure 13-5. Which of the following statements is correct?
Average variable cost is declining for quantities less than B because marginal cost is lower than average variable cost.
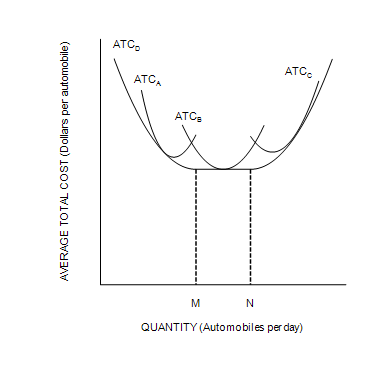
The following figure depicts average total cost functions for a firm that produces automobiles.
Refer to Figure 13-6. At levels of output less than M, the firm experiences
economies of scale.
If a firm uses labor to produce output, the firm's production function depicts the relationship between
the number of workers and the quantity of output.
If long-run average total cost decreases as the quantity of output increases, the firm is experiencing
economies of scale.
In the long run a company that produces and sells popcorn incurs total costs of $1,050 when output is 90 canisters and $1,200 when output is 120 canisters. The popcorn company exhibits
economies of scale because average total cost is falling as output rises.
Jane was a partner at a law firm earning $223,000 per year. She left the firm to open her own law practice. In the first year of business she generated revenues of $347,000 and incurred explicit costs of $163,000. Jane's economic profit from her first year in her own practice is
−$39,000.
Kate is a florist. Kate can arrange 20 bouquets per day. She is considering hiring her husband William to work for her. Together Kate and William can arrange 35 bouquets per day. What is William's marginal product?
15 bouquets
Marginal cost is equal to average total cost when
average total cost is at its minimum.
Scenario 13-3
Ziva is an organic lettuce farmer, but she also spends part of her day as a professional organizing consultant. As a consultant, Ziva helps people organize their houses. Due to the popularity of her home-organization services, Farmer Ziva has more clients requesting her services than she has time to help if she maintains her farming business. Farmer Ziva charges $25 an hour for her home-organization services. One spring day, Ziva spends 10 hours in her fields planting $130 worth of seeds on her farm. She expects that the seeds she planted will yield $300 worth of lettuce.
Refer to Scenario 13-3. What is the total opportunity cost of the day that Farmer Ziva spent in the field planting lettuce?
$380
Table 13-10
Teacher's Helper is a small company that has a subcontract to produce instructional materials for disabled children in public school districts. The owner rents several small rooms in an office building in the suburbs for $600 a month and has leased computer equipment that costs $480 a month.
Output (Instructional modules per month) | Fixed Cost (Dollars) | Variable Cost (Dollars) | Total Cost (Dollars) | Marginal Cost (Dollars) | Average Fixed Cost (Dollars per unit) | Average Variable Cost (Dollars per unit) | Average Total Cost (Dollars per unit) |
0 | 1,080 |
|
|
|
|
|
|
1 | 1,080 | 400 | 1480 | 400 |
|
|
|
2 |
|
|
| 450 |
|
| 965 |
3 |
| 1,350 | 2,430 |
|
|
|
|
4 |
| 1,900 |
|
| 475 |
| |
5 |
| 2,500 |
| 216 |
|
| |
6 |
|
| 4,280 | 700 |
|
|
|
7 |
| 4,100 |
|
|
|
|
|
8 |
| 5,400 |
|
| 135 |
|
|
9 |
| 7,300 |
|
|
|
|
|
10 |
|
| 10,880 |
|
| 980 |
|
Refer to Table 13-10. What is the average variable cost for the month if 6 instructional modules are produced?
$533.33
Table 13-11
| Long-Run Total Cost (Dollars) | ||
Firm A | Firm B | Firm C | |
1 | 100 | 100 | 100 |
2 | 100 | 200 | 300 |
3 | 100 | 300 | 600 |
4 | 100 | 400 | 1,000 |
5 | 100 | 500 | 1,500 |
Refer to Table 13-11. Which firm is experiencing diseconomies of scale?
Firm C only
Table 13-3
Labor (Number of workers) | Output (Units) | Fixed Cost (Dollars) | Variable Cost (Dollars) | Total Cost (Dollars) |
0 | 0 | 50 | 0 | 50 |
1 | 90 | 50 | 20 | 70 |
2 | 170 | 50 | 40 | 90 |
3 | 230 | 50 | 60 | 110 |
4 | 240 | 50 | 80 | 130 |
Refer to Table 13-3. The marginal product of the second worker is
80 units.
Table 13-5
The following table shows the production and costs for the Wooden Chair Factory.
Labor (Number of workers) | Capital (Number of machines) | Output (Chairs produced per hour) | Marginal Product of Labor (Chairs produced per hour) | Cost of Workers (Dollars) | Cost of Machines (Dollars | Total Cost (Dollars) |
1 | 2 | 5 |
|
|
|
|
2 | 2 | 10 |
|
|
|
|
3 | 2 | 20 |
|
|
|
|
4 | 2 | 35 |
|
|
|
|
5 | 2 | 55 |
|
|
|
|
6 | 2 | 70 |
|
|
|
|
7 | 2 | 80 |
|
|
|
|
Refer to Table 13-5.Each worker at the Wooden Chair Factory costs $12 per hour. The cost of each machine is $20 per day regardless of the number of chairs produced. What is the total daily cost of producing at a rate of 55 chairs per hour if the factory operates 8 hours per day?
$520
Table 13-7
The following table shows the production costs for The Flying Elvis Copter Rides.
Output (Helicopter rides) | Total Cost (Dollars) | Fixed Cost (Dollars) | Variable Cost (Dollars) | Marginal Cost (Dollars) | Average Fixed Cost (Dollars per ride) | Average Variable Cost (Dollars per ride) | Average Total Cost (Dollars per ride) |
0 | 50 | 50 | 0 | -- | -- | -- | -- |
1 | 150 | A | B | C | D | E | F |
2 | G | H | I | 120 | J | K | L |
3 | M | N | O | P | Q | 120 | R |
Refer to Table 13-7. What is the value of C?
$100.
Table 13-8
Output (Units) | Fixed Cost (Dollars) | Variable Cost (Dollars) |
0 | 20 | 0 |
1 | 20 | 10 |
2 | 20 | 40 |
3 | 20 | 80 |
4 | 20 | 130 |
5 | 20 | 200 |
6 | 20 | 300 |
Refer to Table 13-8. What is the average variable cost of producing 5 units of output?
$40
Table 13-9
Labor (Number of workers) | Output (Units) | Fixed Cost (Dollars) | Variable Cost (Dollars) |
0 | 0 | 30 | 0 |
1 | 100 | 30 | 15 |
2 | 180 | 30 | 30 |
3 | 240 | 30 | 45 |
4 | 280 | 30 | 60 |
5 | 300 | 30 | 75 |
Refer to Table 13-9. For the firm whose production function and costs are specified in the table, its total-cost curve is
increasing at an increasing rate.
Tom's Tent Company has total fixed costs of $300,000 per year. The firm's average variable cost is $80 for 10,000 tents. At that level of output, the firm's average total costs equal
$110
When a factory is operating in the short run,
it cannot adjust the quantity of fixed inputs.
A competitive market is in long-run equilibrium. If demand decreases, we can be certain that price will
fall in the short run. All, some, or no firms will shut down, and some of them will exit the industry. Price will then rise to reach the new long-run equilibrium.
Consider a competitive market with a large number of identical firms. The firms in this market do not use any resources that are available only in limited quantities. In this market, an increase in demand will
increase price in the short run but not in the long run.

Figure 14-1
Suppose that a firm in a competitive market has the following cost curves:
Refer to Figure 14-1. The firm will earn a negative economic profit but remain in business in the short run if the market price is
less than $13 but more than $6.
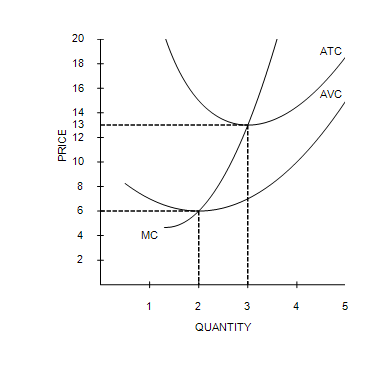
Figure 14-1
Suppose that a firm in a competitive market has the following cost curves:
Refer to Figure 14-1. The firm should shut down if the market price is
less than $6.
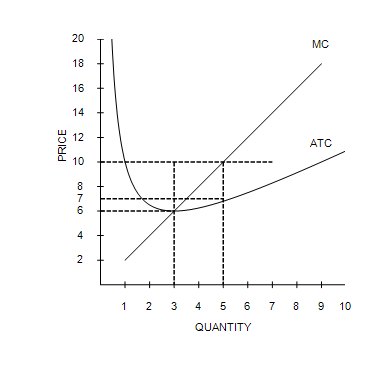
Figure 14-2
Suppose a firm operating in a competitive market has the following cost curves:
Refer to Figure 14-2. If the market price is $10, what is the firm's total cost?
$35
Figure 14-2
Suppose a firm operating in a competitive market has the following cost curves:
Refer to Figure 14-2. If the market price is $10, what is the firm's total revenue?
$50
Suppose a firm in a competitive market produces and sells 150 units of output and earns $1,800 in total revenue from the sales. If the firm increases its output to 200 units, the average revenue of the 200th unit will be
$12
If a firm in a perfectly competitive market triples the quantity of output sold, then total revenue will
exactly triple.
Ms. Joplin sells colored pencils. The colored-pencil industry is competitive. Ms. Joplin hires a business consultant to analyze her company's financial records. The consultant recommends that Ms. Joplin increase her production. The consultant must have concluded that, at her current level of production, Ms. Joplin's
marginal revenue exceeds her marginal cost.
Suppose a firm in a competitive market reduces its output by 20 percent. As a result, the price of its output is likely to
remain unchanged.
Table 14-1
Price (Dollars per unit) | Quantity Demanded (Units) |
5 | 0 |
5 | 1 |
5 | 2 |
5 | 3 |
5 | 4 |
5 | 5 |
5 | 6 |
5 | 7 |
5 | 8 |
5 | 9 |
Refer to Table 14-1. Over which range of output is average revenue equal to price?
Average revenue is equal to price over the entire range of output.
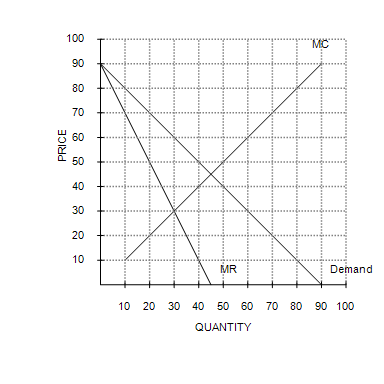
Refer to Figure 15-7. To maximize its profit, a monopolist would choose which of the following outcomes?
Q = 30 and P = 60
Table 15-1
The following table provides information on the price, quantity, and average total cost for a monopoly.
Price (Dollars per unit) | Quantity (Units) | Average Total Cost (Dollars per unit) |
24 | 0 | – |
18 | 5 | 14.00 |
12 | 10 | 11.00 |
6 | 15 | 10.67 |
0 | 20 | 11.00 |
Refer to Table 15-1. What is the maximum profit that the monopolist can earn?
$20
Table 15-2
Suppose a monopolist faces the following demand curve:
Price (Dollars per unit) | Quantity (Units) |
8 | 300 |
7 | 400 |
6 | 500 |
5 | 600 |
4 | 700 |
3 | 800 |
2 | 900 |
1 | 1,000 |
Refer to Table 15-2. The monopolist has fixed costs of $1,000 and has a constant marginal cost of $2 per unit. If the monopolist were able to perfectly price discriminate, how many units would it sell?
900
If government regulation sets the maximum price for a natural monopoly equal to its marginal cost, then the natural monopolist will
earn economic losses.
Which of the following can defeat the profit-maximizing strategy of price discrimination?
Arbitrage
A benefit to society of the patent and copyright laws is that those laws
encourage creative activity.
A firm cannot price discriminate if
it operates in a competitive market.
A government-created monopoly arises when
the government gives a firm the exclusive right to sell some good or service.
Table 14-2
The table represents a demand curve faced by a firm in a competitive market.
Price (Dollars per unit) | Quantity Demanded (Units) |
3 | 0 |
3 | 1 |
3 | 2 |
3 | 3 |
3 | 4 |
3 | 5 |
Refer to Table 14-2. For this firm, the marginal revenue from selling the 3rd unit is
$3
Table 14-6
Suppose that a firm in a competitive market faces the following revenues and costs:
Quantity (Units) | Total Revenue (Dollars) | Total Cost (Dollars) |
0 | 0 | 3 |
1 | 6 | 5 |
2 | 12 | 8 |
3 | 18 | 12 |
4 | 24 | 17 |
5 | 30 | 23 |
6 | 36 | 30 |
7 | 42 | 38 |
Refer to Table 14-6. In order to maximize profits, the firm will produce
5 units of output because marginal revenue equals marginal cost.
Table 14-7
A firm in a competitive market has the following cost structure:
Quantity (Units) | Total Cost (Dollars) |
0 | 5 |
1 | 10 |
2 | 12 |
3 | 15 |
4 | 24 |
5 | 40 |
Refer to Table 14-7.If the market price is $16, this firm will
produce 5 units of output in the short run and face competition from new market entrants in the long run.
Table 14-8
A firm in a competitive market has the following cost structure.
Quantity (Units) | Average Total Cost (Dollars) |
0 | -- |
1 | 10 |
2 | 8 |
3 | 7 |
4 | 8 |
5 | 10 |
Refer to Table 14-8.If the firm's fixed cost of production is $3, and the market price is $10, how many units should the firm produce to maximize profit?
3 units
When new firms enter a perfectly competitive market,
existing firms may see their costs rise if more firms compete for limited resources.
Whenever a perfectly competitive firm chooses to change its level of output, its marginal revenue
does not change.
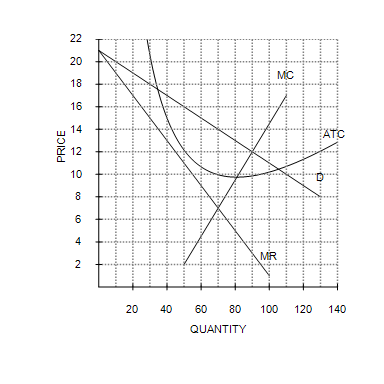
The following graph depicts the market situation for a monopoly pastry shop called Bearclaws.
Refer to Figure 15-5. Based upon the information shown, what price will Bearclaws charge to maximize profits?
$14

The following graph depicts the market situation for a monopoly pastry shop called Bearclaws.
Refer to Figure 15-5. Based upon the information shown, how many units will Bearclaws produce to maximize profits?
70

The following graph depicts the market situation for a monopoly pastry shop called Bearclaws.
Refer to Figure 15-5. Based upon the information shown, what are total costs for Bearclaws, given that it maximizes profits?
$700
A monopolist's profits with price discrimination will be
higher than if the firm charged just one price because the firm will capture more consumer surplus.
A perfectly price-discriminating monopolist is able to
maximize profit and produce a socially optimal level of output.

Refer to Figure 15-6. What is the monopoly price and quantity?
Price = A; quantity = X
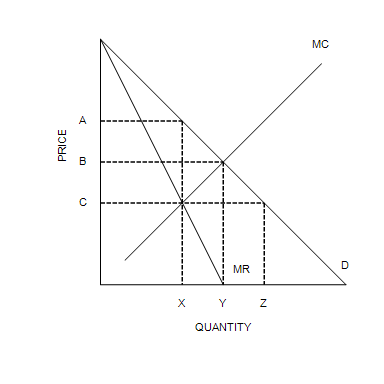
Refer to Figure 15-6. What is the socially efficient price and quantity?
Price = B; quantity = Y

Refer to Figure 15-6.What is the area of deadweight loss?
The triangle 1/2[(A − C) × (Y − X)]
If a profit-maximizing monopolist faces a downward-sloping market demand curve, its
marginal revenue is less than the price of the product.
Monopolies are socially inefficient because the price they charge is
above marginal cost.
Scenario 15-1
A monopoly firm maximizes its profit by producing Q = 500 units of output. At that level of output, its marginal revenue is $30, its average revenue is $60, and its average total cost is $34.
Refer to Scenario 15-1. At Q = 500, the firm's marginal cost is
Question 26
$30.
Table 15-1
The following table provides information on the price, quantity, and average total cost for a monopoly.
Price (Dollars per unit) | Quantity (Units) | Average Total Cost (Dollars per unit) |
24 | 0 | – |
18 | 5 | 14.00 |
12 | 10 | 11.00 |
6 | 15 | 10.67 |
0 | 20 | 11.00 |
Refer to Table 15-1. At what price will the monopolist maximize his profit?
$18
When a firm has a natural monopoly, the firm's
average total cost curve is downward sloping.
When a monopolist increases the amount of output that it produces and sells, average revenue
Which of the following is not an example of a barrier to entry?
An entrepreneur opens a popular new restaurant.