GIS Quiz 1
1/33
There's no tags or description
Looks like no tags are added yet.
Name | Mastery | Learn | Test | Matching | Spaced | Call with Kai |
|---|
No analytics yet
Send a link to your students to track their progress
34 Terms
Where do you package a project?
“Start Packaging” tab and then save .ppkx to Box
difference between .aprx and .gdb
.aprx: project file
project management for maps, layout, and data references
specific to one project, and references data but does not store data in file
has geodatabases within it!
.gdb: Geodatabase
container used to hold a collection of datasets
contains raw data that can be used across multiple projects
stored within project folder
Where do you save a project?
“Project” tab, then save to Box
What is in the map tab?
layers of data
How do you add data to a project?
“Map” tab, then “Add Data”
How to switch map aesthetics?
choose from “Basemaps”
What is the “Contents” pane?
contains layered map contents (layered data)
How to get an Excel sheet from contents layer?
click “Attribute Table” and then “Tools” and Excel button
What is “Fields Views”?
can alter attributes of data from “Attribute Data” tab
How to change Symbology of feature class?
“Contents” pane, then “Symbology”
example of Map-Scale ratio
1:24,000 (1 in. on the map is 24,000 in. on the ground (or 2,000ft.))
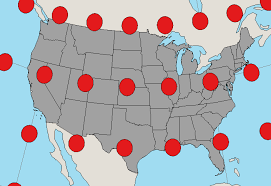
Spherical coordinates
Latitude and longitude
Latitude (Parallels)
+/-90 degrees of latitude = north and south poles (respectively)
Longitude (meridians)
180 degrees of longitude east and west (east positive and west negative)
prime meridian
0 degrees of longitude
Degrees, minutes, seconds
1 degree = 60 minutes
1 minute = 60 seconds
Ex. Pittsburgh, PA
40°26’2” N latitude
40°26’2” =
→ 40 + 26/60 +2/3600 =
→ 40 + .43333 + .0005 =
→ 40.43385° latitude
80°0’58” W longitude
80°0’58” =
→ 80 + 0/60 + 58/3600 =
→ 80.016° longitude
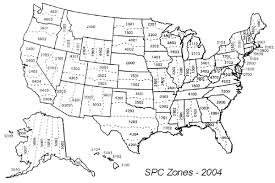
State Plane Coordinates
Used by US local governments
125 zones
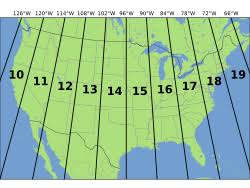
UTM (Universal Transverse Mercator)
covers whole world (60 zones)
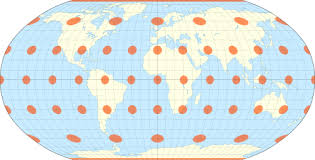
Map projections
Way to represent the curved surface of Earth on the flat surface of a map
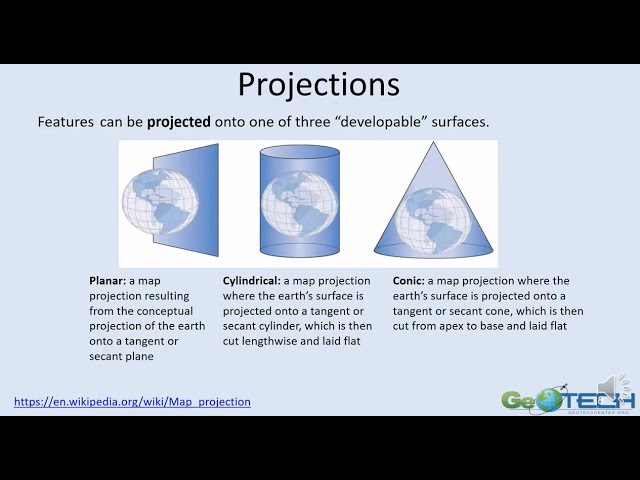
No distortion where surface touches Earth
“Secant” projection if surface pierces Earth
“Transverse” projections if rotated 90°
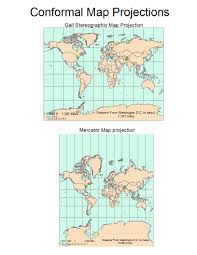
Conformal Projection
Typically a cylindrical projection
Flattens globe
Direction preserved
Parallels and meridians at right angles
Leads to major distortion!!!
size/shape/area of large objects is distorted as scale approaches infinity at poles
So bad for global maps, but good for direction
Equivalent Projection
Conic projection
Preserves accurate area
Uses 2 standard parallels
Shape (and scale) not preserved, but minimal distortion between the standard parallels
Best suited for east-west landscapes
Compromise Projections
Neither equivalent nor conformal
Meridians curve gently, avoiding extremes
Doesn’t preserve properties, but “looks right”
Ex. Robinson Projection
How to change projections?
In “Contents” pane, right-click and press “World Projections”
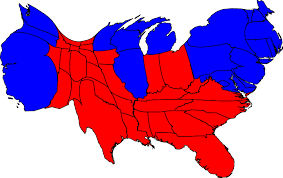
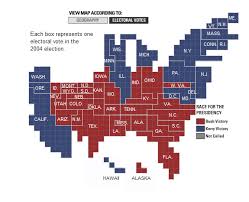
Cartograms
Distorted maps depending on another data source
Ex. dependent on social aspects, like median household income by region
TIFF (.tif) (tagged image file format):
common image format for high quality images
GIF (.gif) (graphic interchange format):
ideal for drawings w/ relatively large areas and few color variations
JPEG (.jpg) (Joint Photographic Experts Group):
most widely used format for photos/ images that have a lot of color variation
“Feature attribute table” of a feature class
Every feature has a record w/ attribute values
How to see XY Data?
Go to table of attribute by right-clicking on it →
→ hit “Display XY Data”
Data Table Format
Rectangular table w/ one value per cell
Columns (fields) are attributes
Rows (records) are observations
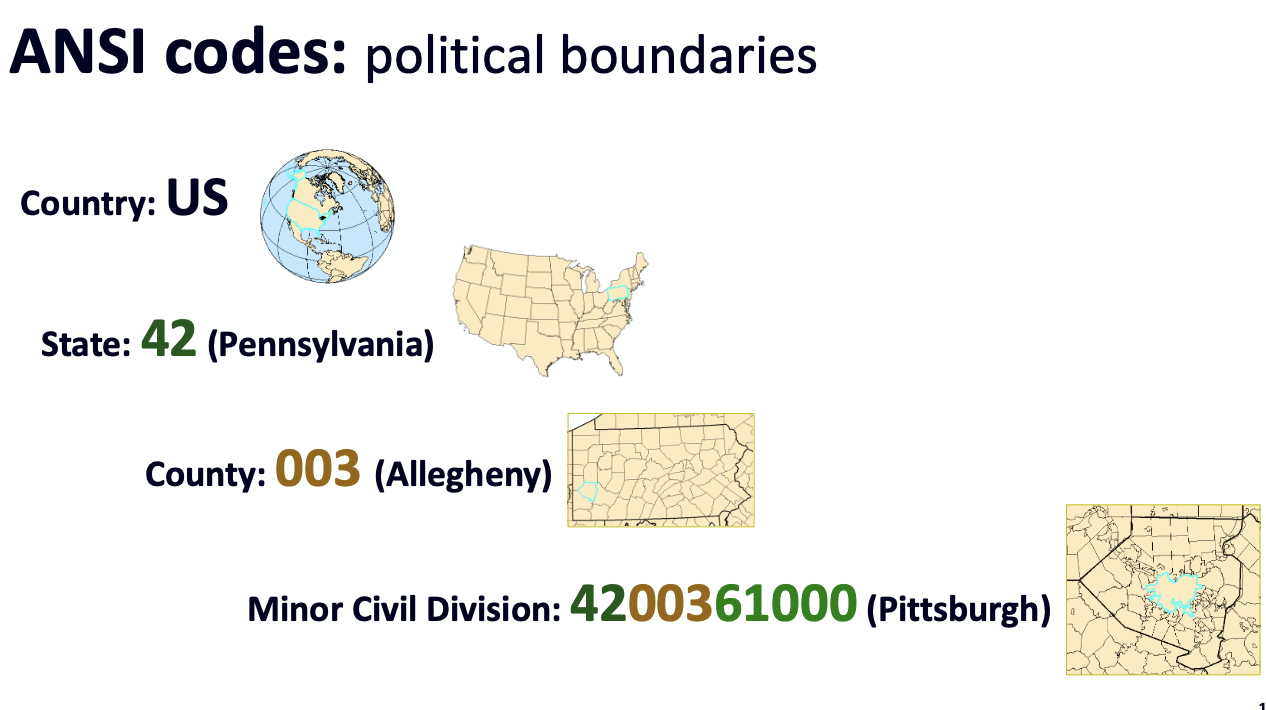
ANSI Codes (geocode)
Basically, add new groups of numbers to refine location down
Shapefile: ESRI Legacy Format
Multiple files, all having the same name but different file extensions
Reading: What is map thinking?
“the process through which elements of experience are abstracted, identified, joined, and then transformed into a common narrative.”
thinking of broad aspects of what could go into map and the reasons behind making a map, thus resulting in mapmaking
Reading: How do maps represent scientific thinking?
“It is the scientific thinking embodied in the map that makes discoveries available to us all.”
basically, maps —> scientific thinking (ex., in mapping disease)