Key to acing my computing technology exam
1/39
Earn XP
Description and Tags
You got this Sam
Name | Mastery | Learn | Test | Matching | Spaced |
|---|
No study sessions yet.
40 Terms
What is pandas and how might you import pandas?
Pandas is a powerful python library specifically designed for the analysis and manipulation of datasets.
To import pandas, it would be import pandas as pd
What is matplotlib and how might you import it?
Matplotlib is a widely used python-library that is used for the creation of static, animated, and interactive visualisations. E.g. It can make bar charts, histograms, and line and scatter plots.
You would import it like this: import matplotlib.pyplot as plt
What is a boolean, float, integer, string, and list?
A boolean is a yes or no, a float is a number with decimal places, and integer is a whole number, a string is letters or anything in inverted commas, and a list are values in found in a list.
What is directory another name for
Directory is another name for a folder
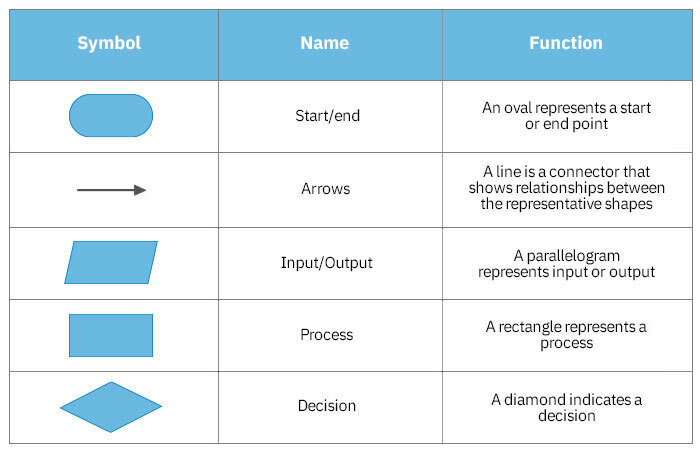
Flow diagrams
Flow diagrams help to visually represent the different parts of a process with different shapes symbolising different actions.
What are ultrasonic sensors?
Ultrasonic sensors are devices that calculate the distances of nearby objects by emiting high-frequency sound waves and measuring the time it takes for the high-frequency sound wave to arrive back at the ultrasonic sensors.
What is the tactile/touch sensor?
Touch sensors record physical contact/pressure.
What are colour sensors?
Colour sensors are devices that provide information about the colours in proximity to it. Colour sensors do this by emmiting white light then analysing the intensities of red green and blue that are reflected back to determine what colour it is looking at.
What is the yaw angle?
Yaw angle refers to the rotation of an object up to 360 degrees, around a vertical axis (side to side)
What does and oval, parallelogram, rectangle, and diamond represent in flow diagrams?
Oval: Terminator (start or stop)
Parallelogram: Input / output
Rectangle: Process (doing something)
Diamond: Decision diamond (allows the program to take alternative routes depending on the answer)
What is pseudocode?
Pseudocodes are written explanations in english about what your code does, psuedocode helps you to easily communicate your ideas and concepts to other programmers reading your code.
What is an algorithm?
An algorithm is a set of instructions for solving a problem or accomplishing a talk. In computer science, algorithms are the core of programs, telling a computer precisely how to process data and reach a desired result.
What are dictionaries?
Dictionaries have a key and a value. {key 1 : value 1}
Python numeric operators (7)
Addition: +
Subtraction: -
Multiplication: *
Division: /
Exponent: **
Modulo: % (returns the remainder E.g 5 divided by 4, return back a one
Floor division: // (always rounds down E.g. -3.33 will become -4, 4.7 will become 4
Python comparison operators
Equal to: ==
Different: !=
Greater than: >
Less than: <
Greater than or equal to: >=
Less than or equal to: <=
What is the difference between a datafram and a series?
A series is an individual column whereas a dataframe is two or more columns.
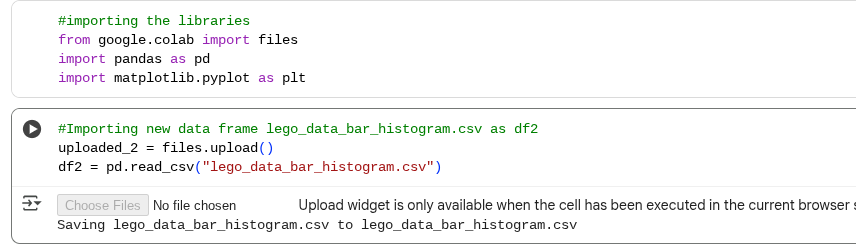
How to import files on Google.colab?
What is code, markdown, and raw
Code: Runs python code
Markdown: Like java, formal text
Raw: Plain text, no execution
Keyboard shortcuts (9)
A - Inerts a new cells above the current cell
B - Inserts a new cell below the current cell
Shift enter - Runs the code
Tab - Shows the potential variable names, functions, or methods (auto-complete).
M- Changes cell to markdown
Up and down keys - navigate between the different cells.
D,D - deletes cell
Z - undo deletion
Shift m - merges cells. If only one selected merges with on below. If two are selected, combines those two.
How to use headings and bold and italics
use one hashtag for heading one E.g #
Use two hashtags for headrting two etc
Bold text: **bold text**
Italics: *italics*
How to open visual studio code
Open terminal, cd “link of file” then type code
Terminal hacks 100% rea'l!1!1 (9)
cd: change directory
dir: lists directpries
code: opens visual studio code
jupyterlab: opens jupyter lab
del: deletes a file or folder
mkdir: makes a directory
clear: clears the terminal
cd..: go back a directory
~: till
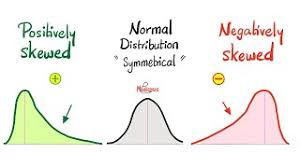
Bell curve, symmetrical, negatively skewed, positively skewed
Look at the cool photo I put Sam.
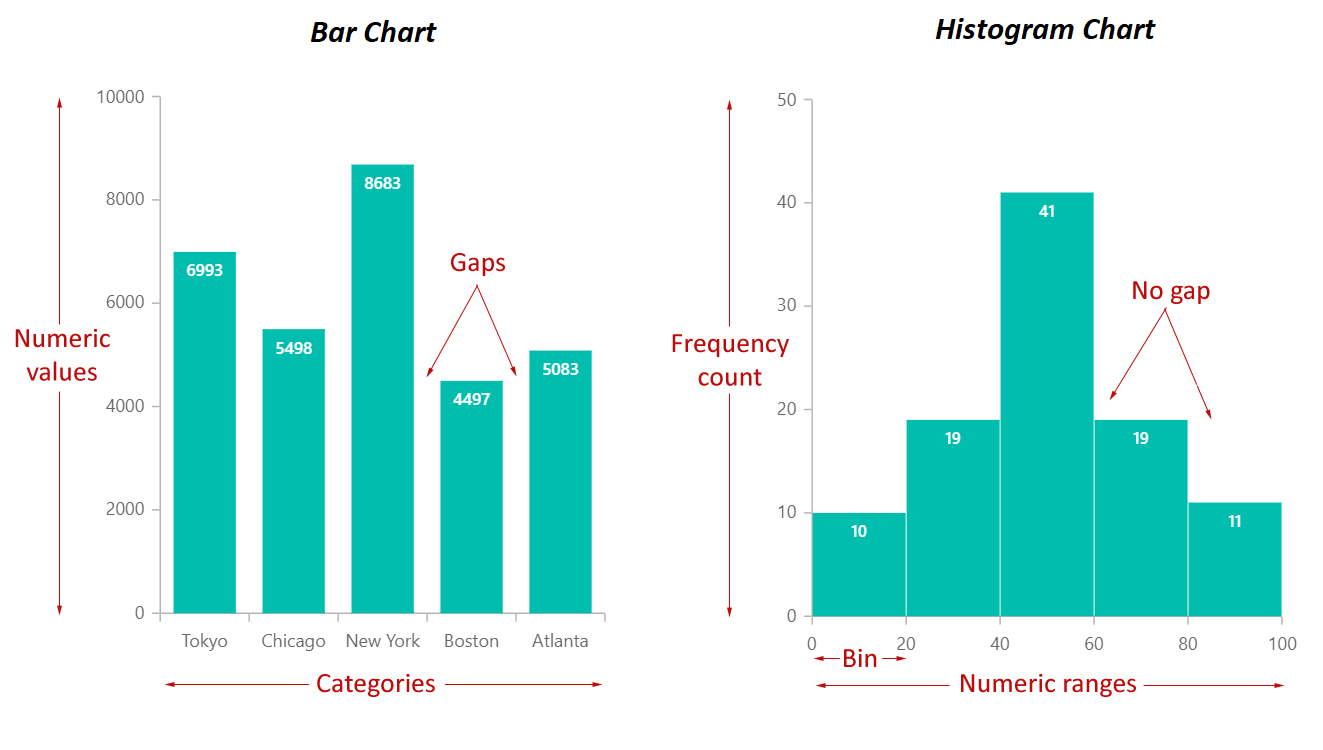
Whats the difference between bar charts and histograms? (3)
-Histograms always have frequency count on the y-label while bar charts have numeric values on y-label
- histograms have numeric range on the x-value where bar charts have categories on the x-labels
-Bar charts have gaps whereas histograms do not.
What is read_csv?
Read_csv is commonly used for data analysis.
When you use:
df2 = pd.read_csv('your_file.csv')
it reads the data from the specified file and returns a new dataframe containing that data in a tabular form storing it in the variable of your choosing (df2).
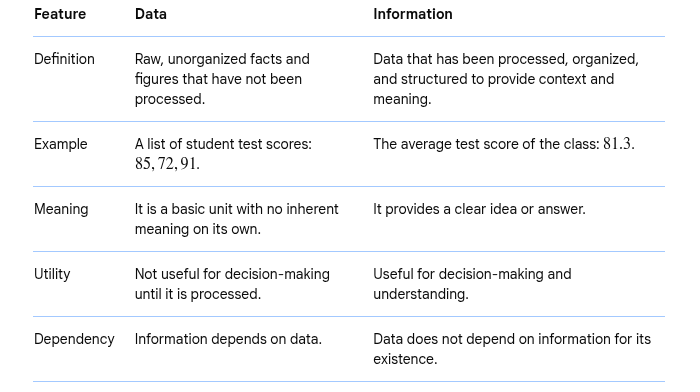
What is the difference between data and information?
The key difference is that data lacks meaning on its own, whereas information is the result of transforming data to provide a clear idea or answer.
Considerations:
Ethical (1)
Social (1)
legal (1)
Ethical: Represent the data honestly, not to put teams down through the data analysis report
Social: Imporve equity in the classroom, if certain groups are found not performing as well in the LEGO league competition such as little boys aren’t doing as well as little girls provide extra support.
Legal: Use data that has consent from all the teams, follow the legal rules set by the FIRST LEGO league on how its data can be used
Functional (2) and non-functional requirements (3) :
Functional requirements: Needs to be able to use pandas and matplot lib as they make working and deriving information from data sets easier
Needs to be able to create data visualisations like bar graphs and histograms.
Non-functional requirements: The application must allow for annotations such as comments so that it is easy for other people to read what the code written does and what information has been derived from said code.
The platforms needs to have correct data computation (can correctly calculate means, medians, interquartile range etc.)
The platform needs to protect the data and not let it be breached.
What is autonomy?
In robotics, autonomy refers to a robot's ability to make decisions and perform tasks without constant human guidance.
How to open jupyterlab in terminal?
Type Jupyterlab

Visualisation principles
Visualization principles guide the creation of data visuals that are clear, accurate, and effective.
What is modular programming
Modular programming is a software design technique that divides a large, complex program into smaller, independent parts called modules.
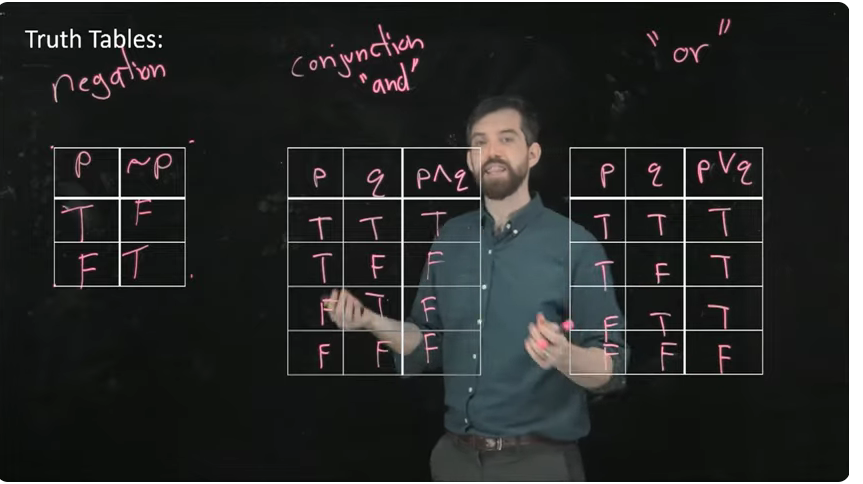
What are truth tables?
In computer science, a truth table is a mathematical table used to determine the output of a logic circuit or Boolean expression for all possible combinations of its inputs. Each row in the table represents a unique combination of input values (true or false), and the corresponding column shows the resulting output.
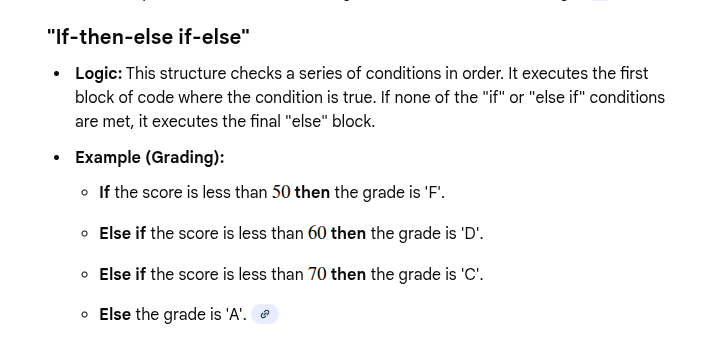
If, then, else logic?
If-then-else logic executes different actions based on whether a condition is true or false.
What is the code to create a bar charts and a histogram?
Bar charts: plt.bar(x_values, y_values)
Histogram: plt.hist(df[‘col1’], bins=10, edge color=’black’, color=’skyblue’)
![<p>Bar charts: plt.bar(x_values, y_values) </p><p></p><p>Histogram: plt.hist(df[‘col1’], bins=10, edge color=’black’, color=’skyblue’)</p>](https://knowt-user-attachments.s3.amazonaws.com/aa4fdb22-9e10-4ff4-bf11-99292feea252.png)
Looking at your data? (4)
df.head() #Shows first 5 rows df.tail() #Shows last five rows
These last three have no paranthesis
df.shape # number of rows and columns in the dataset
df.columns # Lists the column names
df.dtypes # Shows the data types for each column
Describing and summarising & value counts (4)
df.describe() # Summary statistics (mean, min, max, etc.)
df[‘col’].mean() # Mean of a column
df[‘col’].min() #Minimum value. Can get maximum value with .max()
count = df[‘col’].value_counts() # Counts each unique value in a column and stores it in count
![<p>df.describe() # Summary statistics (mean, min, max, etc.)</p><p>df[‘col’].mean() # Mean of a column</p><p>df[‘col’].min() #Minimum value. Can get maximum value with .max()</p><p>count = df[‘col’].value_counts() # Counts each unique value in a column and stores it in count</p>](https://knowt-user-attachments.s3.amazonaws.com/5e192032-3d38-43b5-aa7e-5bce950fa429.png)
Working with columns (3)
df[‘new’] = df[‘col1’] / df[‘col2’] #creates new column by diving col 1 by col 2
df[‘double’] = df[‘col’] * 2 #Multiplies a column’s value by 2
df[‘yes_no’] = df[‘ans’].replace({‘yes’: 1, ‘no’: 0})
#Changes the values of yes and no respectively to 1 and 0.
Filtering and sorting (3)
df[df[‘status’] == ‘complete’] #Filters rows where status is complete
df.sort_values(by=’score’, ascending=False) #Sorts values from highest to lowest
filtered = df[df[‘time’] <= 50] # Stores the rows with seconds eual to or less than 50 in the variable name filtered.
Grouping and aggregating (2)
df.groupby(‘group_col’)[‘val_col’].mean() # the average value of a column corresponding withs its group name
df[[‘col1’, ‘col2’]].mean() # Average of multiple columns
![<p>df.groupby(‘group_col’)[‘val_col’].mean() # the average value of a column corresponding withs its group name</p><p>df[[‘col1’, ‘col2’]].mean() # Average of multiple columns</p>](https://knowt-user-attachments.s3.amazonaws.com/fb1e1016-d1aa-4f5c-9dc7-c198f4aeffbc.png)