Unit 7 (STATS - 1000)
1/92
There's no tags or description
Looks like no tags are added yet.
Name | Mastery | Learn | Test | Matching | Spaced | Call with Kai |
|---|
No analytics yet
Send a link to your students to track their progress
93 Terms
Summary of Learning Objectives
Hypothesis tests for a population mean (ω known)
Hypotheses, test statistic, P - value, statistical significance
Two-sided tests and confidence intervals
What have we studied about statistical inference before?
confidence intervals
What was the goal with confidence intervals?
Use the sample mean ¯ x to construct an interval of values to estimate the population mean µ
What second type of statistical interference will we be studying now in unit 7?
Hypothesis testing
what is different about hypothesis test vs confidence intervals
A hypothesis test has a di!erent goal than confidence intervals
Where do we start with hypothesis testing?
we start with a claim about the value of some parameter
What is the parameter of intrest in this unit?
it is μ, the true population mean
What is our goal with hypothesis testing?
determine whether there is a strong enough evidence to support this claim
where does our evidence come from in hypothesis testing?
Comes from sample data
evidence” is ¯ x, the sample mean
Claim example 1
An economist claims the average weekly grocery expenses for Manitoba families is greater than $200
Claim: µ > 200
Claim example 2
A bank manager claims the average wait time customers have to wait in line is less than 5 minutes
Claim: µ < 5
Claim example 3
A real estate agent claims the average value of a house in a certain neighbourhood di!ers from $400,000
Claim: µ ≠ 400,000
Can we ever prove that the claim is correct?
never prove that a claim is correct (we can’t know for sure that µ has any particular value without actually calculating it!), but we try to reach our conclusions with a reasonably high probability of being correct
Example: A doctor claims that the average daily vitamin C intake
of Canadian females is less than the recommended amount of 75
mg. Suppose it is known that daily vitamin C intake for Canadian
females follows a normal distribution with a standard deviation of
20 mg. To test the doctors claim, we record the daily vitamin C intake for
a random sample of 25 Canadian females, and we find a sample
mean of 73 mg.
Is this strong enough evidence to support the doctor’s claim that
the true mean is less than 75 mg?
Maybe???? Maybe not???
Is it possible that the true mean daily vitamin C intake really is 75mg (the recommended dosage), and we observed a sample mean as low as 73 mg purely by chance?
This leads us to the question...
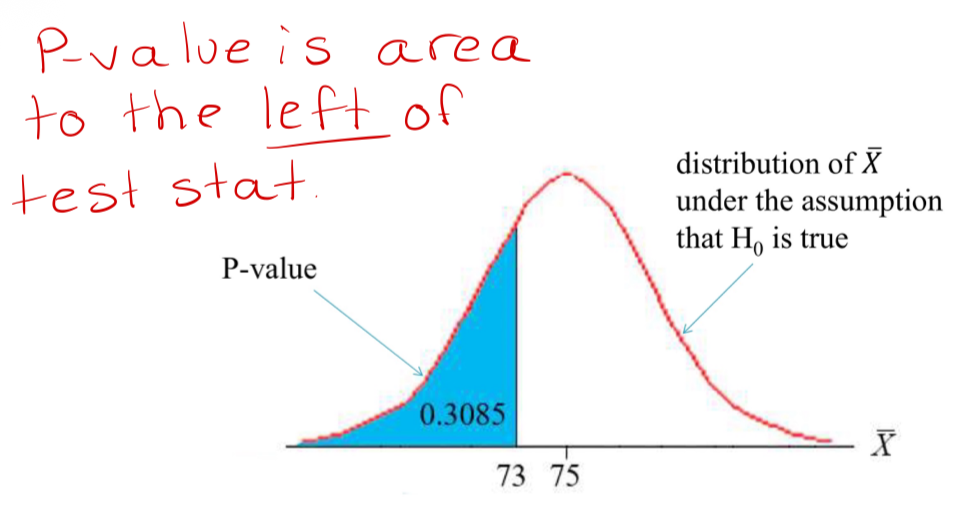
If the true mean daily vitamin C intake is 75 mg (i.e. if µ = 75), then what is the probability of observing a sample mean at least as low as 73mg?
So if the true mean daily vitamin C intake of all female Canadians was 75 mg, the probability of observing a sample mean at least as low as 73 mg would be 30.85%
So observing a sample mean as low as we did is quite likely.
In other words: if µ = 75, then observing a sample mean at least as low as 73 is not very surprising.
So our “evidence” that µ < 75 is not very strong. There is insu!cient evidence to support the doctor’s claim.
We would need a sample mean ¯ x even lower than 73 mg to be convinced that µ <75.
Note: We are NOT concluding that µ = 75, and that the doctors claim that µ < 75 is wrong
We just don’t have strong enough evidence for us to be convinced that µ < 75
Example: The parent council at an elementary school appeals to
the municipal government to install a red light camera at a nearby
intersection. The council claims that the average speed of
motorists at the intersection is greater than the posted speed limit
of 60km/hr. Suppose that the population standard deviation of speeds of
vehicles at the intersection is known to be 15 km/hr. A city worker
is sent to measure the speeds of a random sample of 50 motorists
at the intersection. The average speed of these 50 vehicles is 66
km/h.
Is this strong enough evidence to conclude that the true mean
speed µ of all drivers at the intersection is greater than 60? That
is, should a red light camera be installed?
Maybe????? Maybe not????
Is it possible that the true mean speed at the intersection really is 60 km/h (the posted speed limit), and we observed a sample mean as high as 66 km/h purely by chance?
We need to ask ourselves:
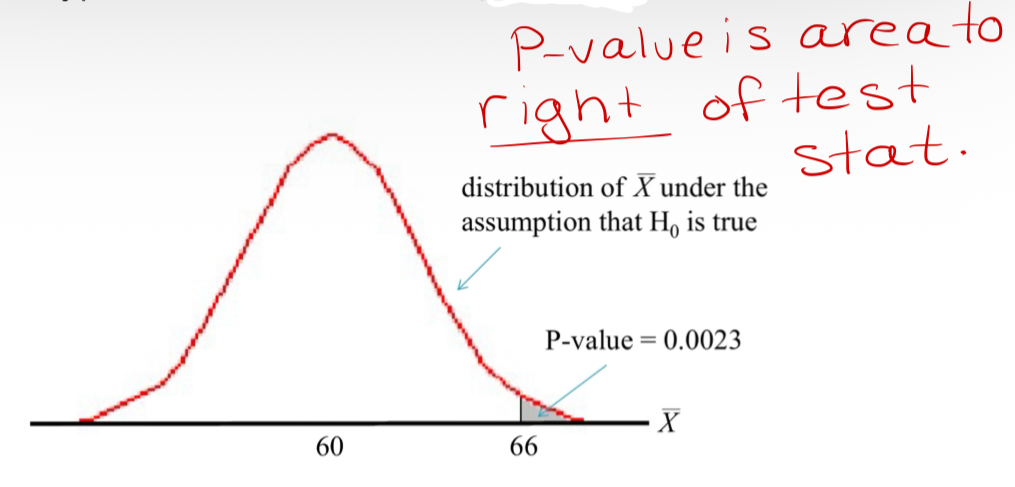
If the true mean speed of motorists at the intersection is 60 km/h (i.e. if µ = 60), then what is the probability of observing a sample mean at least as high as 66 km/h?
So if the true mean speed of vehicles at this intersection was 60 km/h, then the probability of observing a sample mean speed at least as high as 66 would only be 0.23%
So observing a sample mean as high as we did purely by chance would be extremely unlikely.
In other words: if µ = 60, then observing a sample mean at least as high as 66 is extremely surprising
So our ”evidence” that µ > 60 is very strong. There is su!cient evidence to support the parent council’s claim. It is reasonable to conclude that µ > 60, and so a red light camera is installed.
Note: There is always a possibility that we will be wrong in our conclusion.
Maybe the true mean speed really is 60, and we just happened to have an an exceptional sample of unusually fast vehicles. The probability of this happening is low (0.23%), but not impossible!
However, we are able to conclude in favour of the council’s claim (i.e. that µ > 60) with a reasonably high level of certainty
Foundation and main idea of hypothesis testing
“If our initial assumption were true, then how likely would it be to observe an estimate this extreme?”, and
“An outcome that would rarely occur if an assumption were true, is good evidence that the assumption is not true”
Alternative hypothesis
The statement making the claim we are trying to support
Alternative hypothesis denoted
Ha
how do we look at alternative hypothesis in term of μ
Ha : µ > µ0, Ha : µ < µ0, Ha : µ ≠ µ0
What does the hypothesis test assess
the evidence in favour of the alternative hypothesis
Example (Ha: μ < 75) {alternative hypothesis}
the average daily vitamin C intake of Canadian females is less than 75 mg
Example (Ha: μ > 60) {alternative hypothesis}
the average speed of all drivers at the intersection is greater than 60km/h
Null hypothesis
The statement being tested in a hypothesis test is called
Null hypothesis is denoted
Ho
What is our initial assumption
null hypothesis
what does the null hypothesis look like in terms of μ in this unit?
Ho: μ = μ0
What is Ho a statement of?
Statement of “no change”, “no di!erence” or “no e!ect”
What does the hypothesis test assess?
assesses the strength of the evidence against the null hypothesis
Example (Ho: μ = 75) {null hypothesis}
the average daily vitamin C intake of Canadian females is equal to 75 mg
Example (Ho: μ = 60) {null hypothesis}
the average speed of all drivers at the intersection is equal to 60km/h
P-value of the test
If we assume that the null hypothesis is true, then the probability of observing a sample mean ¯ x at least as high/low/extreme as the one observed
High (p-value)
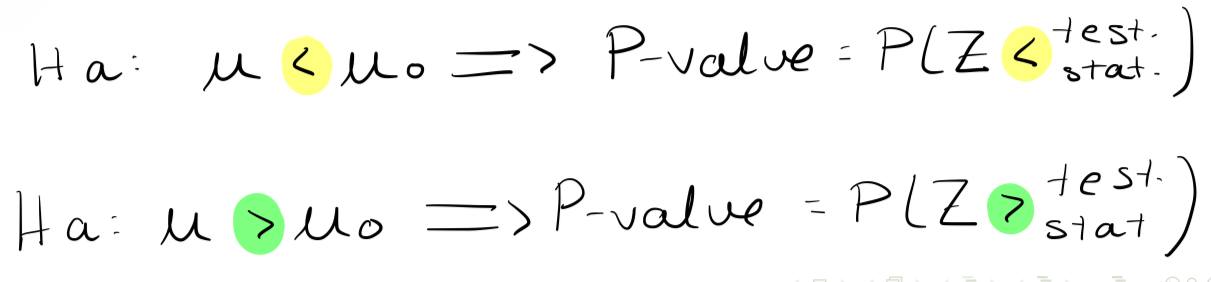
if our alternative hypothesis is of the form Ha : µ > µ0
Low (p-value)
If our alternative hypothesis is of the form Ha : µ < µ0
Extreme (p-value)
if our alternative hypothesis is of the form Ha : µ ≠ µ0
A low p-value means
we have strong evidence against the null hypothesis/in favour of the alternative hypothesis
Was the vitamin C example low enough to reject it?
P-value was 0.3085. Was not low enough to reject our original assumption that µ = 75 (i.e. reject H0) and to conclude that µ < 75 (i.e. conclude in favour of Ha) .
Was the speeding vehicle example low enough to reject it?
P-value was 0.0023. Was low enough to reject our initial assumption that µ = 60 (i.e. reject H0) and conclude that µ > 60 (i.e. conclude in favour of Ha).
How low does our P-value need to be to reject the null hypothesis in favour of the alternative hypothesis?
It depends! Before we perform a hypothesis test, we choose the level of significance of our test, denoted α.
if the p-value is less than or equal to α (reject the null hypothesis)
then we will reject H0 in favour of Ha
(reject the null hypothesis)
P-value is greater than α (reject the null hypothesis)
then we fail to reject H0
What is α then
α is the maximum P-value for which the null hypothesis will be rejected
Low α
we require strong evidence to reject Ho
When would you select the level of significance in real life?
before conducting the test
What if something is “high stakes”
then you require strong evidence: choose a low value of α
High stakes example
deciding if a medication is safe
What if something is “low stakes”
then you don’t need evidence to be that strong: choose a higher value of ε
What are the most common values of α (alpha)
0.01, 0.05, and 0.10
what value of α would we almost never use higher than
higher than 0.10
P-value method (hypothesis test steps)
State the level of significance, α
Statement of hypotheses, H0 and Ha
Statement of the decision rule
Calculation of the test statistic
Calculate the P-value
Conclusion
Decision rule (rejection rule)
is a precise statement of what must happen in order for us to reject the null hypothesis
What is the decision rule always?
Reject H0 if the P-value ≤ α
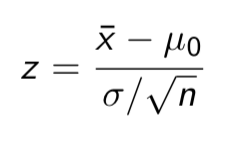
Test statistic
provides a measure of the compatability between the null hypothesis and our data
What our test statistic will always be
Z
Example: Perform a hypothesis test with a 5% level of significance for the car intersection example.
State the level of significance, α
α = 0.05
Statement of hypotheses, H0 and Ha
H0 : µ = 60 vs Ha : µ > 60
Statement of the decision rule
Reject H0 if the P-value < = 0.05
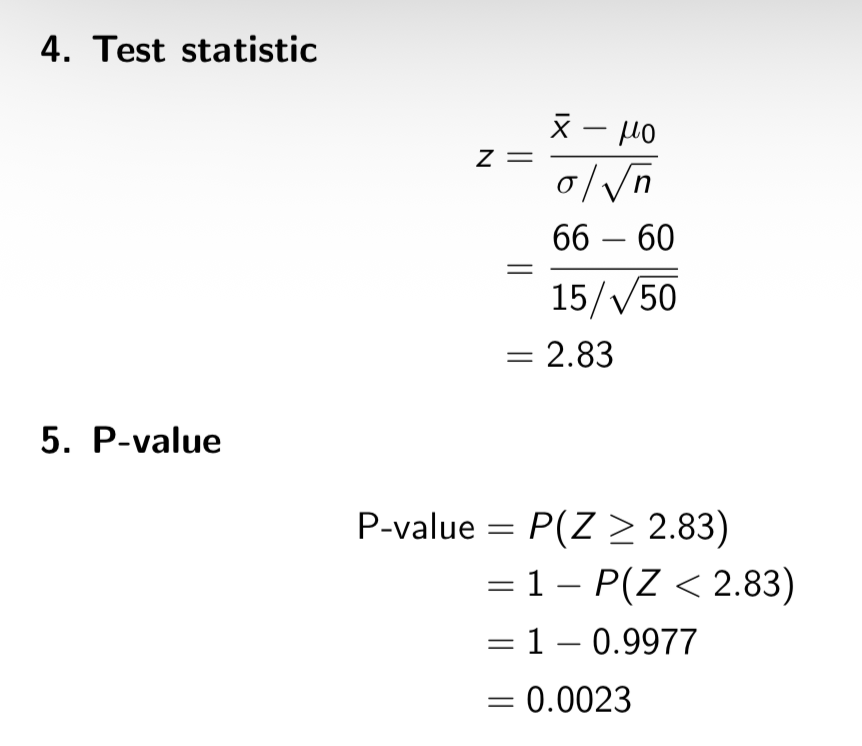
Calculation of the test statistic
Calculate the P-value
P-value interpretation:
“If the true mean speed of vehicles atthis intersection was 60, the probability of observing a sample mean at least as high as 66 would be 0.0023.”
Conclusion
Since the P-value = 0.0023 < α = 0.05, we reject the null hypothesis in favour of the alternative. At a 5% level of significance, we have su”cient statistical evidence to conclude that the true mean speed of motorists at the intersection is greater than 60 km/hr.
Right-sided test
since our alternative hypothesis is of the form Ha : µ > µ0
What makes something statistically significant
Results that lead to the rejection of a null hypothesis
What is statistical significance?
is an effect so large that it would rarely occur by chance alone
What are statistical hypothesis tests also called?
Tests of significance
Example: Perform a hypothesis test for the vitamin C example. Use α = 0.01
State the level of significance, α
Let α = 0.01
Statement of hypotheses, H0 and Ha
H0 : µ = 75 vs Ha : µ < 75
Statement of the decision rule
Reject H0 if P-value ≤ α = 0.01
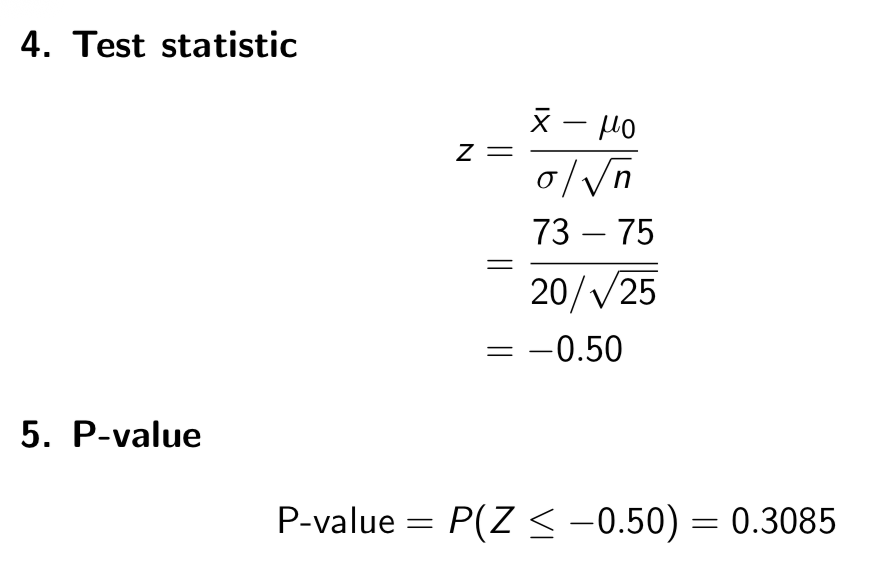
Calculation of the test statistic
Calculate the P-value
interpretation
“If the true average daily Vitamin C intake for Canadian females was 75mg, the probability of observing a sample mean at least as low as 73 mg would be 0.3085”
Conclusion
Since the P-value = 0.3085> ε = 0.01, we fail to reject the null hypothesis. At the 1% level of significance, we have insuffcient statistical evidence that the true mean Vitamin C intake for Canadian females is less than 75 mg.
What do you notice from looking at these examples?
We never conclude that H0 is true. All we can say is that we do not have enough evidence to reject the null hypothesis.
NEVER SAY “ACCEPT H0”!!!!
Left-sided test
We call the previous example a left-sided test, as the alternative hypothesis is of the form Ha : µ < µ0
Is there any significant difference between left and right sided hypothesis tests?
It is the alternative hypothesis, and how we calculate the P-value.
What is a simple rule for remembering the difference between calculating the P-value for the left- and right-sided tests?
The direction of the inequality in the P-value is the same as the direction of the inequality in the alternative hypothesis
Conclusion template (P-value method)
Since the P-value = P-value < / > α, we reject/fail to reject H0. At the α level of significance, we have sufficient/insufficient evidence that Ha is true
Fill in Bold items in context of the questions
What is the last type of hypothesis we’ll look at?
two sided test
two-sided tests are
hypothesis tests that consider deviations on both sides of the null hypothesis.
What form does the alternative hypothesis of a two sided test look like?
Ha: µ ≠ µ0
P-value (two-sided test)
P-value is the probability of observing a value of the sample mean at least as extreme (in either direction), (given that the null hypothesis is true)
What does “at least as extreme” mean?
at least as far away from our hypothesized population mean, µ0
Two sided hypothesis test example
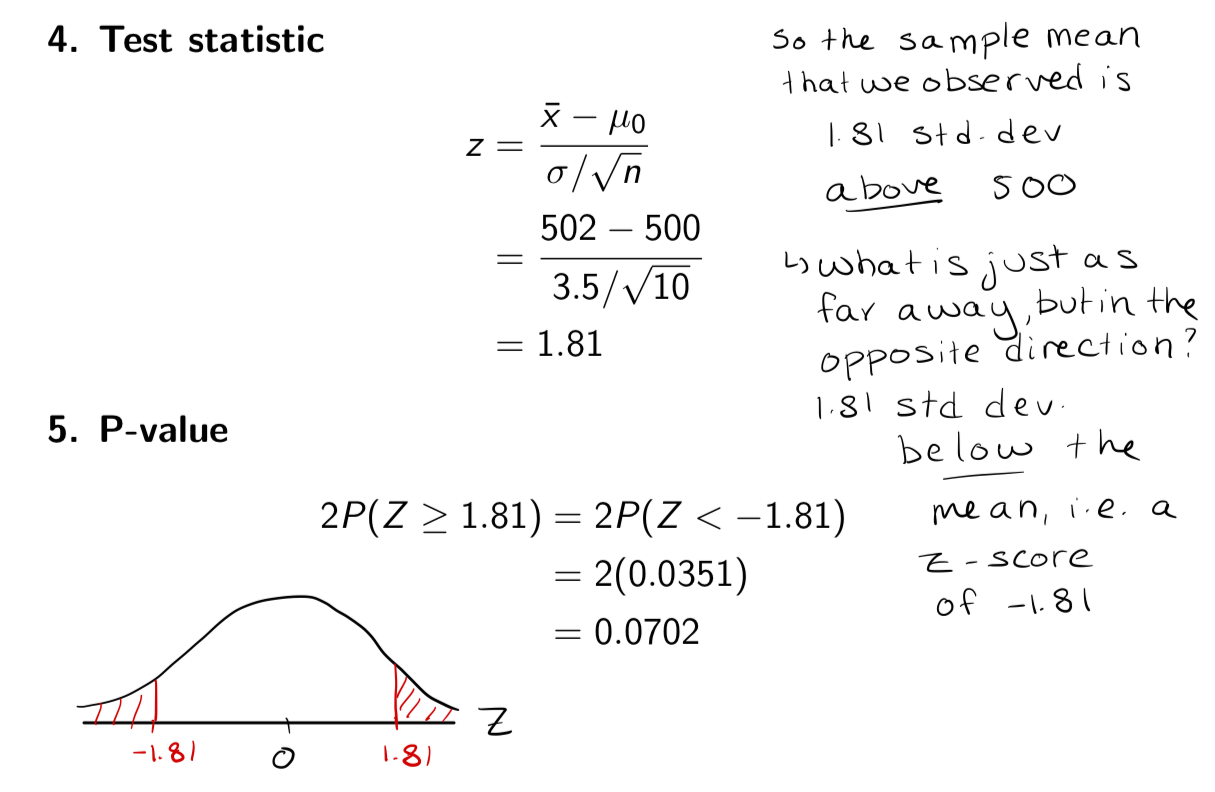
Example: The Mackenzie Valley Bottling Company distributes root beer in bottles labeled 500 ml. They routinely inspect samples of 10 bottles prior to making a large shipment, to detect if the true mean volume in the shipment di!ers from 500 ml. If the bottles are underfilled, the company could be sued for false advertising. If the bottles are overfilled, the company is spending more money than they need to.
Suppose it is known that fill volumes for the bottles of root beer follow a normal distribution with a standard deviation of 3.5 ml. One random sample of 10 bottles results in a sample average volume of 502 ml.
Does this provide convincing evidence that the true mean fill volume for the shipment di!ers from the advertised amount of 500 ml? Perform a hypothesis test with a 5% level of significance,
State the level of significance, α
Let α = 0.05
Statement of hypotheses, H0 and Ha
H0 : µ = 500 vs Ha : µ ≠ 500
H0 : The true mean volume of root beer in all bottles in the shipment is 500 ml
Ha: The true mean volume of root beer in all bottles in the shipment di!ers from 500 ml
Statement of the decision rule
Reject H0 if P-value ≤ α = 0.05
Calculation of the test statistic
Calculate the P-value
P-value interpretation
“If the true mean fill volume was 500 ml, the probability of observing a sample mean at least as extreme as 502 ml would be 0.0702”
Conclusion
Since the P -value = 0.0702 > ε = 0.05, we fail to reject H0. At the 5% level of significance, we have insu”cient evidence that the true mean volume of all bottles in the shipment di!ers from 500 ml.
How can the p-value can be found in a two-sided test?
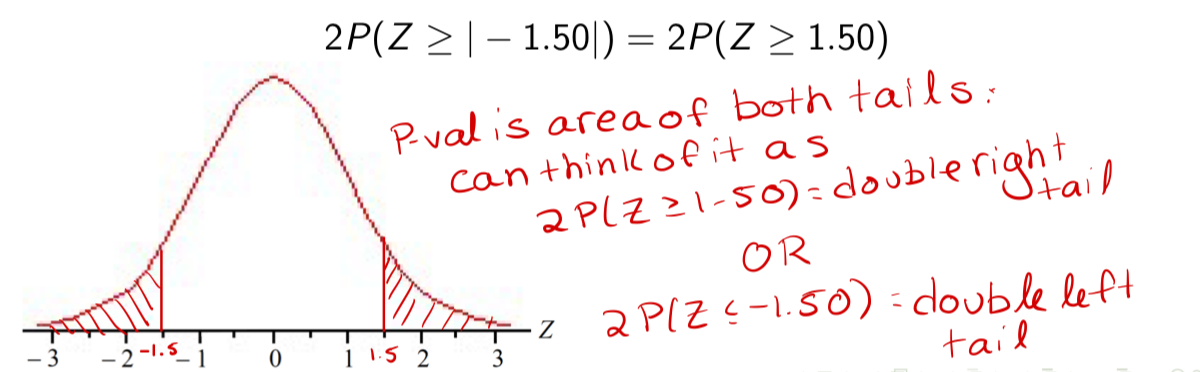
2P(Z ≥ |test. stat.|)
absolute value
|z| = the positive version of z
Example (absolute value)
If we are conducting a two-sided test, and we calculate a test statistic of z =↘1.50, then the P-value is
2P(Z ≥ 1.50)
Summary of P-value for testing H0: μ = μο vs:
Ha : µ > µ0 is P(Z > z)
Ha : µ < µ0 is P(Z < z)
Ha : µ →= µ0 is 2P(Z > |z|)
When are the calculated P-values exact?
If the population is normal, and approximate for large sample sizes in other case (by the CLT)
P-value interpretation template
If the null hypothesis were true, then the probability of observing a sample mean at least as high/low/extreme as the sample mean observed would be P-value
Write Bold items in the context of the question
when do you write high? (P-value interpretation)
right-sided test
when do you write low? (P-value interpretation)
left-sided test
when do you write extreme? (P-value interpretation)
two-sided test
Verifying results
Notice that in the root beer example, we were very close to rejecting H0. Our P-value (0.0702) is only slightly higher than our level of significance (0.05)
Remember, the fact that we didn’t reject H0 doesn’t mean we have enough evidence to conclude that µ truly is 500 ml - it just means we didn’t have strong enough evidence to conclude with high enough certainty that µ differs from 500 ml.
Because we got a value of ¯ x that was very close to rejecting H0, the company might wish to take another sample of bottles, and conduct another test to verify the results
Some NO NO NO’s
“Our P-value of 0.0702 was almost lower than our level of significance ε = 0.05. Why don’t we just change α to be 0.10? Then our P-value is lower than α, and we can reject H0.”
Is it okay to do this???
mean ¯ x = 502, which is greater than 500. So it seems reasonable to think that if µ differs from 500, it is probably higher.
So why don’t we conduct an upper tailed test (i.e. right-sided test) of H0 : µ = 500 vs Ha : µ > 500? Then we would not have doubled the tail area, so that our P-value would have ended up being 0.0351. This is less than α = 0.05, and so we would be able to reject H0”
Is this okay to do???
Is it okay to change the level of significance?
No!!!!!!! It is unethical to make changes after a test has been completed
It is important that the level of significance is chosen before we conduct the test. It is not appropriate to change the level of significance after conducting the hypothesis test.
Is it okay to change a two-sided test into a upper tailed test? (
Still NO!!!! This is not appropriate! We were originally interested in determining whether µ differs from 500 in either direction.
Why can’t we change a two-sided test into a upper tailed test
The fact that ¯ x was greater than 500 doesn’t mean we can change our alternative hypothesis, as though suddenly we were only interested in µ being greater than 500
The hypotheses need to be determined before we conduct the test. It is unethical to change the hypotheses or the level of significance to get a certain desired outcome.
What is the other method for conducting a two-sided hypothesis test
confidence interval method
what two conditions must be satisfied to use a confidence interval to conduct a hypothesis test.
The test must be two-sided, and
The confidence level and level of significance must add up to 1
E.g. if we are conducting a two-sided test with a 1% level of significance, we need to use a 99% confidence interval
When does a two-sided test reject the null hypothesis (confidence interval method)
A two-sided test with significance level ε rejects the null hypothesis if µ0 falls outside the 100(1 - α)% confidence interval. If µ0 falls inside the interval, we fail to reject H0
Does this decision rule/ confidence interval method make sense?
YES!!! Think: we are supposed to be reasonably confident that our confidence interval contains the true value of µ.
If µ0 is outside our confidence interval, then it is not reasonable to believe that µ= µ0. Thus we reject H0.
If µ0 is inside of our confidence interval, that it is reasonable to believe that µ could be equal to µ0. Thus we fail to reject H0.
Confidence interval method steps
Statement of level of significance
Statement of hypotheses
Statement of decision rule:
Reject H0 if µ0 is not in the 100(1 - α)% confidence interval.
Calculation of 100(1≤ α)% confidence interval
Conclusion
Example (Confidence Interval Method)
Perform a hypothesis test for the root beer example, using the confidence interval method and α = 0.05
Statement of level of significance
Let α = 0.05
Statement of hypotheses
H0 : µ = 500 vs Ha : µ ≠ 500
Statement of decision rule:
Reject H0 if µ0 = 500 is not in the 95% confidence interval for µ
Calculation of 100(1≤ α)% confidence interval
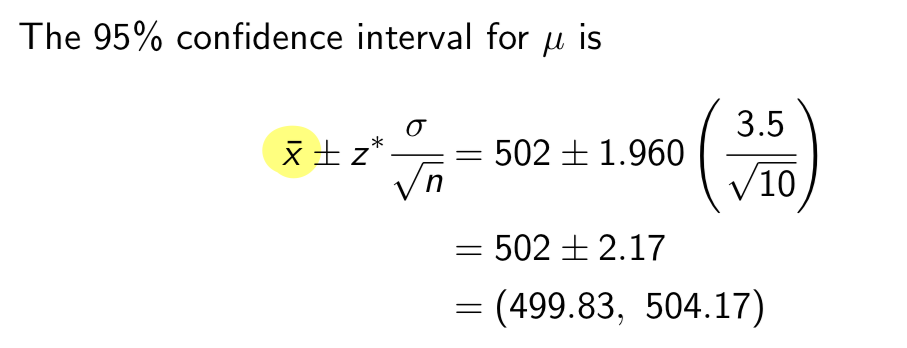
The 95% confidence interval for µ is
Conclusion
Since µ0 = 500 falls within the 95% confidence interval, we fail to reject H0. At the 5% level of significance, we have insufficient evidence that the true mean volume of all bottles in the shipment differs from 500 ml.
Note (Confidence Interval Method)
For a 2-sided test, it shouldn’t matter which method you use: both methods (P-value or confidence interval) should bring you to the same conclusion
Conclusion Template (Confidence Interval Method)
Since µ0 = µ0 falls within/does not fall within the C% confidence interval, we fail to reject/reject H0. At the α% level of significance, we have insufficient/sufficient evidence that Ha is true.
Write the Bold items in the context of the question