Macroeconomics 1
1/29
There's no tags or description
Looks like no tags are added yet.
Name | Mastery | Learn | Test | Matching | Spaced | Call with Kai |
|---|
No analytics yet
Send a link to your students to track their progress
30 Terms
Production Method
Expenditure Method
Income Method
Production Method = VA = Output - intermediate
Expenditure Method = C+I+G
Income Method = labor + returns=profit from caputal to owners, after paying everyone if included
GDP Deflator use and equation
Compares PL & thus inflation at different times
GDP Deflator = Nominal GDP / Real GDP
CPI equation
P1 X Basket / P2 x basket
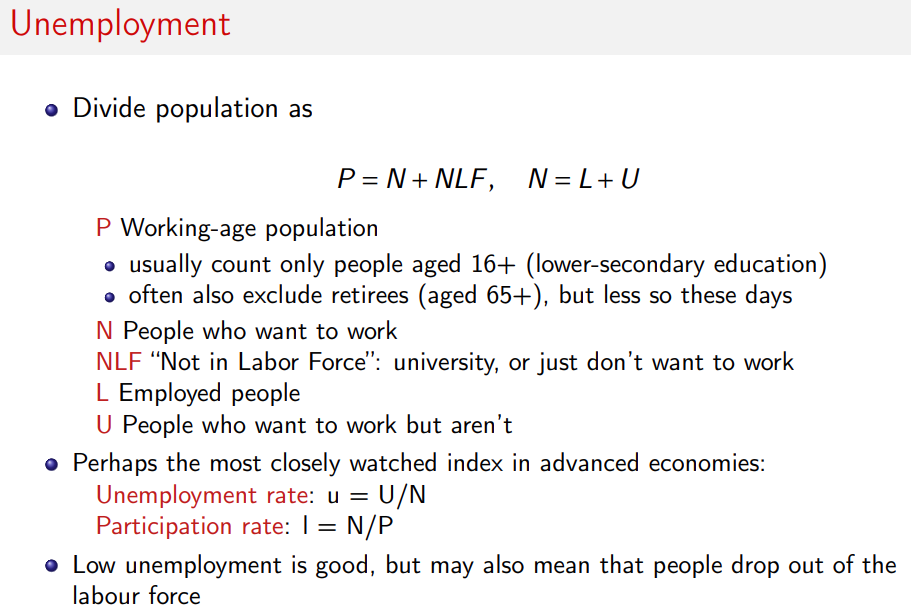
Unemployment notation P,N,NLF,L,U
Production Function graph
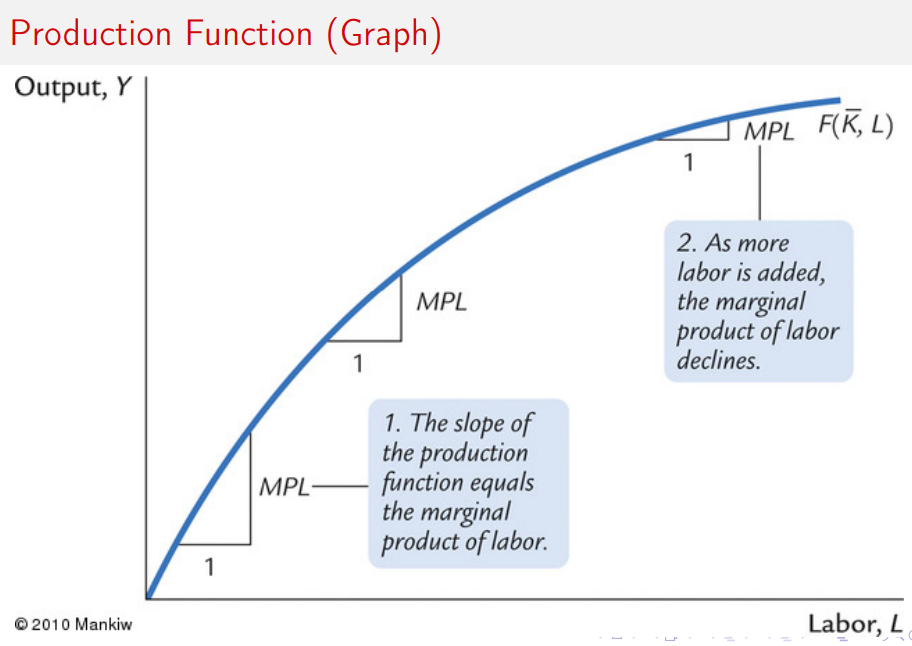
MPL(Ld) equation
Firms hire labour until the marginal product of labour equals the real wage.MPL = W/ P
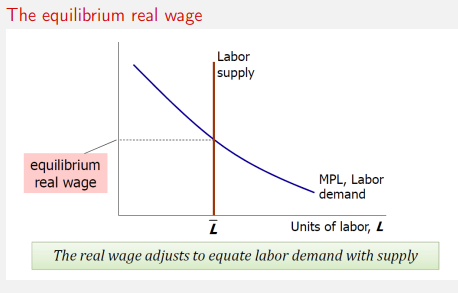
Labour Market equillibrium Graph
Natural rate of unemplyment in the long run equation

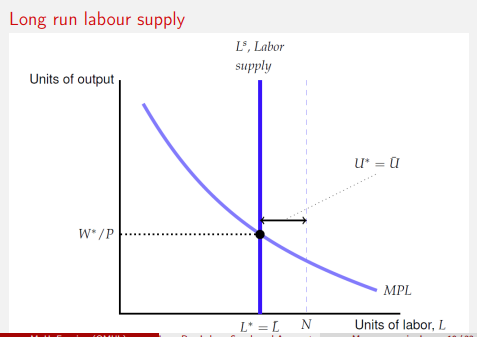
Long run laboiur supply graph
U* to L* is NRU*
U* = NRU
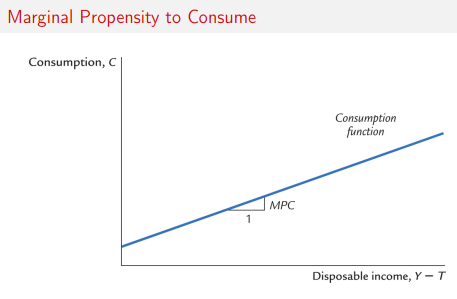
Gneeric Consumption equatio
C = C(Y-T)
remember the factor disp in is MPC
MPC Graph
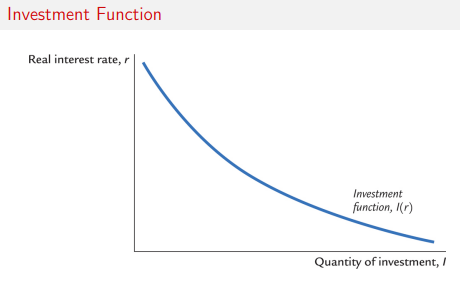
Investment graph
National savings
Private savings = Y -T - C
Public savings = T - G
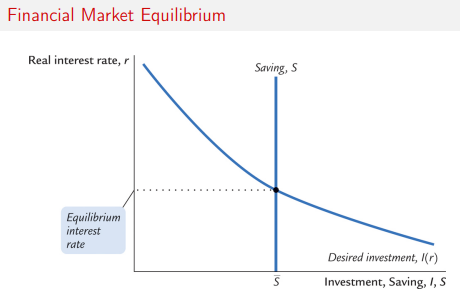
Financial Market equillibroium
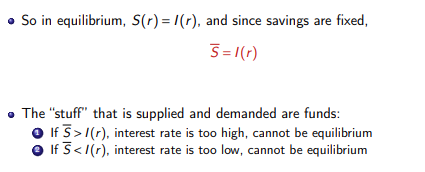
Financial Market eq graph
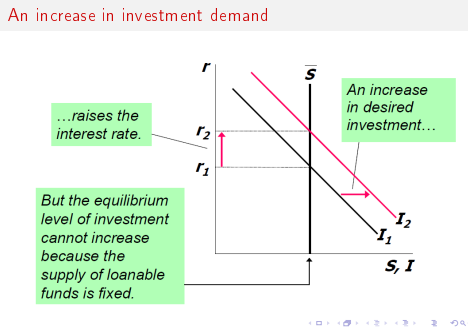
Increase in investment demand (graph)
reserve requirements equation
rr = R/D
Definition of Money supply and Moentary Base
Money Supply (Ms)=Currency held by public (C)+Deposits in banks (D)
Monetary Base = B = C+R
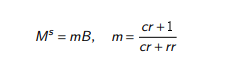
Money supply equations
Ms = m x B
m = (1+cr) / (cr+rr)
cr = C/D
rr = R/D
B = C + R
CB can only affect rr or B not cr which is determined by consumers
Money Demand equations
Md=P x Yd x L(i)
Money demand equals the price level times real income times liquidity preference,
where liquidity preference decreases when the interest rate increases.
Money Marjet equillibrium (Graph)
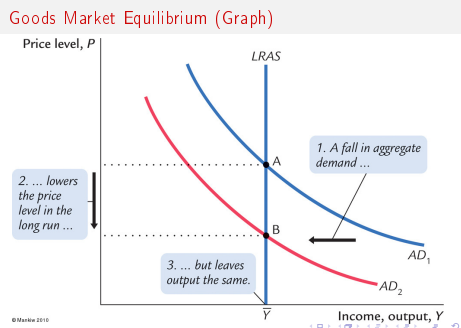
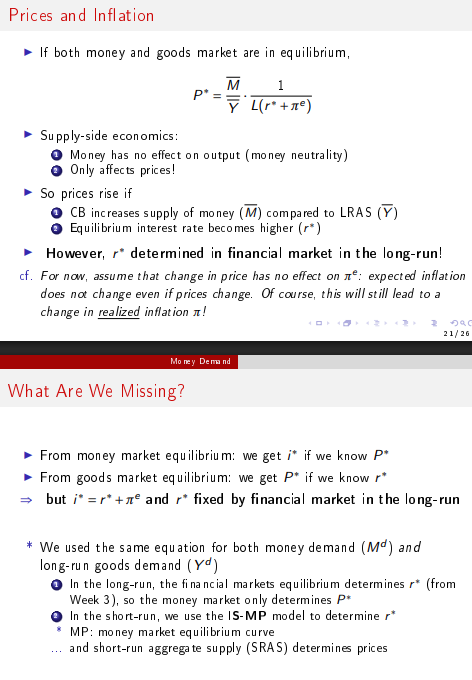
Long-run equilibrium price level equation(P*)
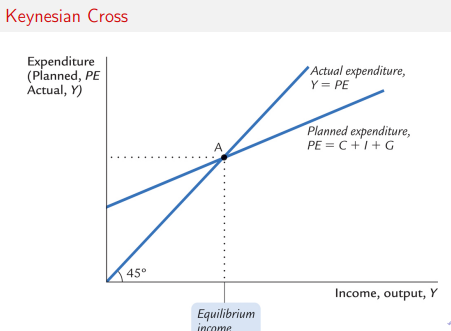
Keynesians cross
The Keynesian Cross shows that the economy reaches equilibrium when planned expenditure equals actual output (Y=PE)(Y = PE)(Y=PE), which determines the level of income/output in the short run. It highlights how changes in spending (like government spending) shift planned expenditure and lead to multiplied changes in output, explaining demand-driven fluctuations.
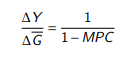
Fiscal multipler
multiplier is 1 / 1-MPC
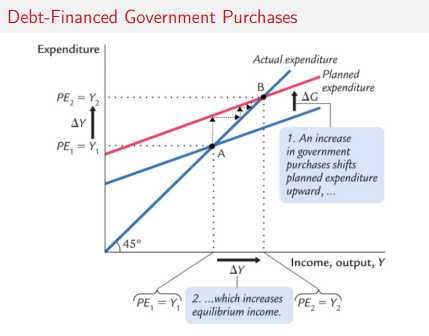
debt financed government purchases (graphs)
Tax multiplier equaion
u times the change in to get the change in Y

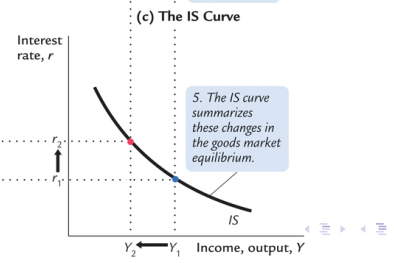
IS curve(graph)
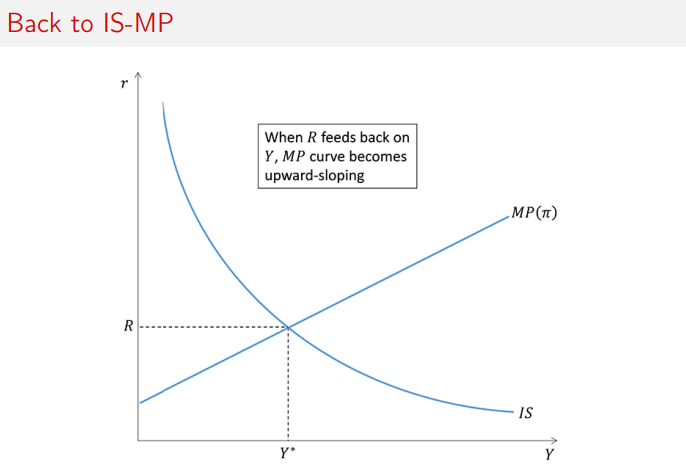
IS-MP Graph
long run equillibrium interest rate (R)
r+inflation
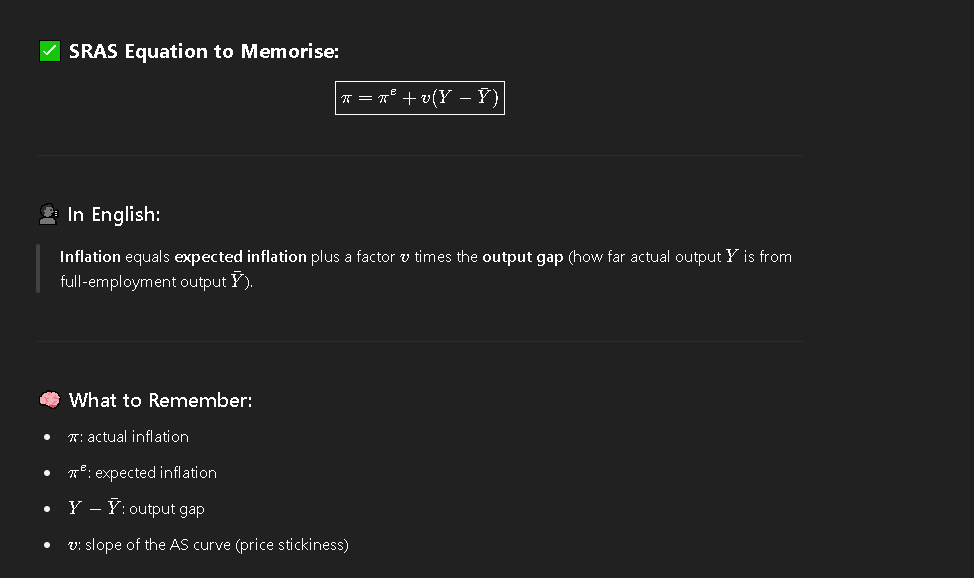
SRAS equation