02.20 BIO, HN U2P2 Population Dynamics (ALL)
1/74
There's no tags or description
Looks like no tags are added yet.
Name | Mastery | Learn | Test | Matching | Spaced |
|---|
No study sessions yet.
75 Terms
Geographic Range
The area geographic area inhabited by a population which can vary enormously in size, depending on the species.
Population Distribution
Refers to how individuals in a population are spaced out across the range of the population—randomly, uniformly, or mostly concentrated in clumps.
Population Density
Refers to the number of individuals per unit area.
Biotic Potential
Characteristics of living things that increase their chance of survival. Examples include organisms with high reproductive rates, an ability to migrate or disperse, an ability to invade new habitats, defense mechanisms, and an ability to cope with adverse conditions.
Environmental Resistance
Combination of abiotic and biotic factors in the environment that limit the ability of living things to thrive and reproduce. Examples include - lack of food, nutrients, water, suitable habitat, adverse weather conditions, predators, disease, parasites and competitors.
Population Equilibrium
A dynamic balance between births and deaths.
Population Growth
Determines whether the population size increases, decreases, or stays the same.
Immigration
A process in which individuals move into its range from elsewhere as animals search for mates and food, resulting in an increase in population size.
Emigration
A process in which individuals move out of the population's range to find food, mates or establish a new territory, resulting in a decrease in population size.
Exponential Growth
Growth of a population when unlimited resources and ideal conditions exist, represented as a J-curve when growth is plotted over time. The larger a population gets, the faster it grows. The size of each generation of offspring will be larger than the generation before it.
J-Shaped Curve
A growth curve that rises slowly at first, and then rises faster and faster, representing exponential growth.
R-Strategists
A reproductive growth strategy in which organisms that live in unstable environment and typically have short life expectancies have many offspring that require low parental care. This results in exponential growth and a J-Shaped Growth Curve.
K-Strategists
A reproductive strategy in which organisms that live in stable environments and typically have long life expectancies have few offspring with high parental care. This results in logistic growth and an S-Shaped Growth Curve.

S-Shaped Curve
A growth curve that represents what is called logistic growth. Growth of the population starts slowly at first and as the population begins to compete for resources growth steadies and stabilizes at carrying capacity.
Carrying Capacity
The maximum number of individuals of a particular species that a particular environment can support. Growth rate is zero.
Factors Affecting Population Growth
* The number of births
* The number of deaths
* The rate at which individuals enter (immigration) or leave
(emigration) the population
Positive Growth Rate
A population increases in size due to birth rate exceeding death rate and/or immigration exceeding emigration.
Negative Growth Rate
A population decreases in size due to death rate exceeding birth rate and/or emigration exceeding immigration.
Zero Growth Rate
A population stays about the same size due to birth rate and death rate being the same and/or immigration and emigration being the same.
Phases of Population Growth
Phase I - The population grows rapidly.
Phase II - Growth slows
Phase III - Growth stops and stabilizes at carrying capacity
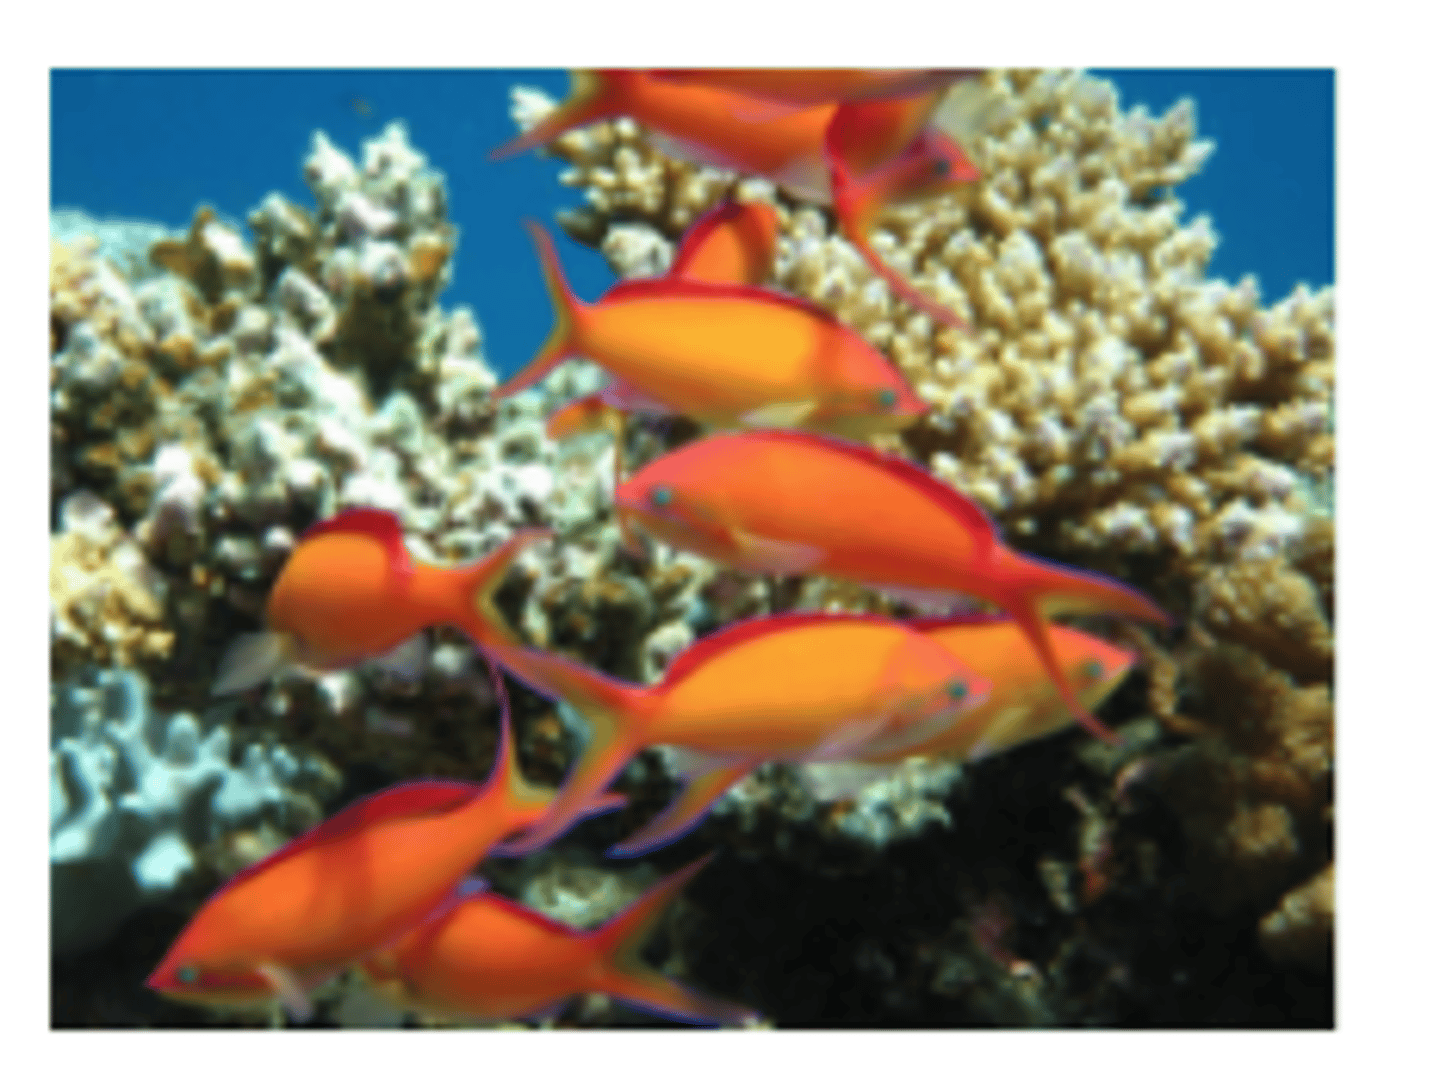
Clumped Population Distribution
A school of fish
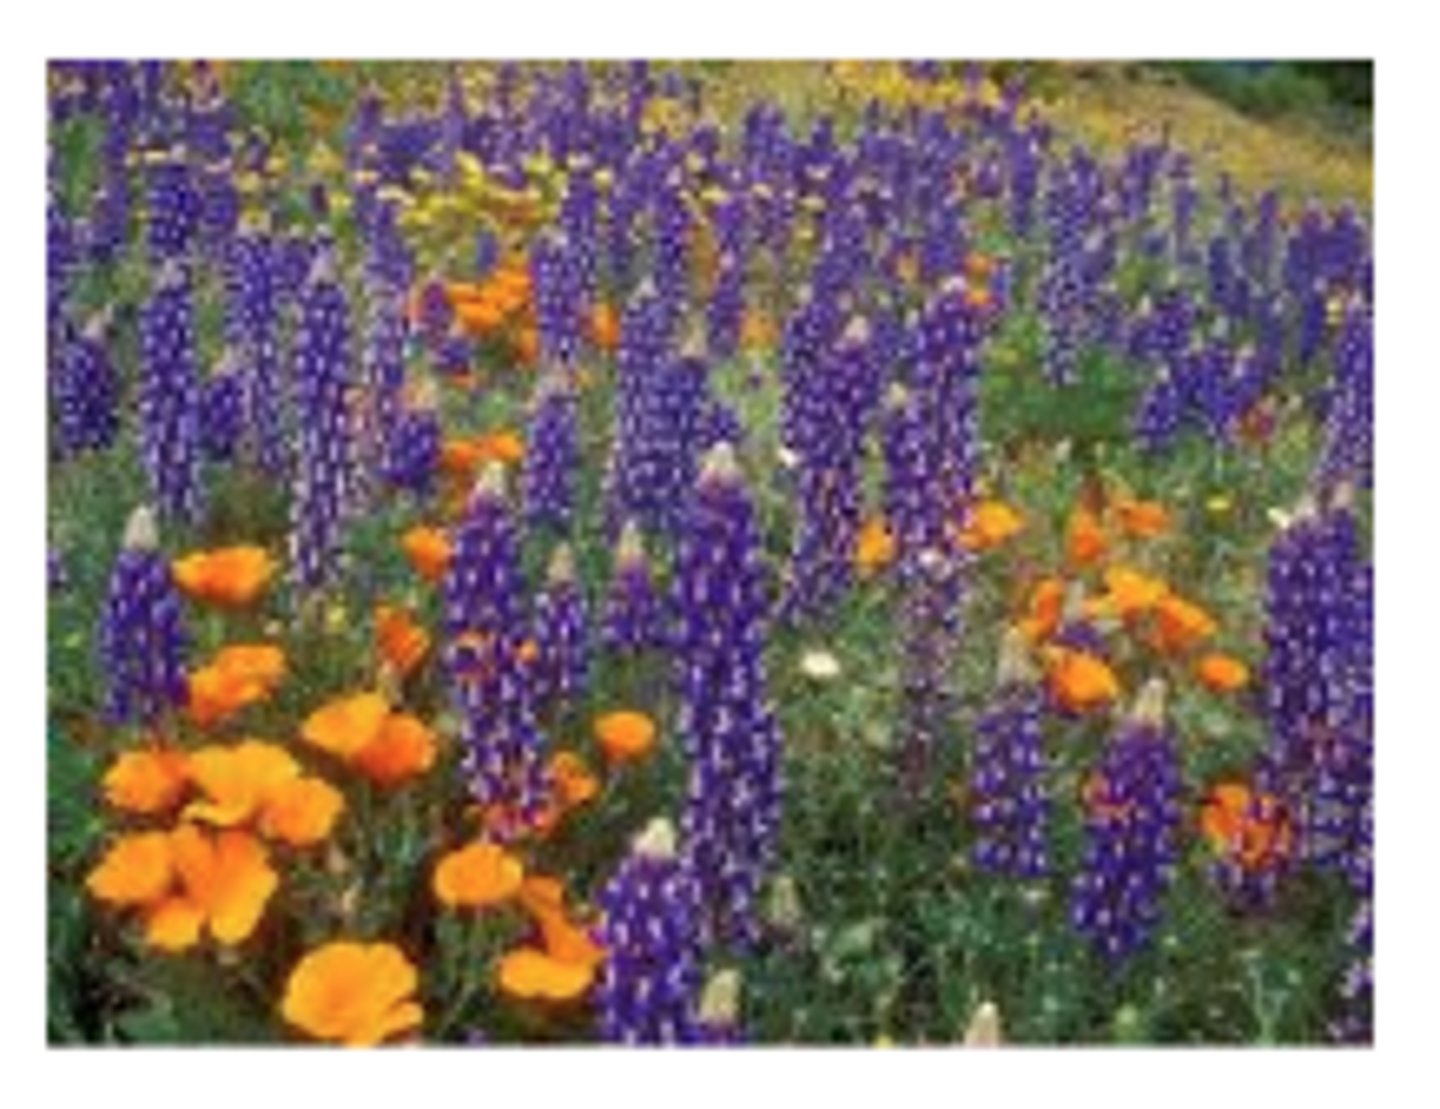
Random Population Distribution
Purple lupine
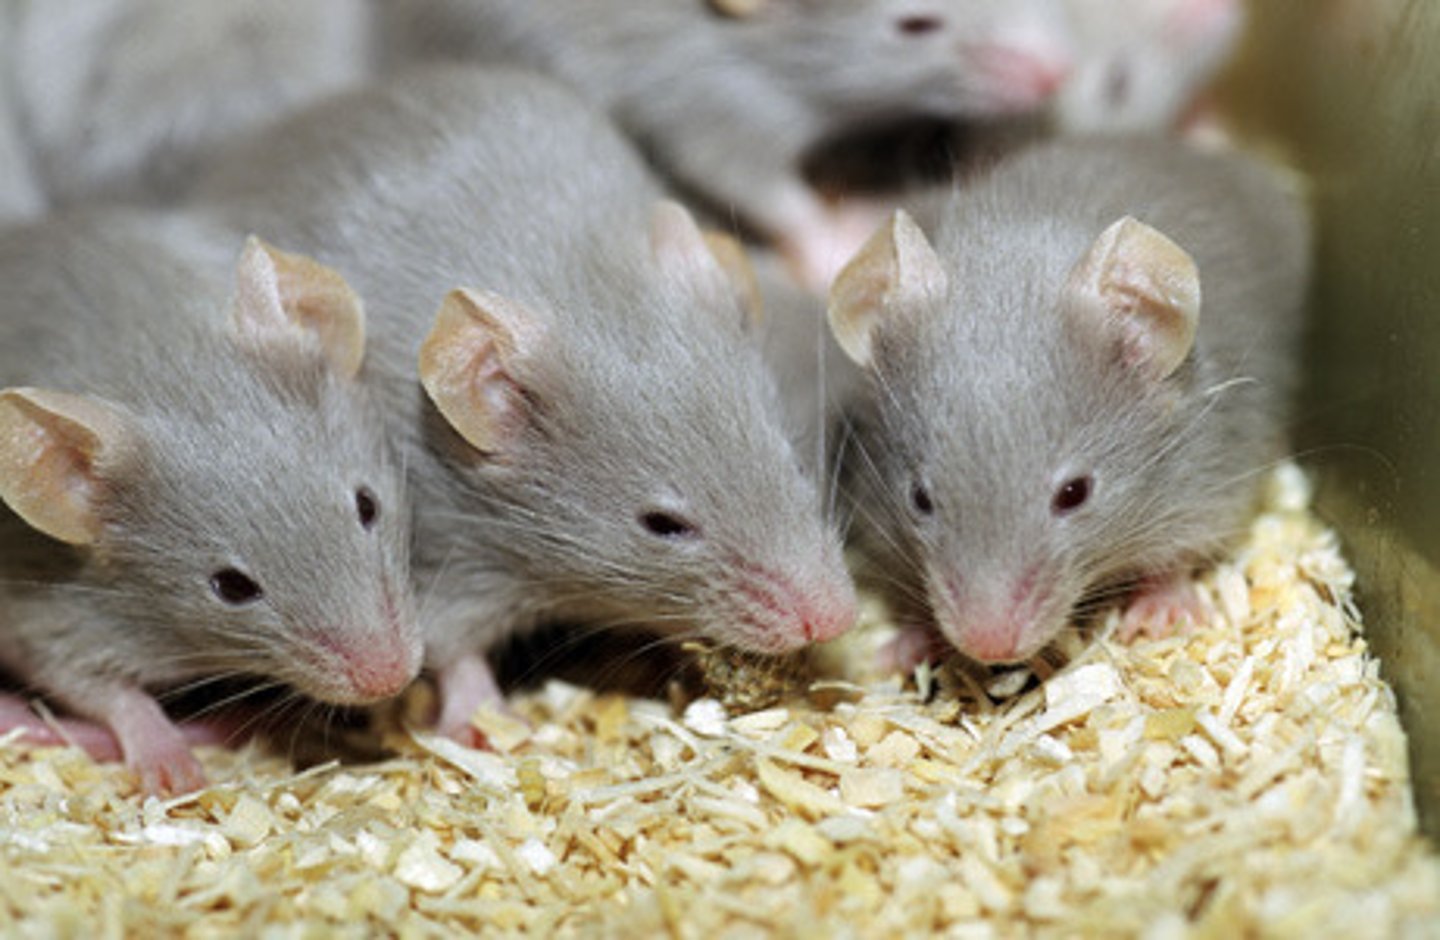
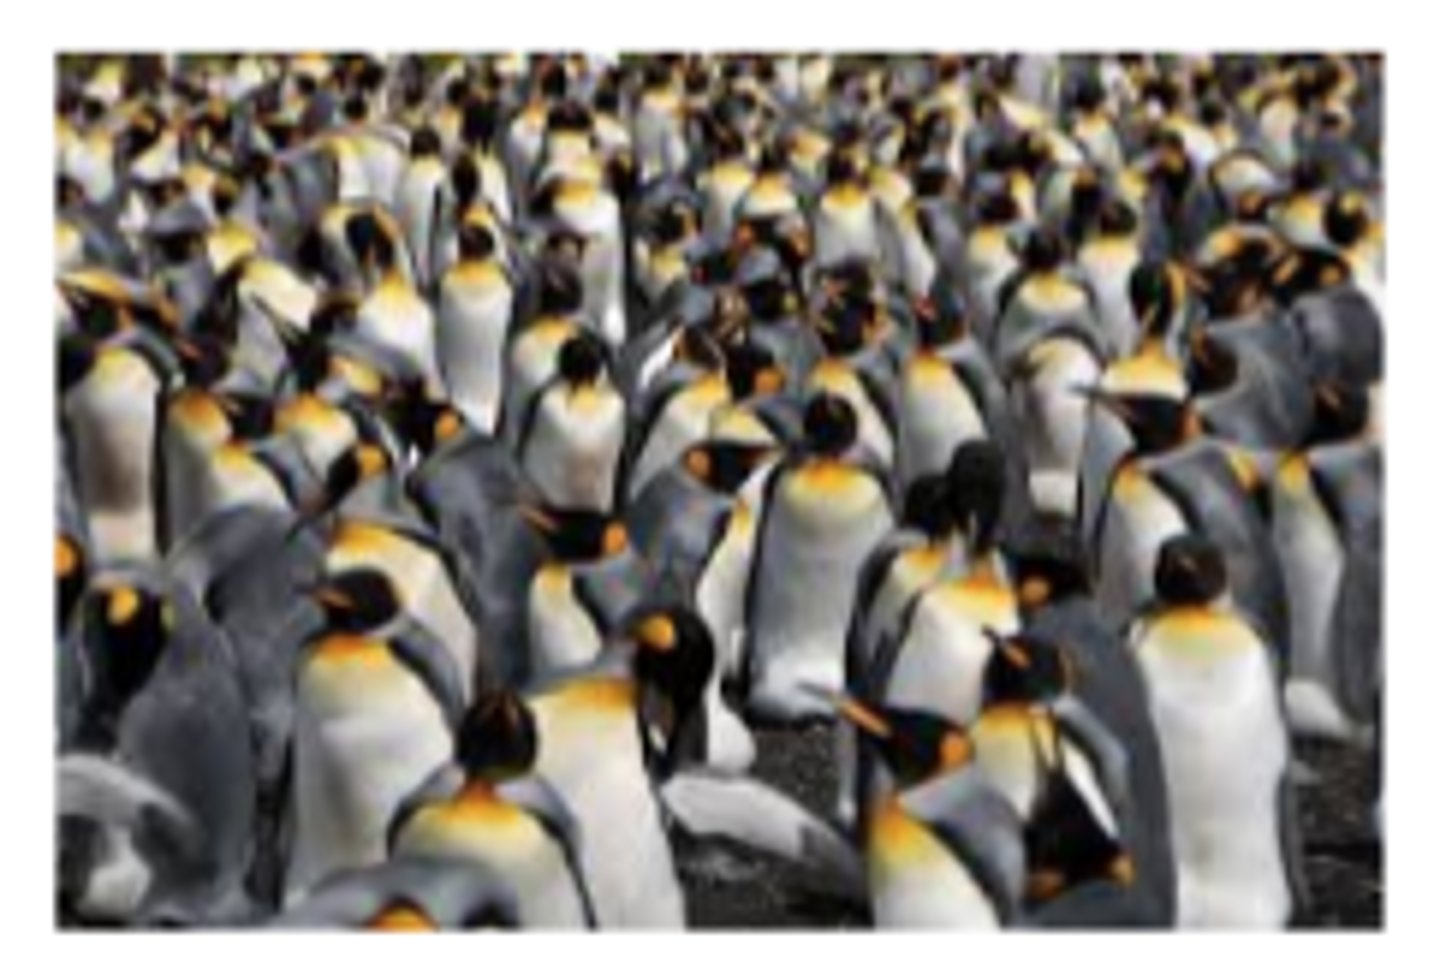
Uniform Population Distribution
Penguins
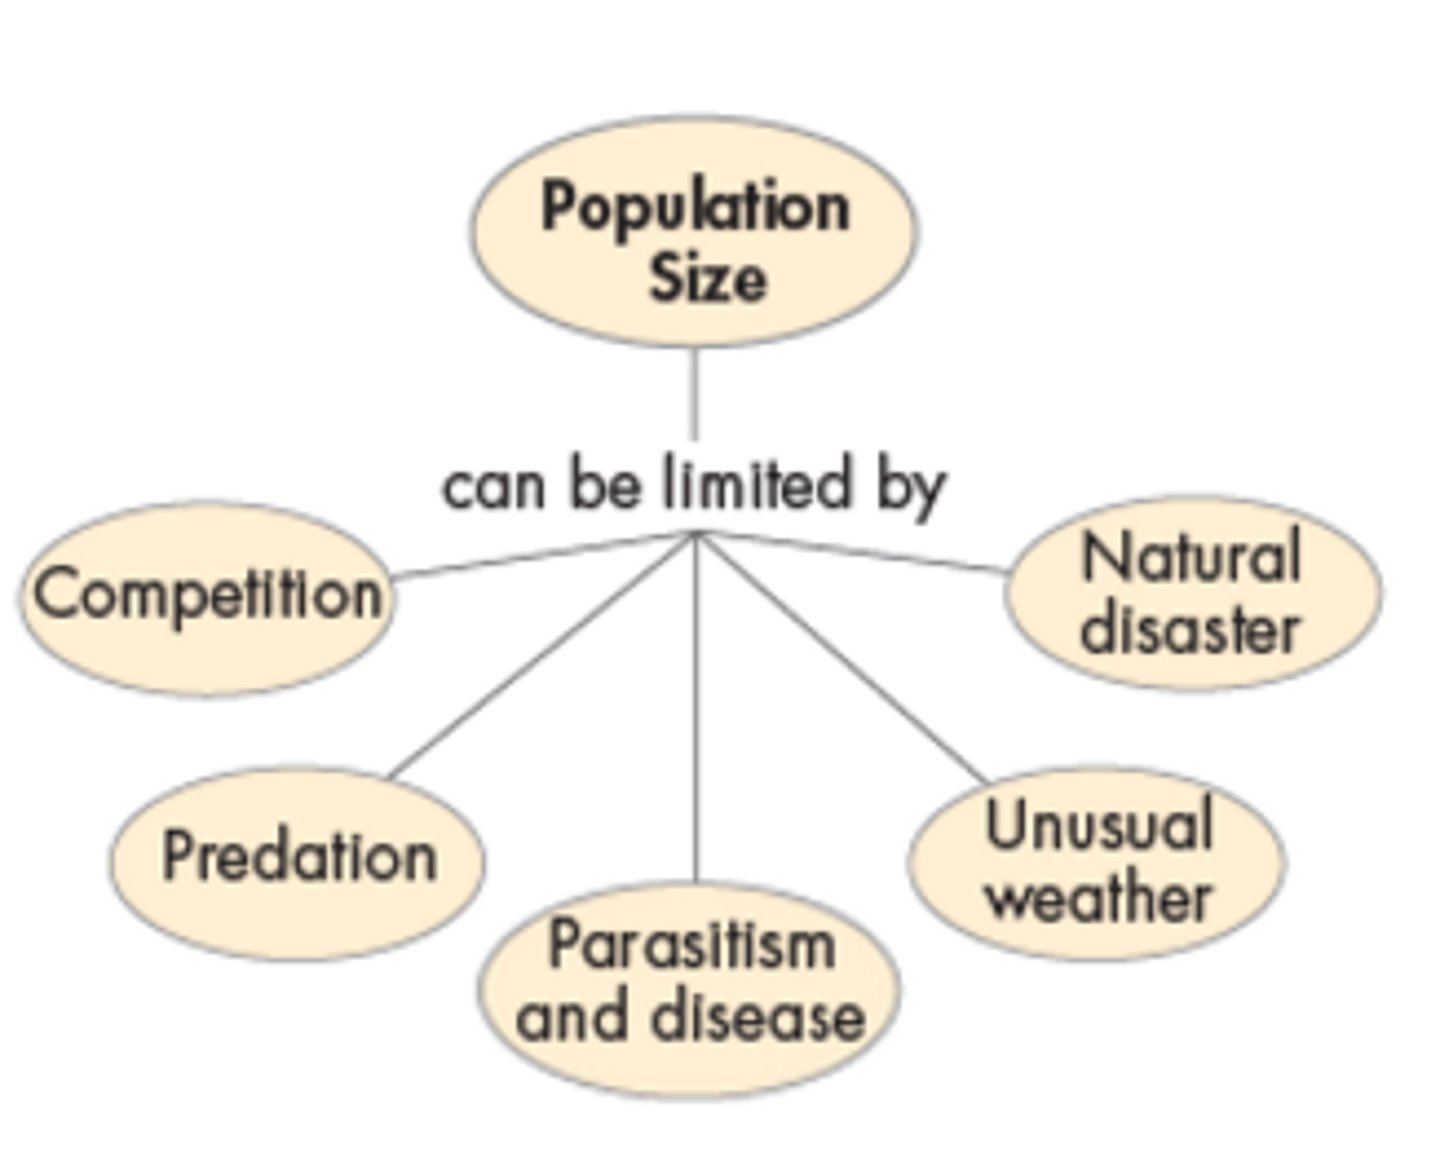
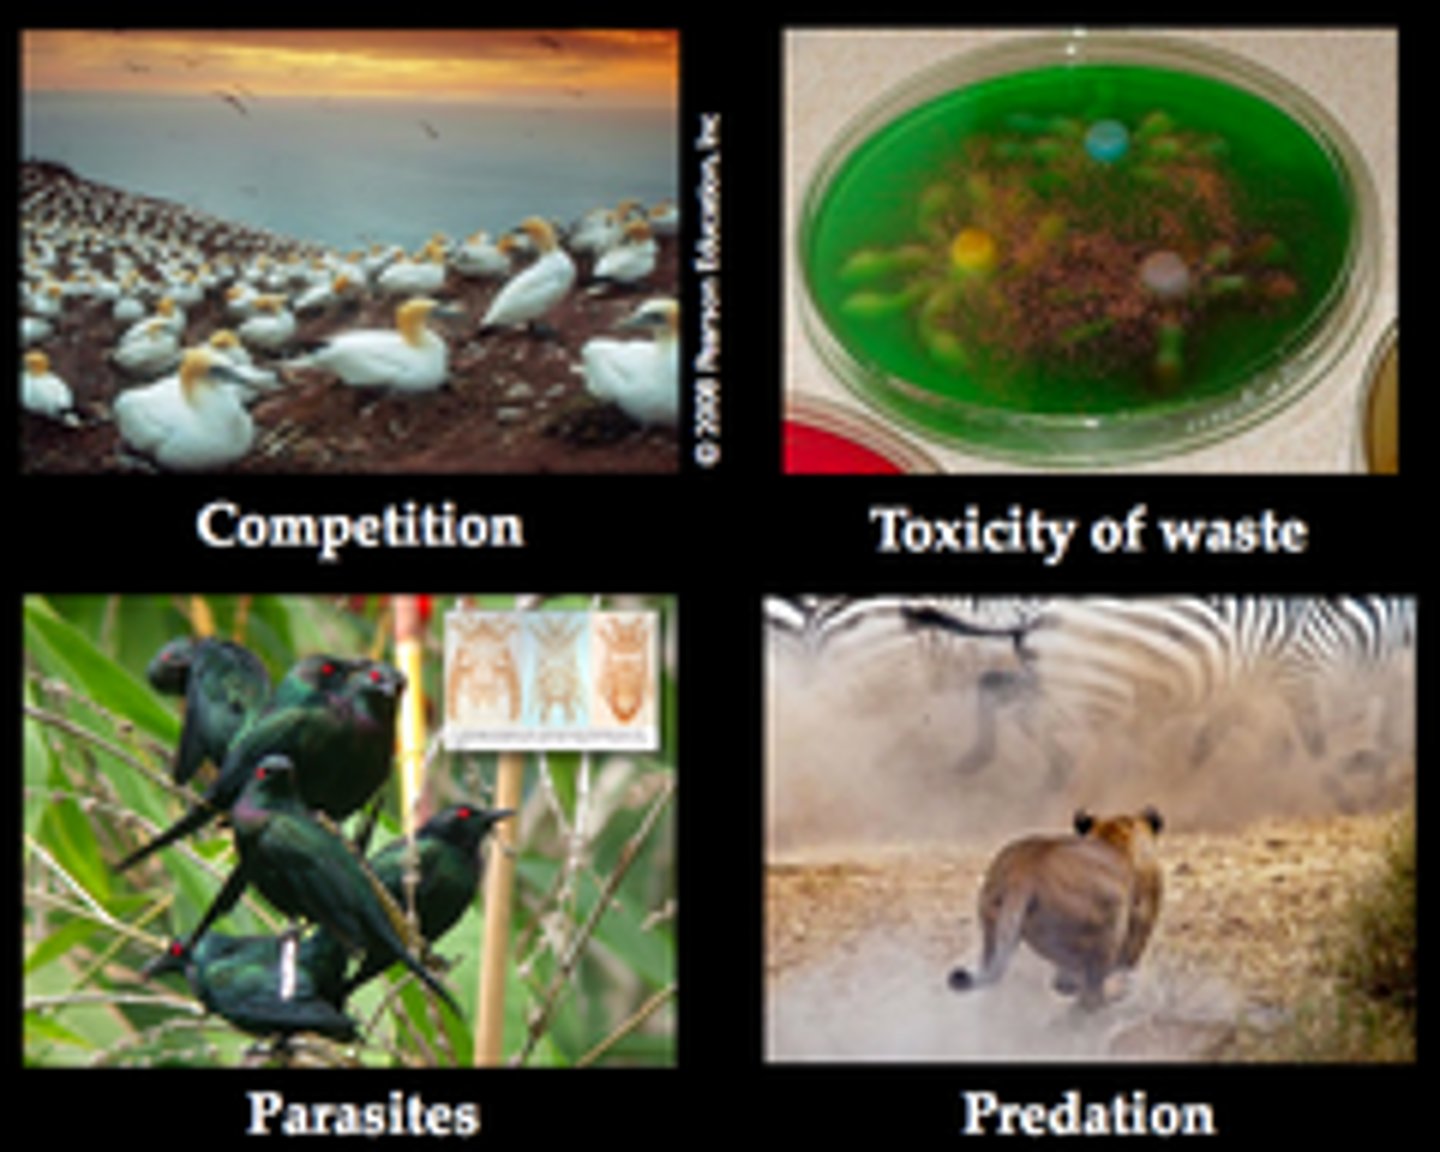
Limiting Factor
A factor that controls the growth of a population.
Examples include: competition, predation, parasitism, and disease
Density-Dependent Limiting Factors
Factors that operate strongly only when population density reaches a certain level. These factors do not affect small, scattered populations as much.
Examples include competition, predation, herbivory, parasitism, disease, and stress from overcrowding.
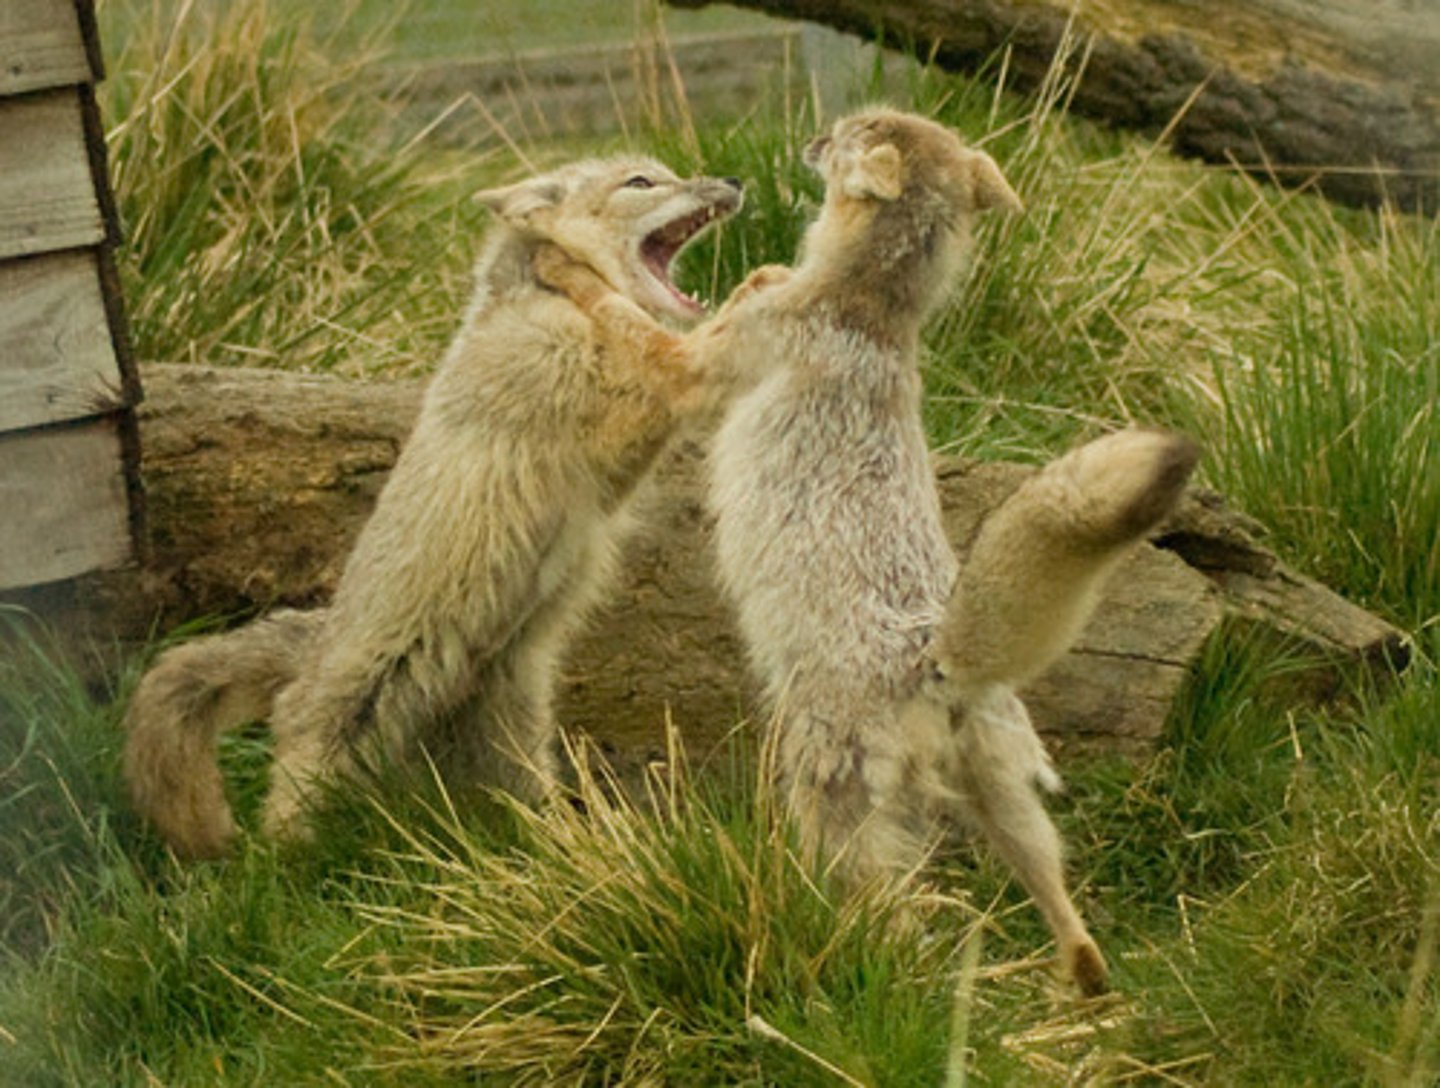
Competition
A density-dependent limiting factor. The more individuals living in an area, the sooner they use up the available resources and the more crowded so individuals compete with other organisms for food, water, space, sunlight, and other essentials.
Intraspecific Competition
Competition that occurs between individuals of the same species. Examples include wolves and songbirds that compete for territory.
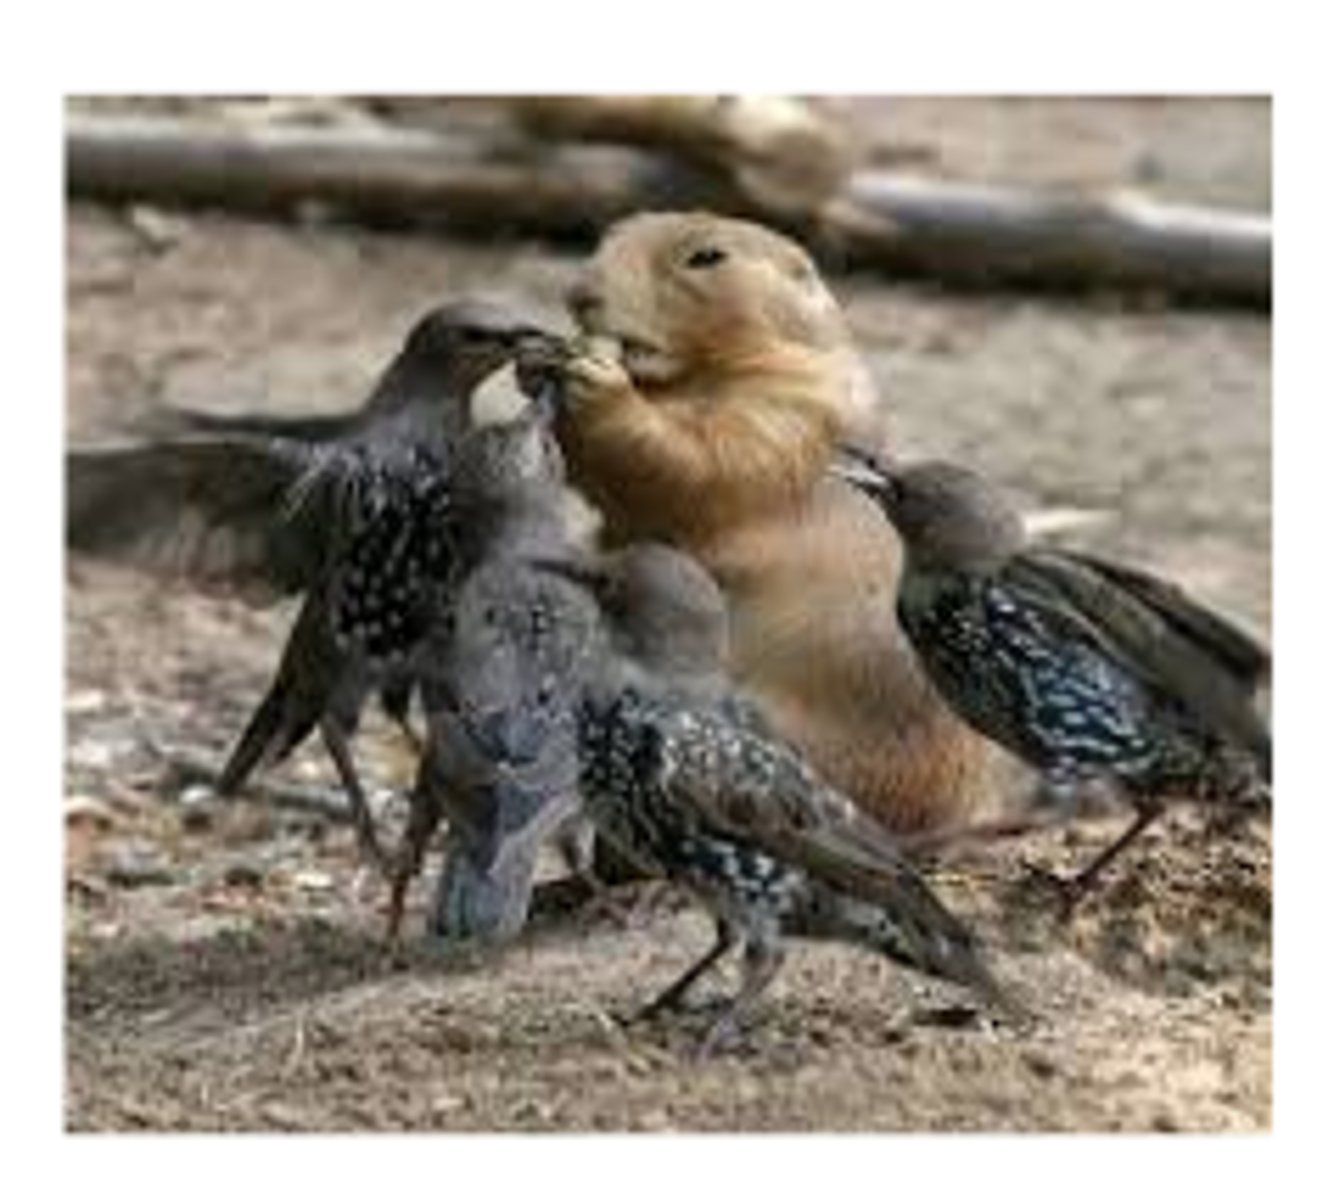
Interspecific competition
Occurs between members of different species that attempt to use similar or overlapping resources. A major force behind evolutionary change.
Top-Down Regulation
A type of population regulation in which the predators control the size of the population of individuals.
Bottom-up Regulation
A type of population regulation in which the resources (water, food, habitat, mates) control the size of the population of individuals.
Parasites and Disease Causing Organisms
Feed at the expense of their hosts, weakening them and often causing disease or death.
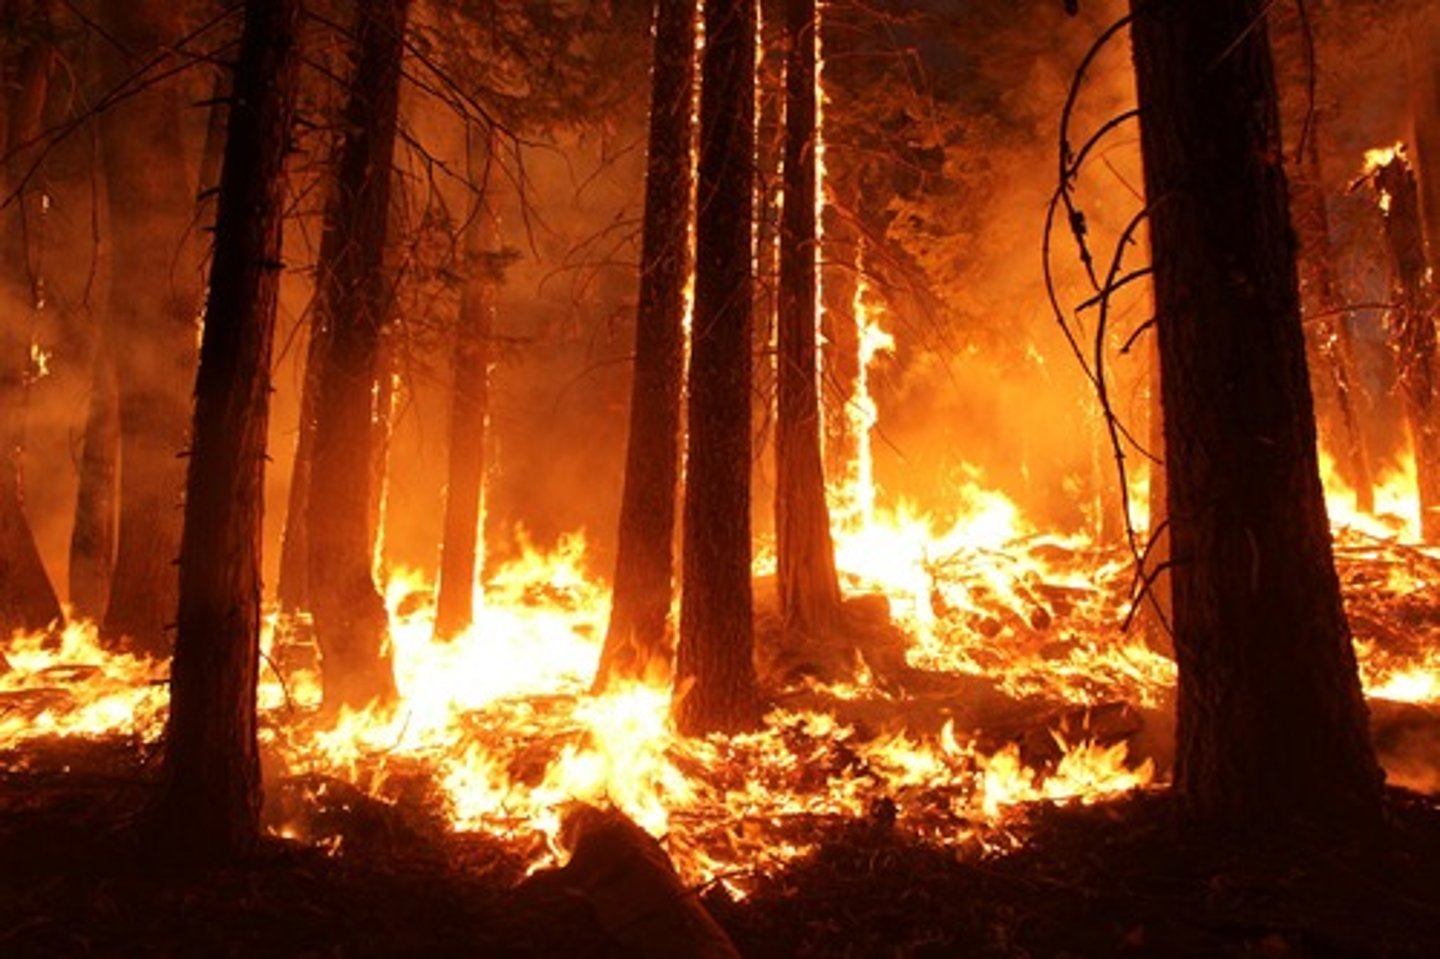
Density- Independent Factors
Factors that are NOT affected by population density. These factors affect all members of the population the same. Examples include: unusual weather, natural disasters, and certain human activities such as damming of rivers and clear-cutting forests.
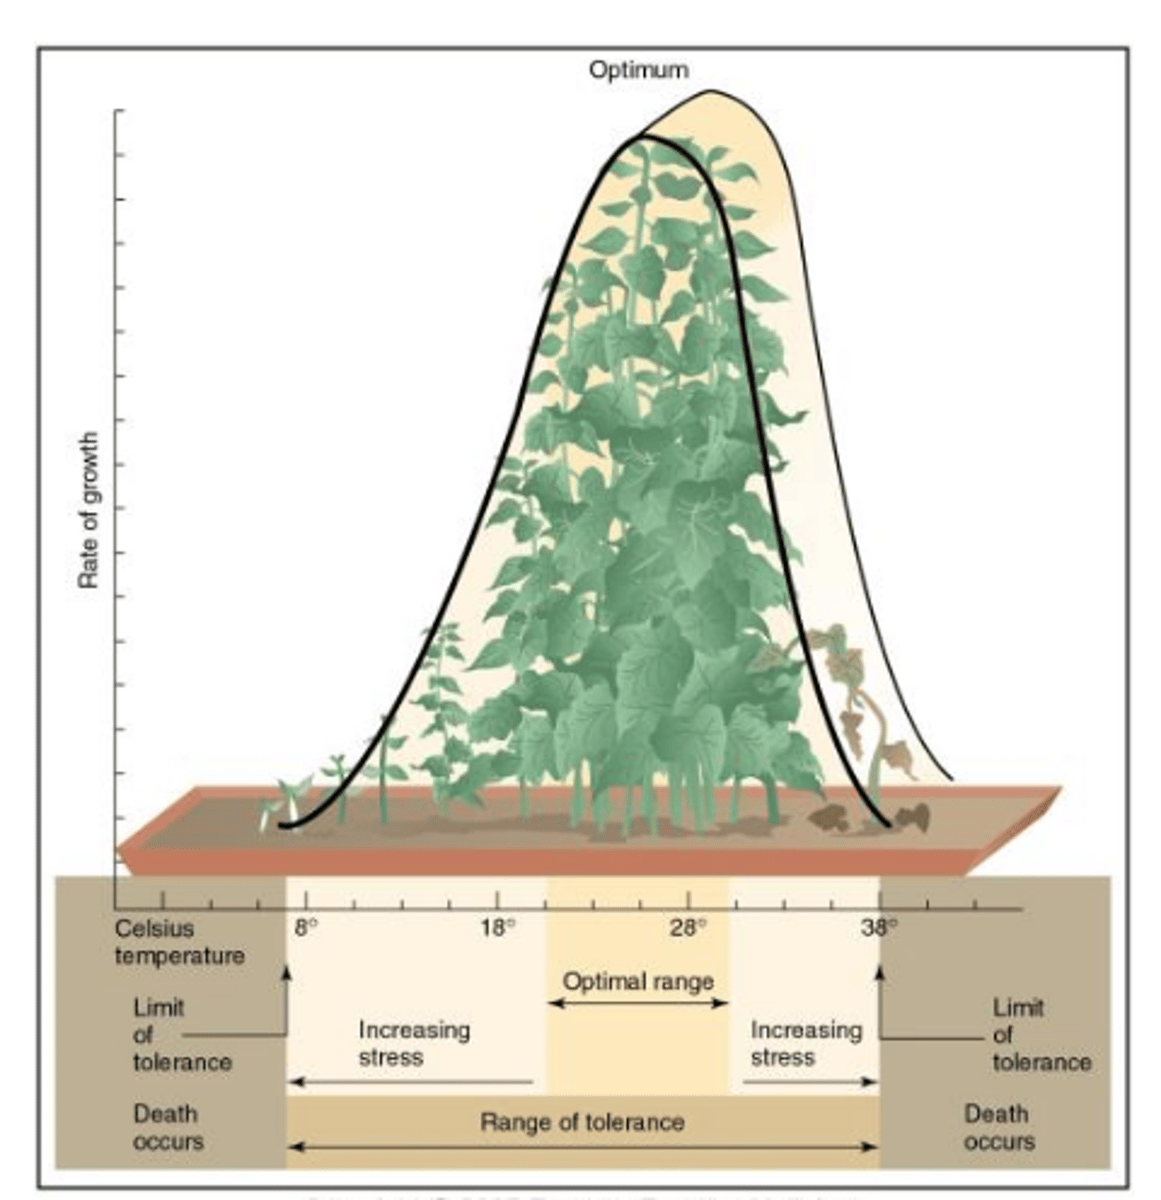
Range of tolerance
The range of conditions in which an organism can survive.
Habitat
The general place where an organism lives.
Law of Limiting Factors
States that too much or too little of any abiotic factor can limit or prevent growth of a population of a species in an ecosystem. Any abiotic factor outside the range of tolerance over time can result in death.
Examples of Abiotic Factors:
-Terrestrial
-Temperature
-Water/Moisture
-Soil
-pH
-Salinity
-Temperature
-Sunlight
-Dissolved Oxygen
Herbivory
Interaction in which one animal (the herbivore) feeds on producers (such as plants).
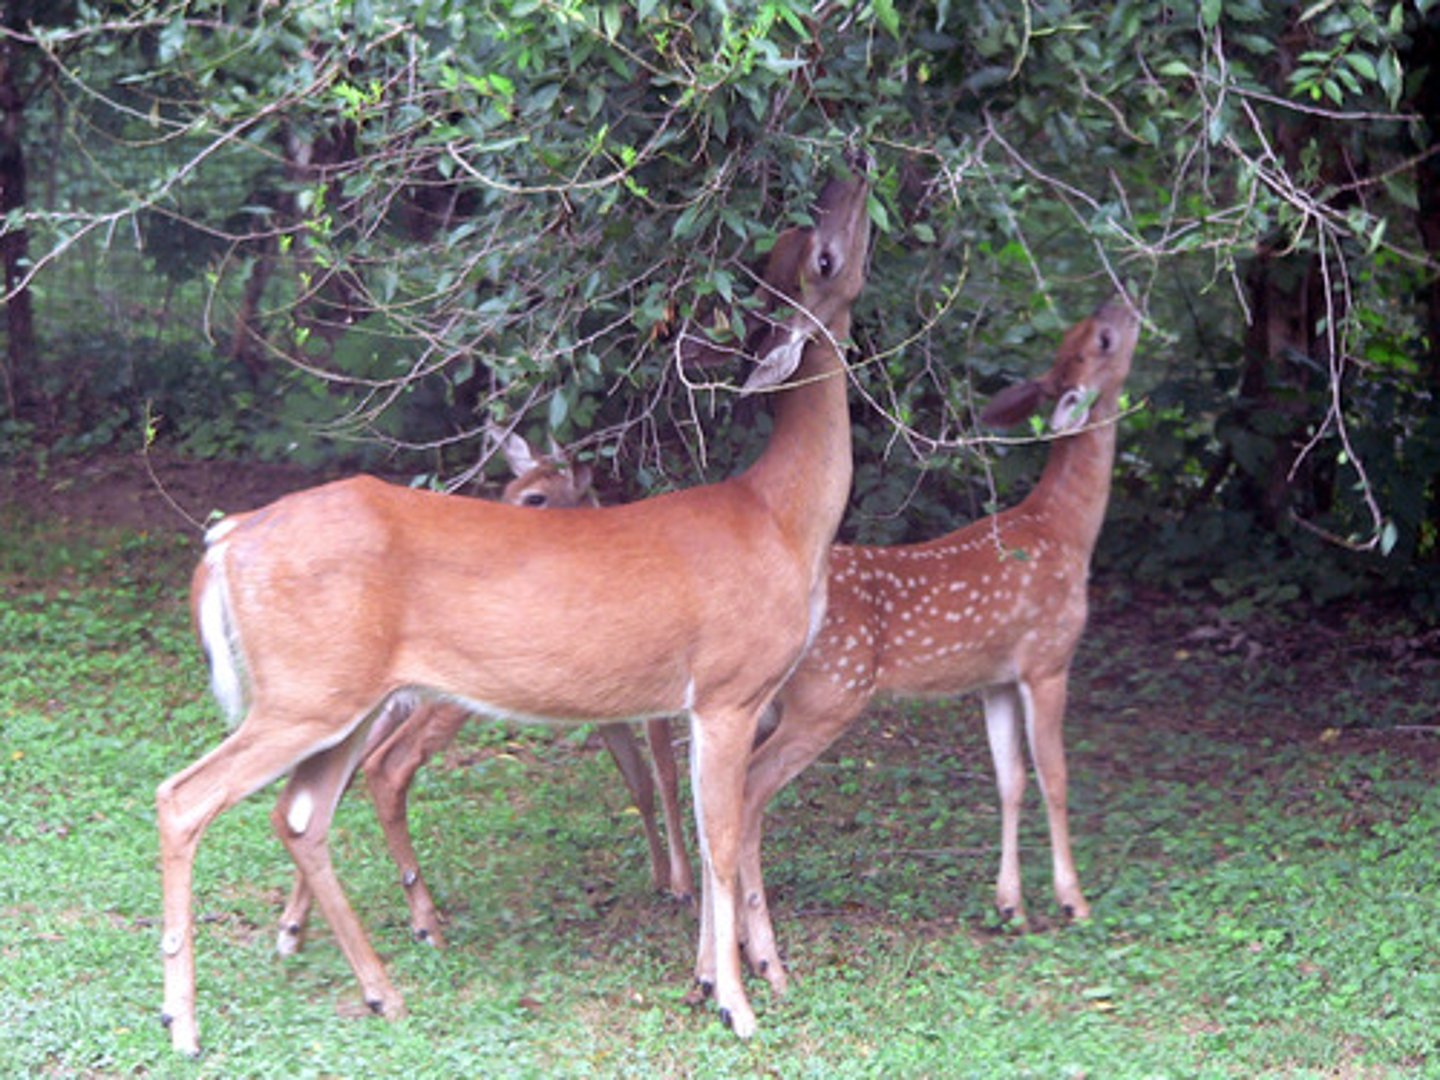
Overgrazing
Occurs when herbivores have no predators so populations of herbivores grow exponential and end up eating all of the producers within a specific area.
Limit of tolerance
The outside limits of a range of tolerance that an organism can survive.
Optimal range of growth
The ideal conditions in which an organism can live.
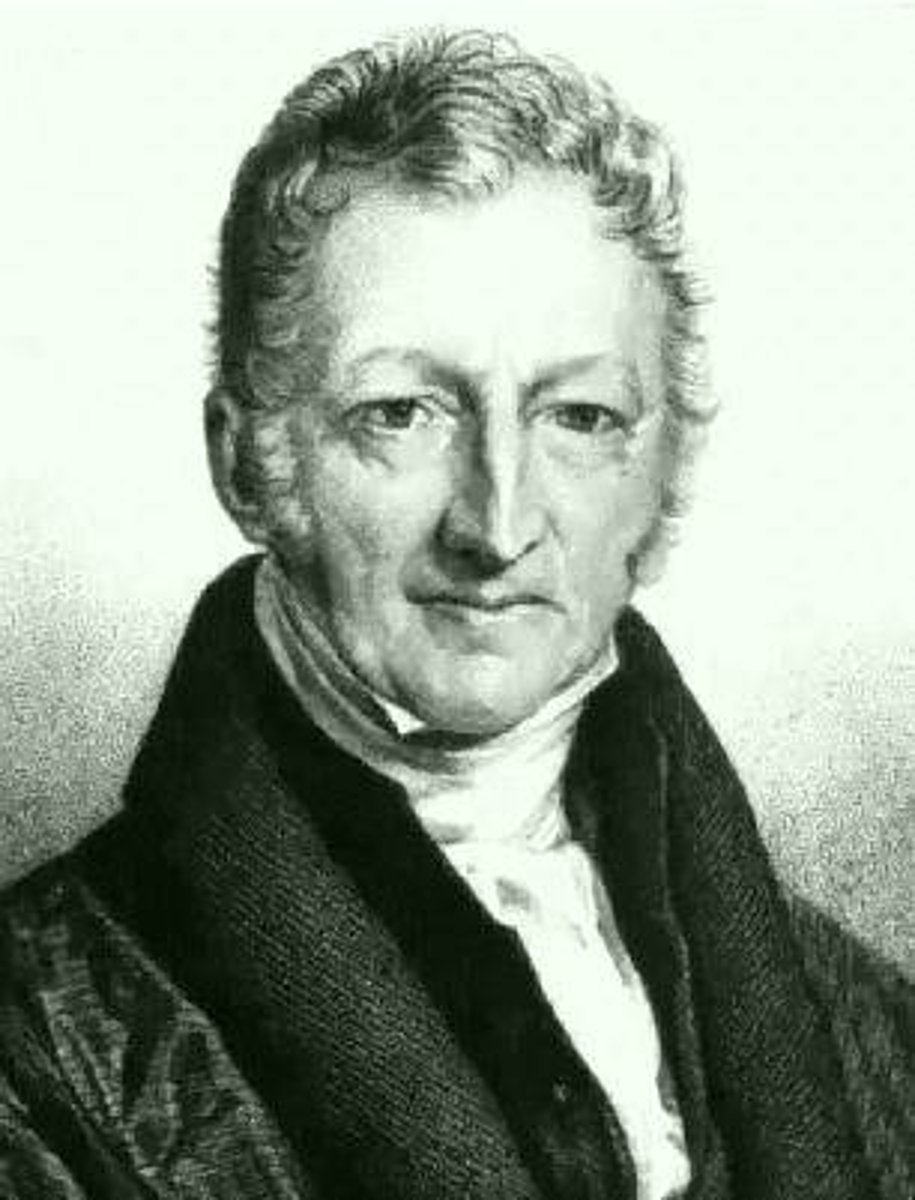
Thomas Malthus
English Economist who believed that only war, famine, and disease could limit human population growth.
He also thought that human populations would be regulated by competition (war), limiting resources (famine), parasitism (disease), and other density-dependent factors.
Demography
The scientific study of human populations that examines characteristics of human populations and attempts to explain how those populations will change over time.
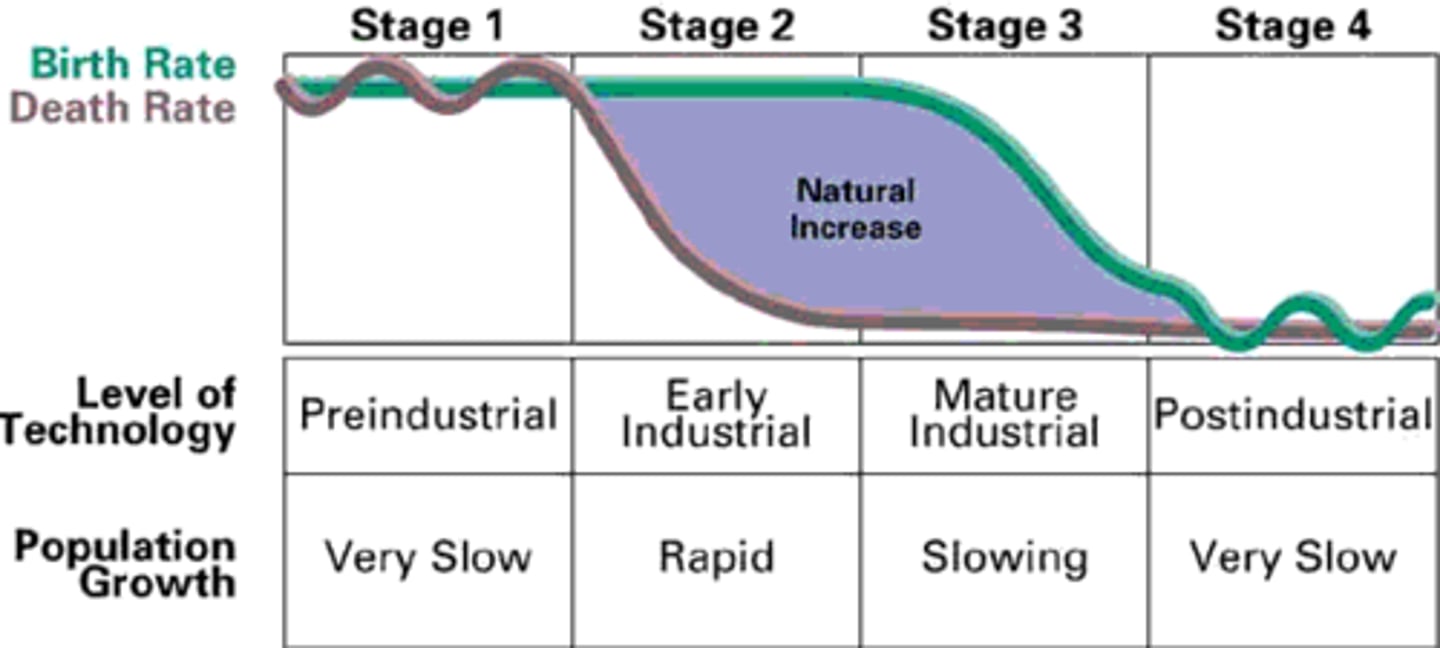
Demographic Transition
A dramatic change in a society's population from high birthrates and death rates to low birthrates and death rates.
Developed Countries
Countries that:
- Have low fertility rates
- Makeup 16% of world's population
- Use 80% of world's wealth
- Have 10-15% of the population in poverty
- Eat high on the food chain
- Fertility Rate < 2
- Negatively impact the environment due to affluence and technology
- Have a high % of older people
Developing Countries
Countries that:
- Have High fertility rates
- Makeup 84% of world's population
- Use 20% of world's wealth
- Have 45 % of population in poverty
- Have a large number of people that are malnourished
- Have a Fertility rate > 2
- Negatively impact the environment due to large population size
- Have a high % of younger people

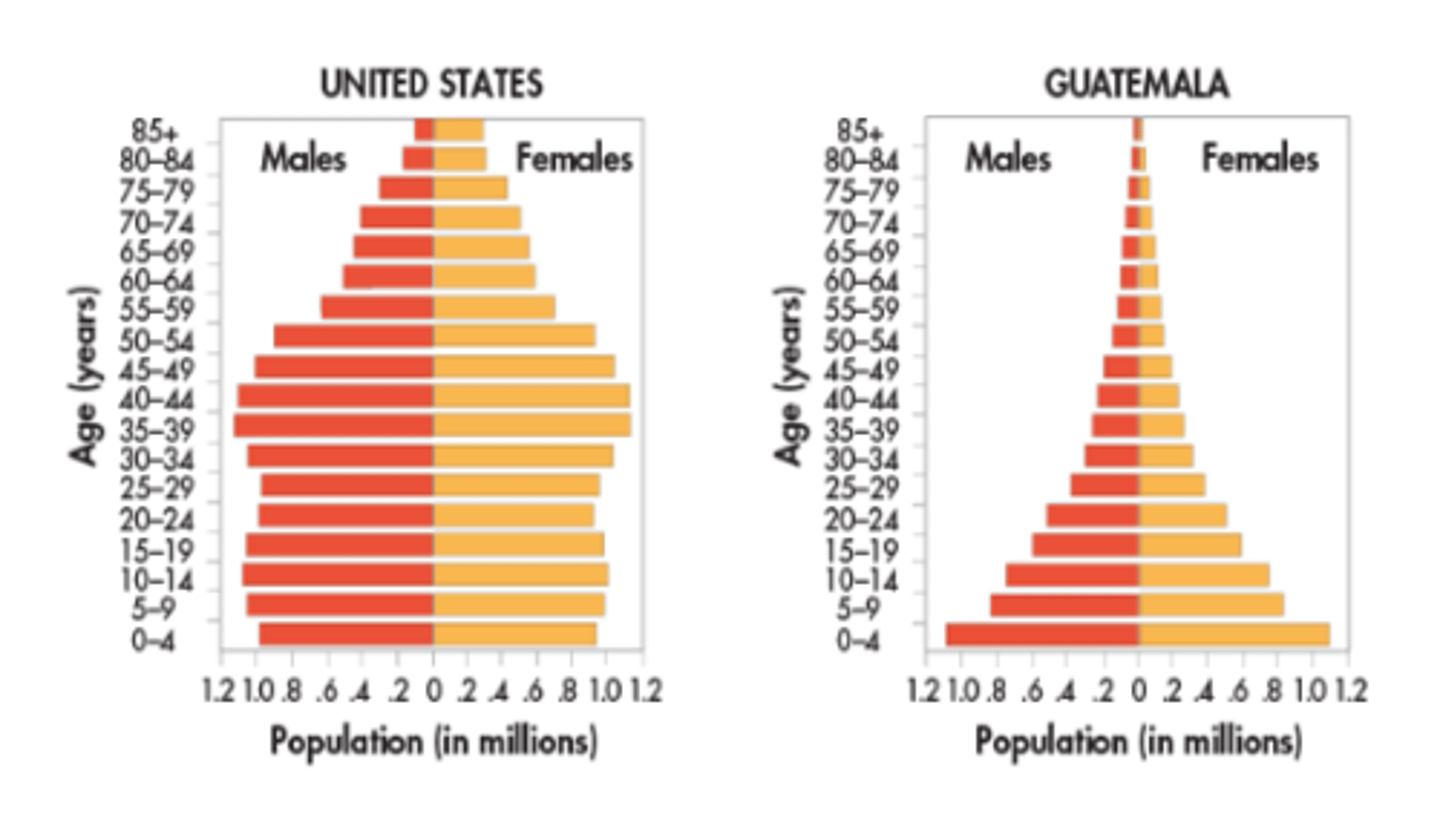
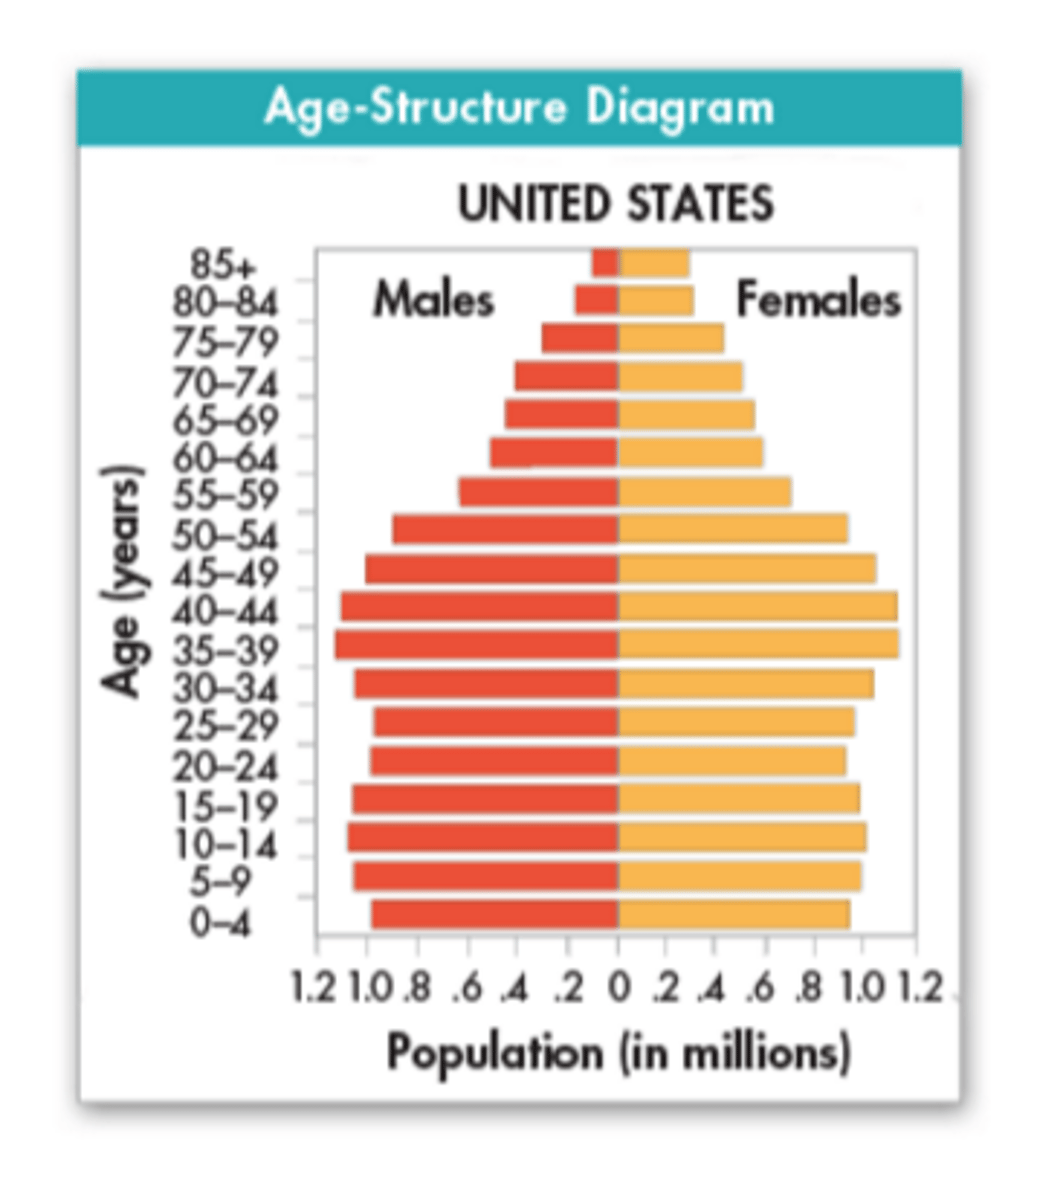
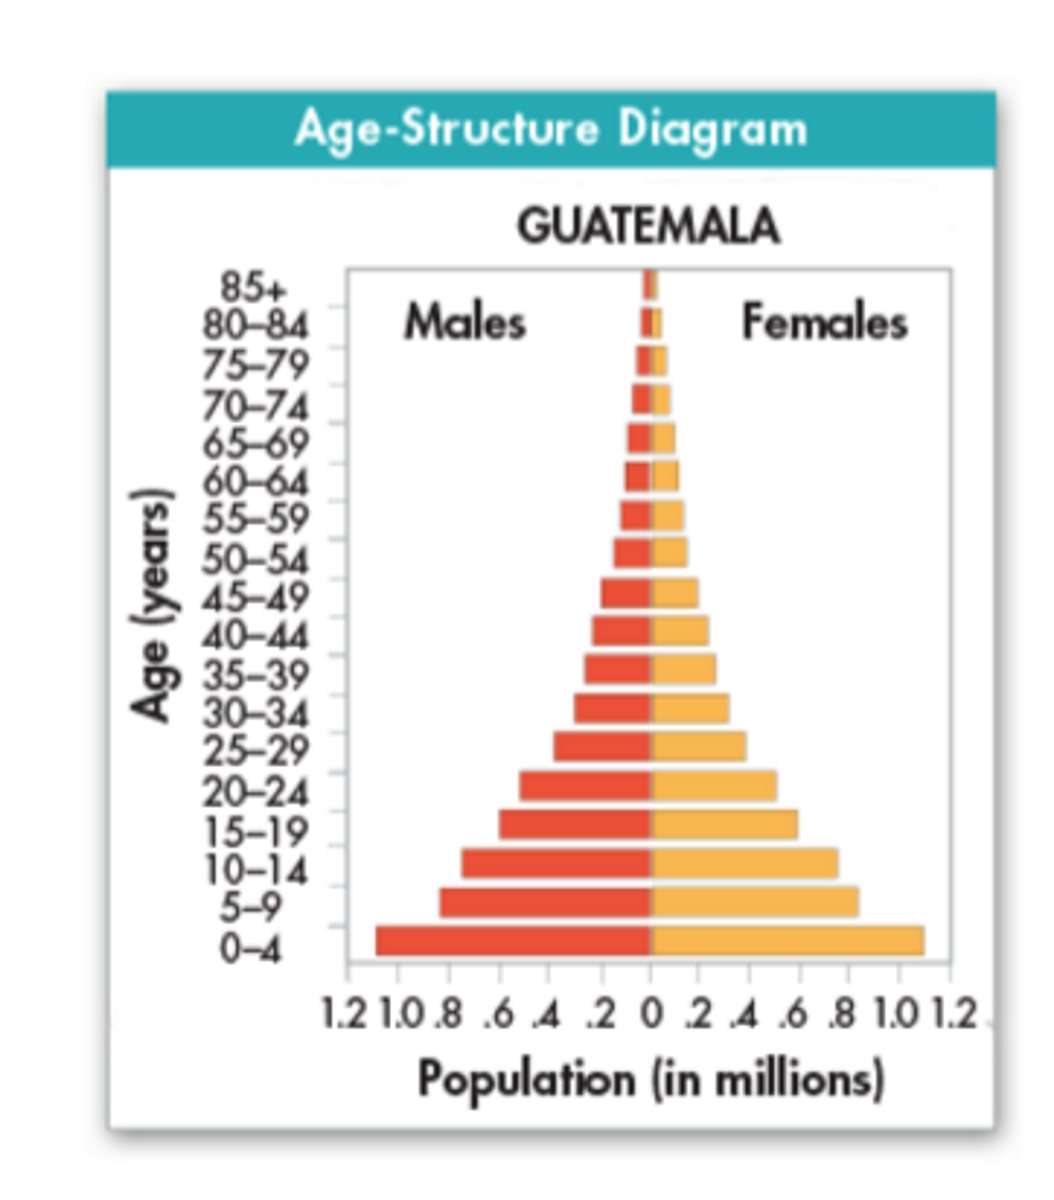
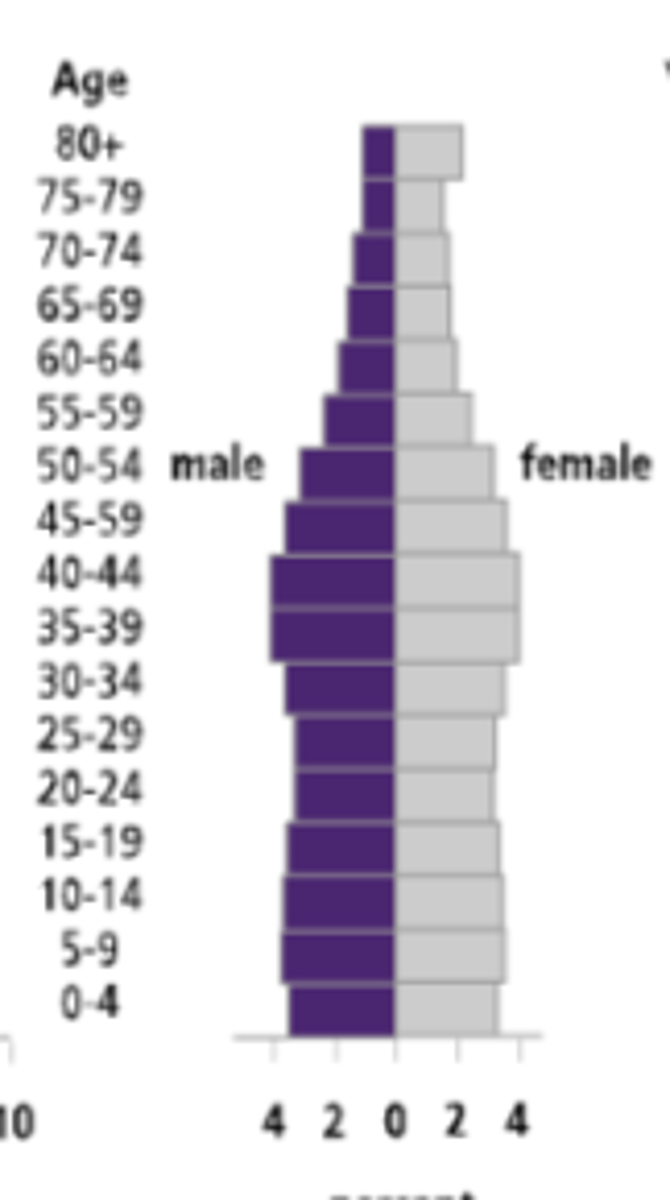
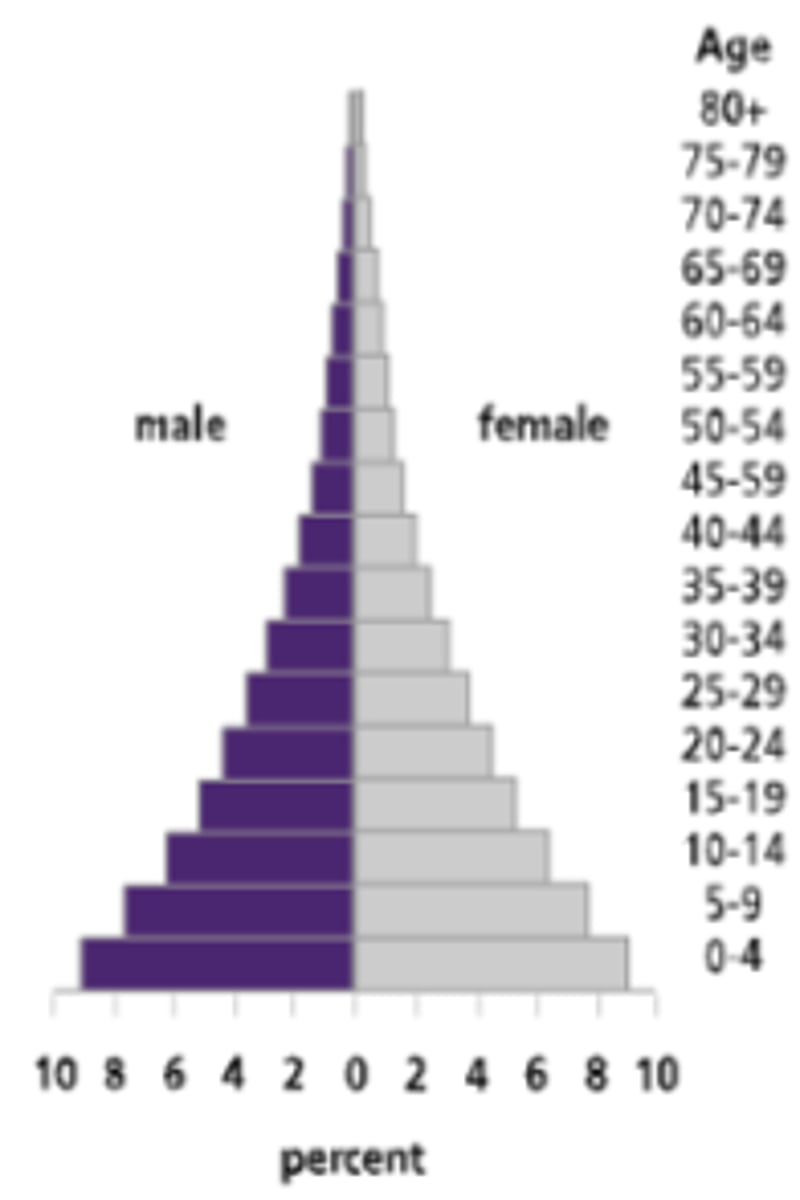
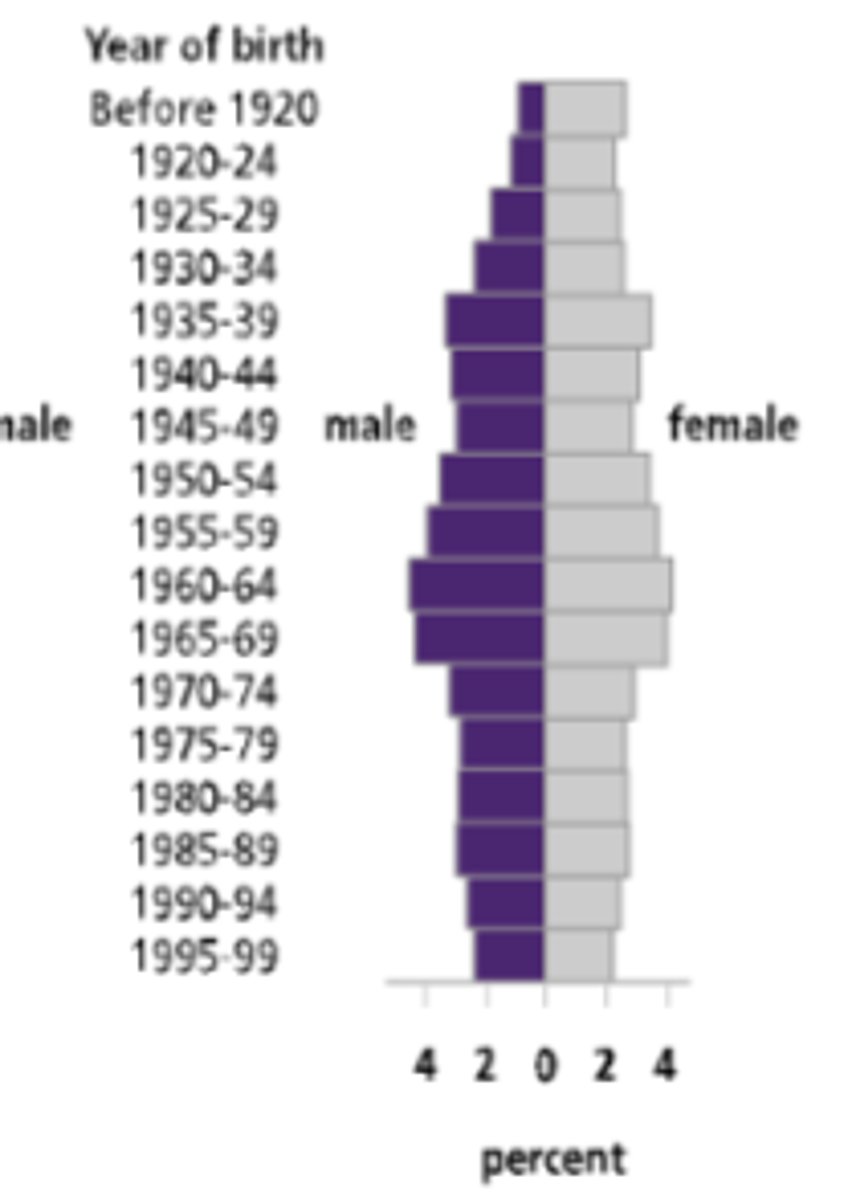
Age- Structure Diagrams
Diagrams that show the population of a country broken down by gender and age group. Used by demographers to predict needs.
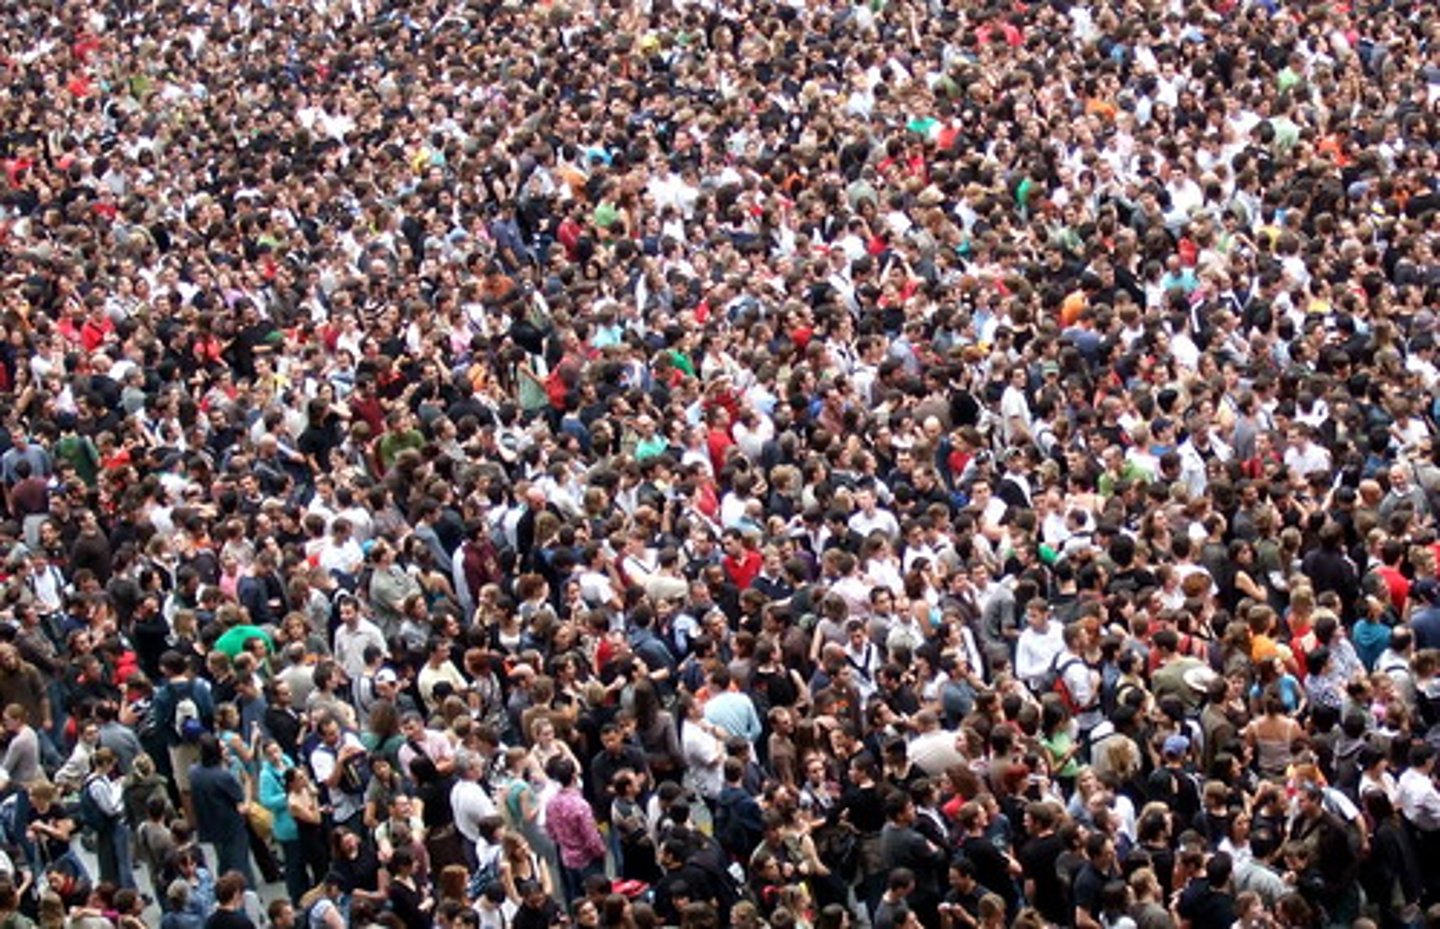
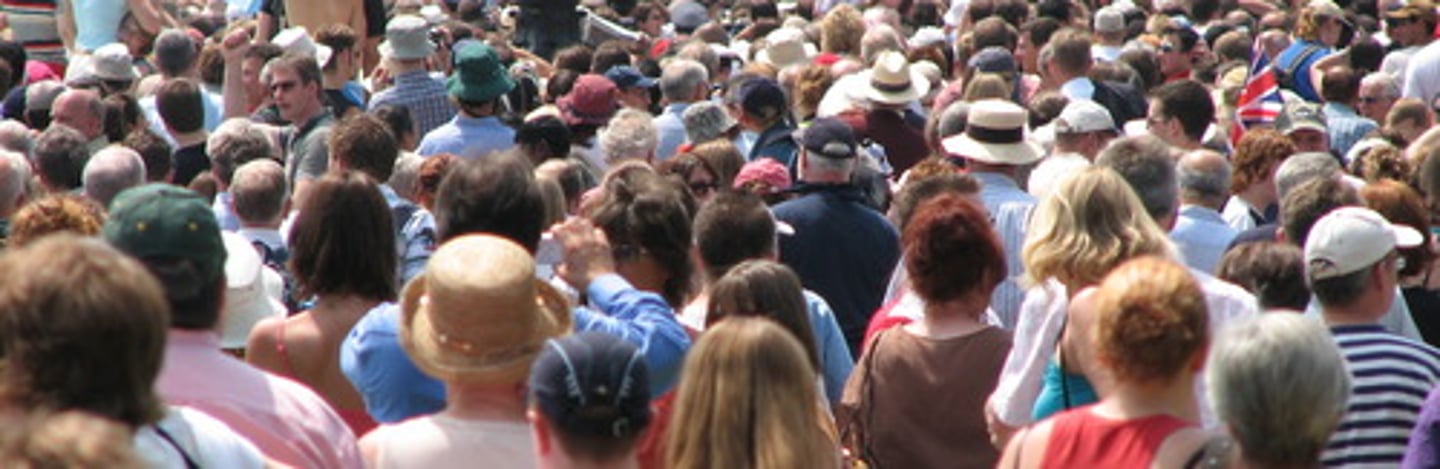
Consequences of Large Population
Deforestation, loss of agriculture, resource depletion, less biodiversity, more pollution
Factors that controlled early human population growth
Food was hard to find. Predators and diseases were common and life-threatening.
Factors that contributed to decreased human death rates
Improved nutrition, sanitation, medicine, and healthcare.
Stage I of the Demographic Transition
Birth rates and death rates are both high. In the U.S. this stage occurred prior to the industrial revolution.
Stage II of the Demographic Transition
Advances in nutrition, sanitation, and medicine lead to lower death rates. Birthrates remain high for a time, so births greatly exceed deaths and the population increases exponentially.
Stage III of the Demographic Transition
As the level of education and living standards rise, families have fewer children and the birthrate falls; population growth slows.
Demographic Transition is Complete
Birthrate meets the death rate, and population growth stops.
Countries where demographic transition is complete
United States, Europe and Japan
Countries that have completed Stage II of the demographic transition
Parts of South America, Africa, and Asia
Countries that are still in Stage I of the demographic transition and lead in population growth
India and China
This age structure diagram predicts a slow but steady growth rate for the near future. Typical of an age-structure diagram for the United States.
Population pyramid
Another name for an age-structure diagram.
This age structure diagram predicts a population that will double in about 30 years because there are many more young children than teenages, and many more teenages than adults. Typical of an age-structure diagram for Guatemala and other developing countries.
Age-Sex Diagram that represents SLOW population growth.
Age-Sex Diagram that represents RAPID population growth.
Age-Sex Diagram that represents NEGATIVE population growth.
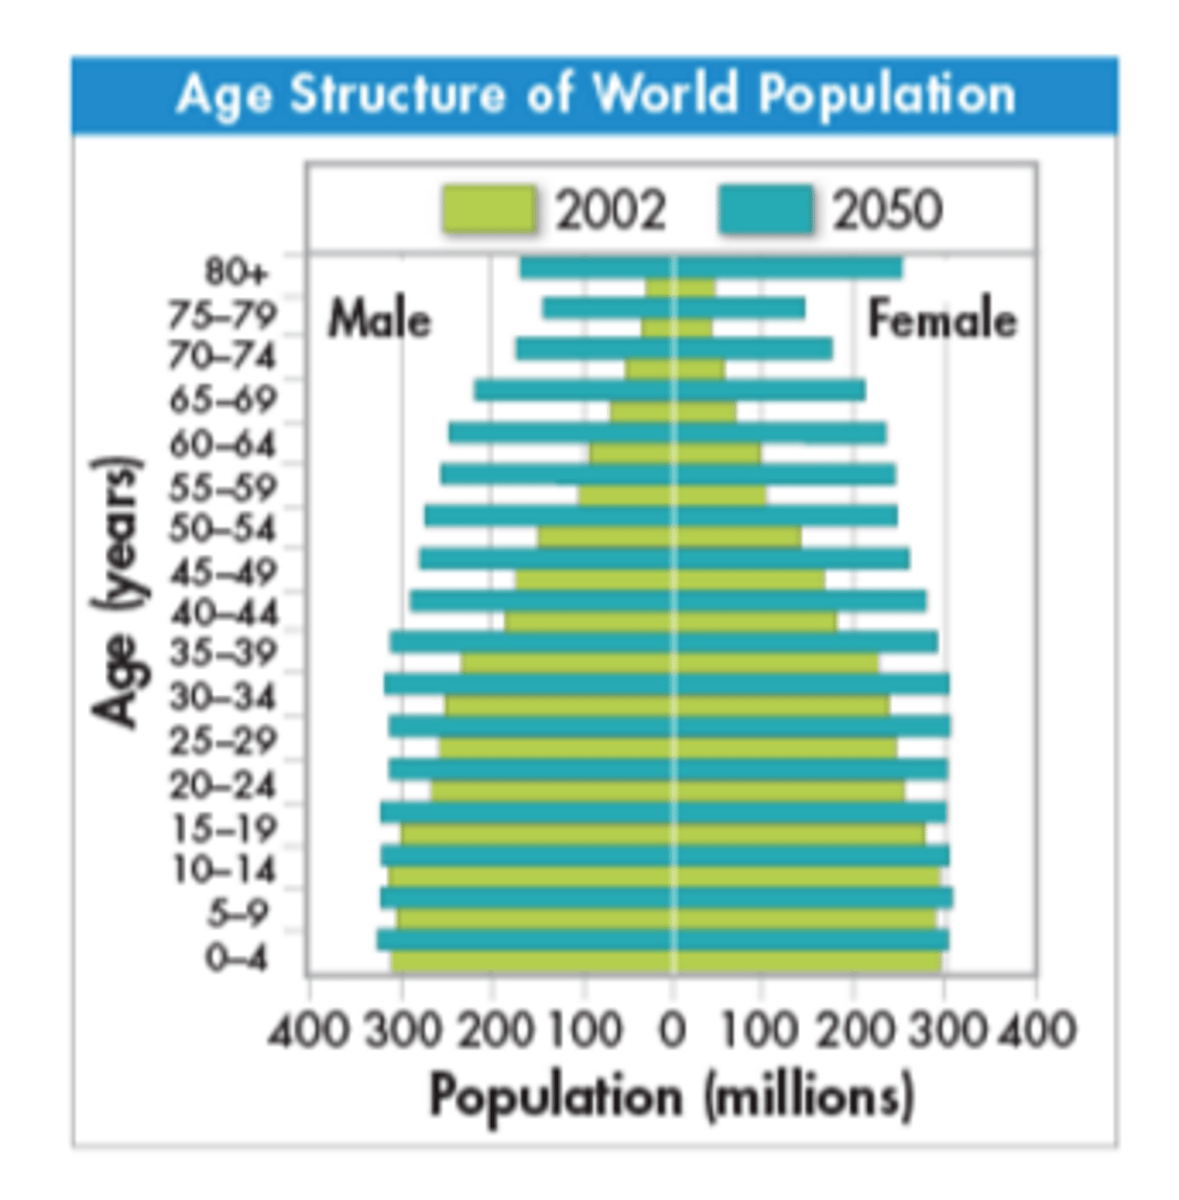
Future Population Growth
Current data suggest that global human population will grow more slowly over the next 50 years than it grew over the last 50 years. Because the growth rate will still be higher than zero in 2050, our population will continue to grow.
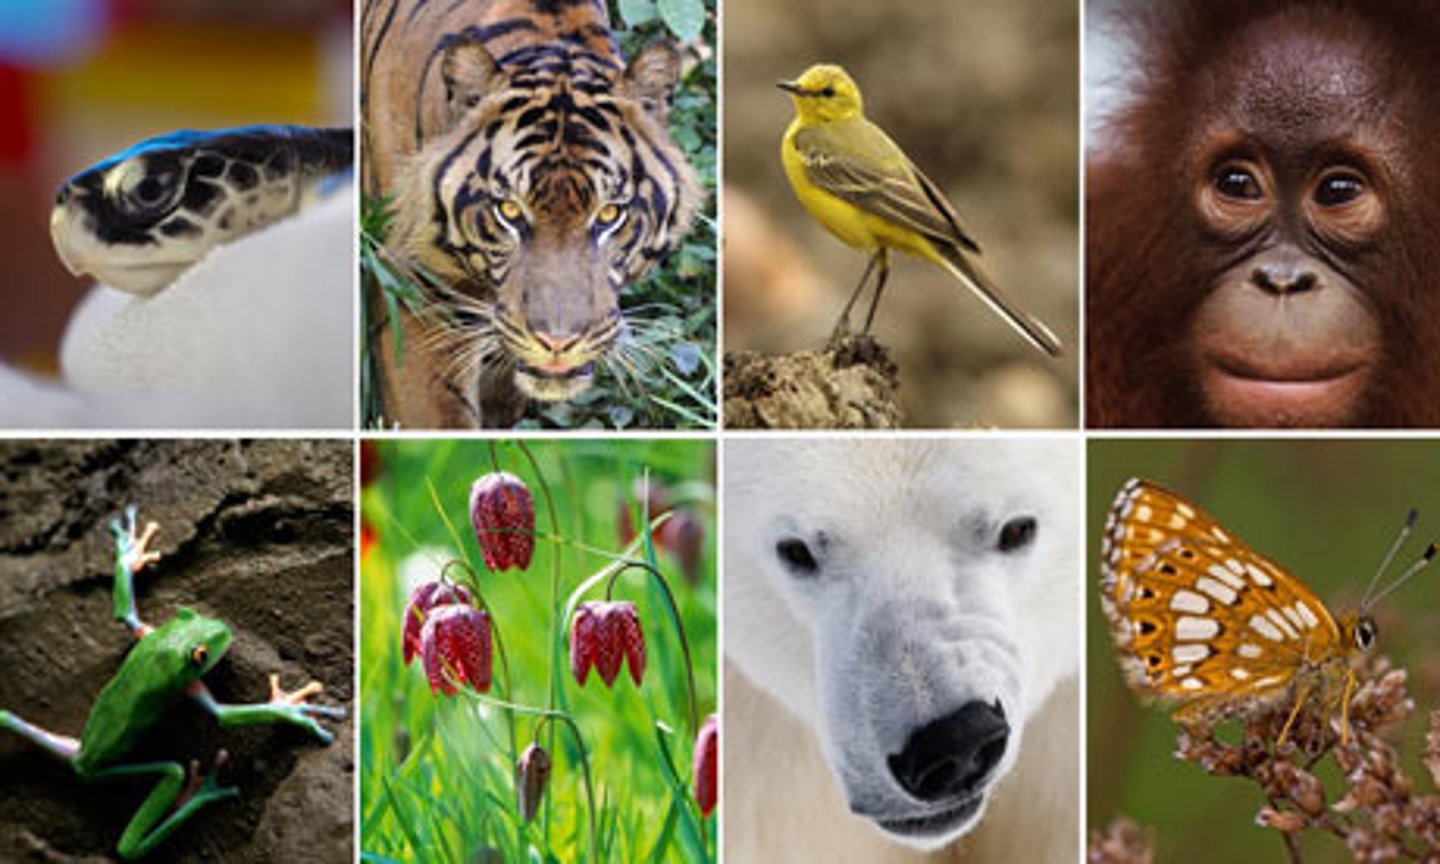
Biodiversity
The total of all the genetically based variation in all organisms in the biosphere. Three types include: ecosystem, species, and genetic diversity
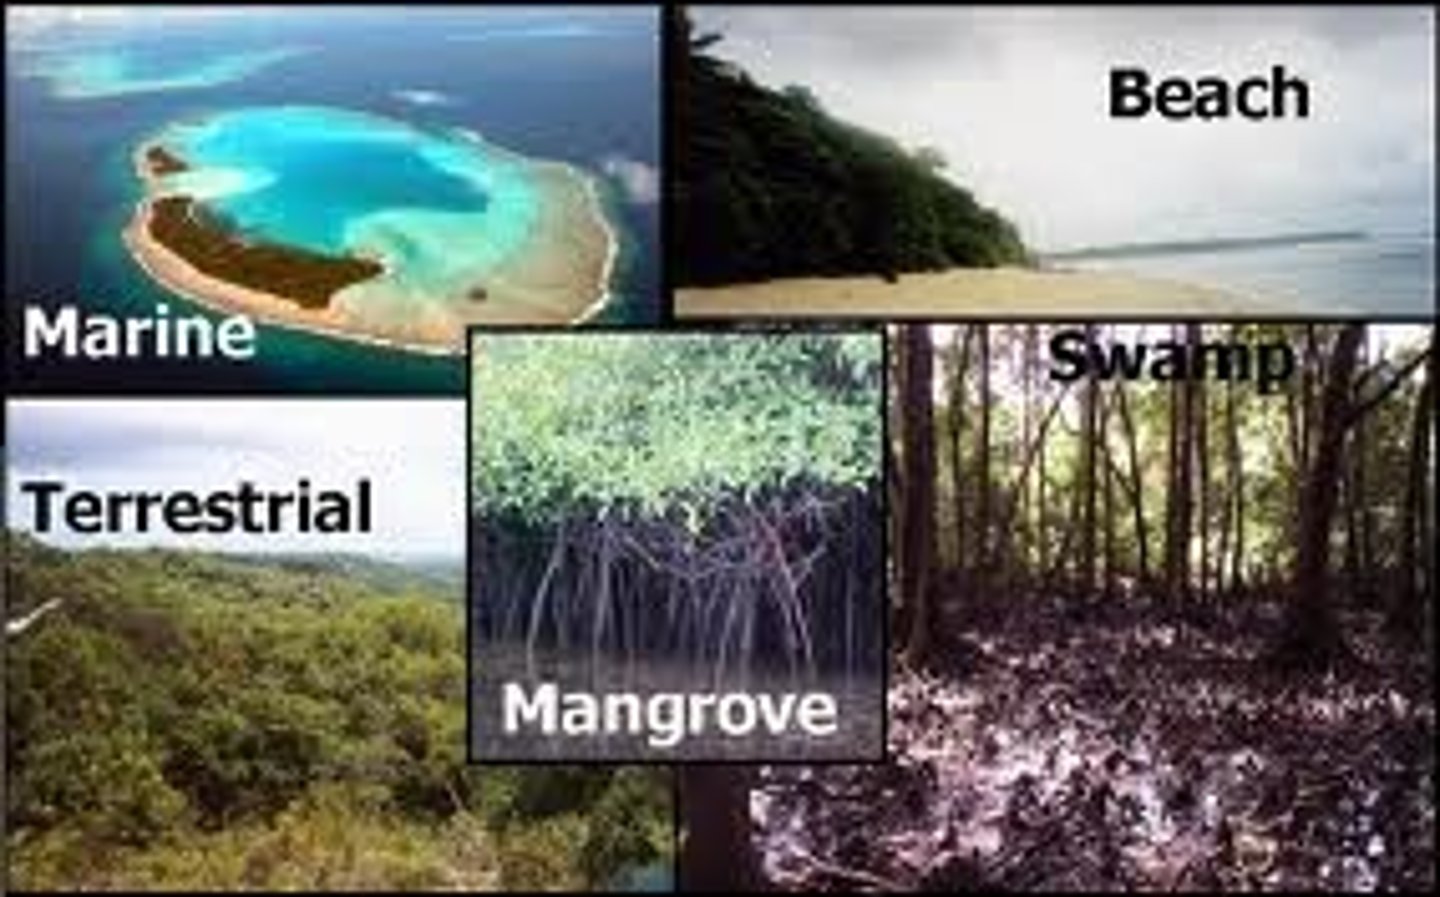
Ecosystem Diversity
Refers to the variety of habitats, communities, and ecological processes in the biosphere.
Species DIversity
The number of different species in the biosphere, or in a particular area.
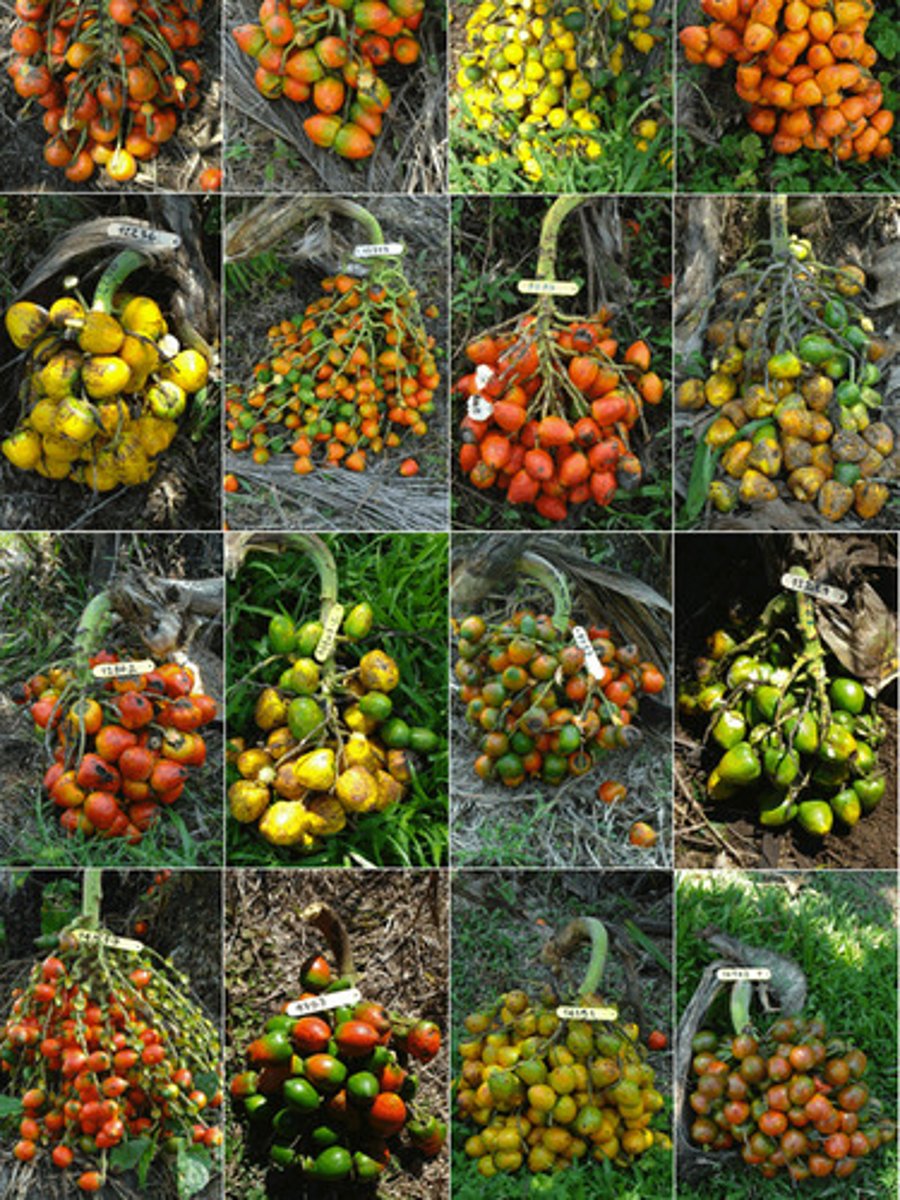
Genetic Diversity
Can refer to the sum total of all different forms of genetic information carried by a particular species, or by all organisms on Earth.
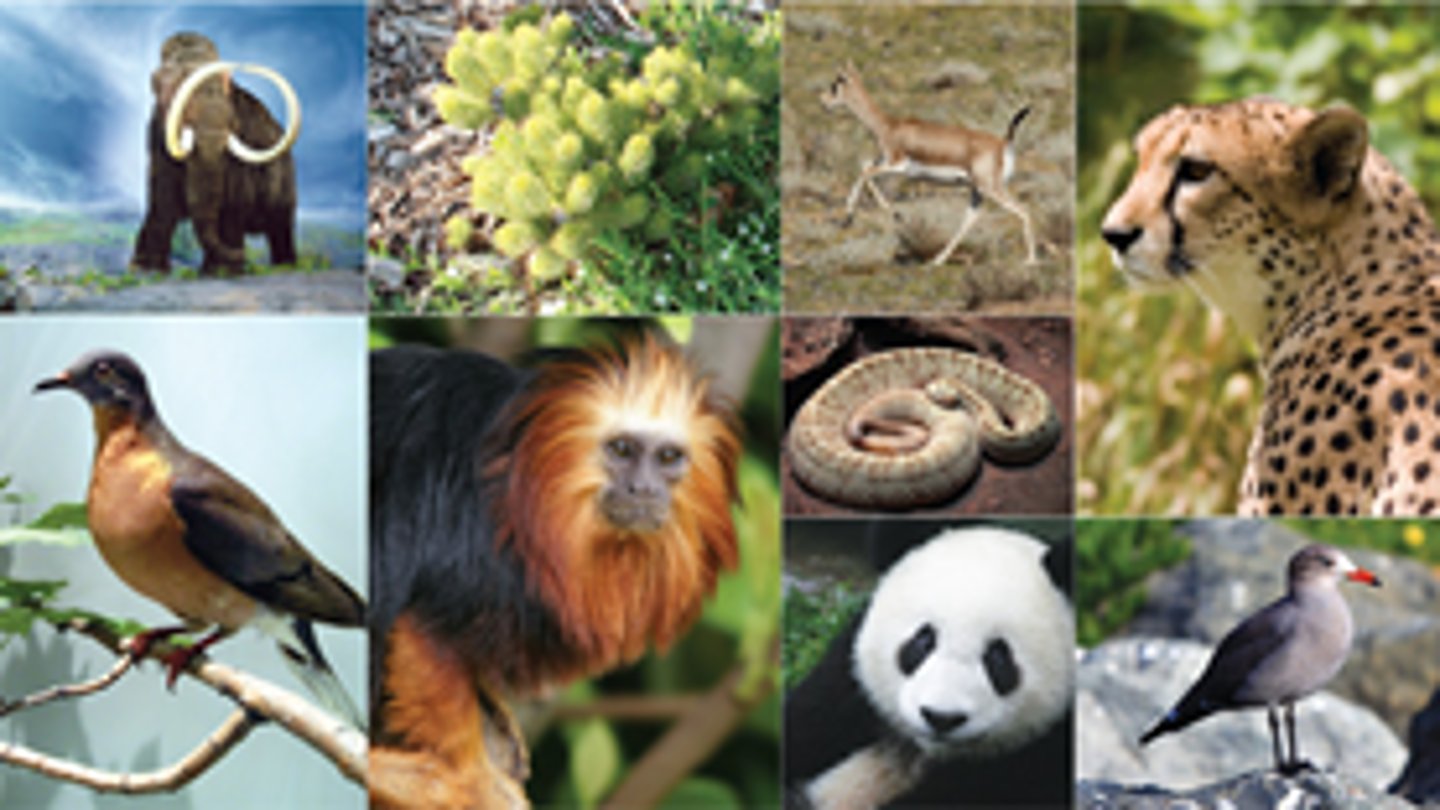
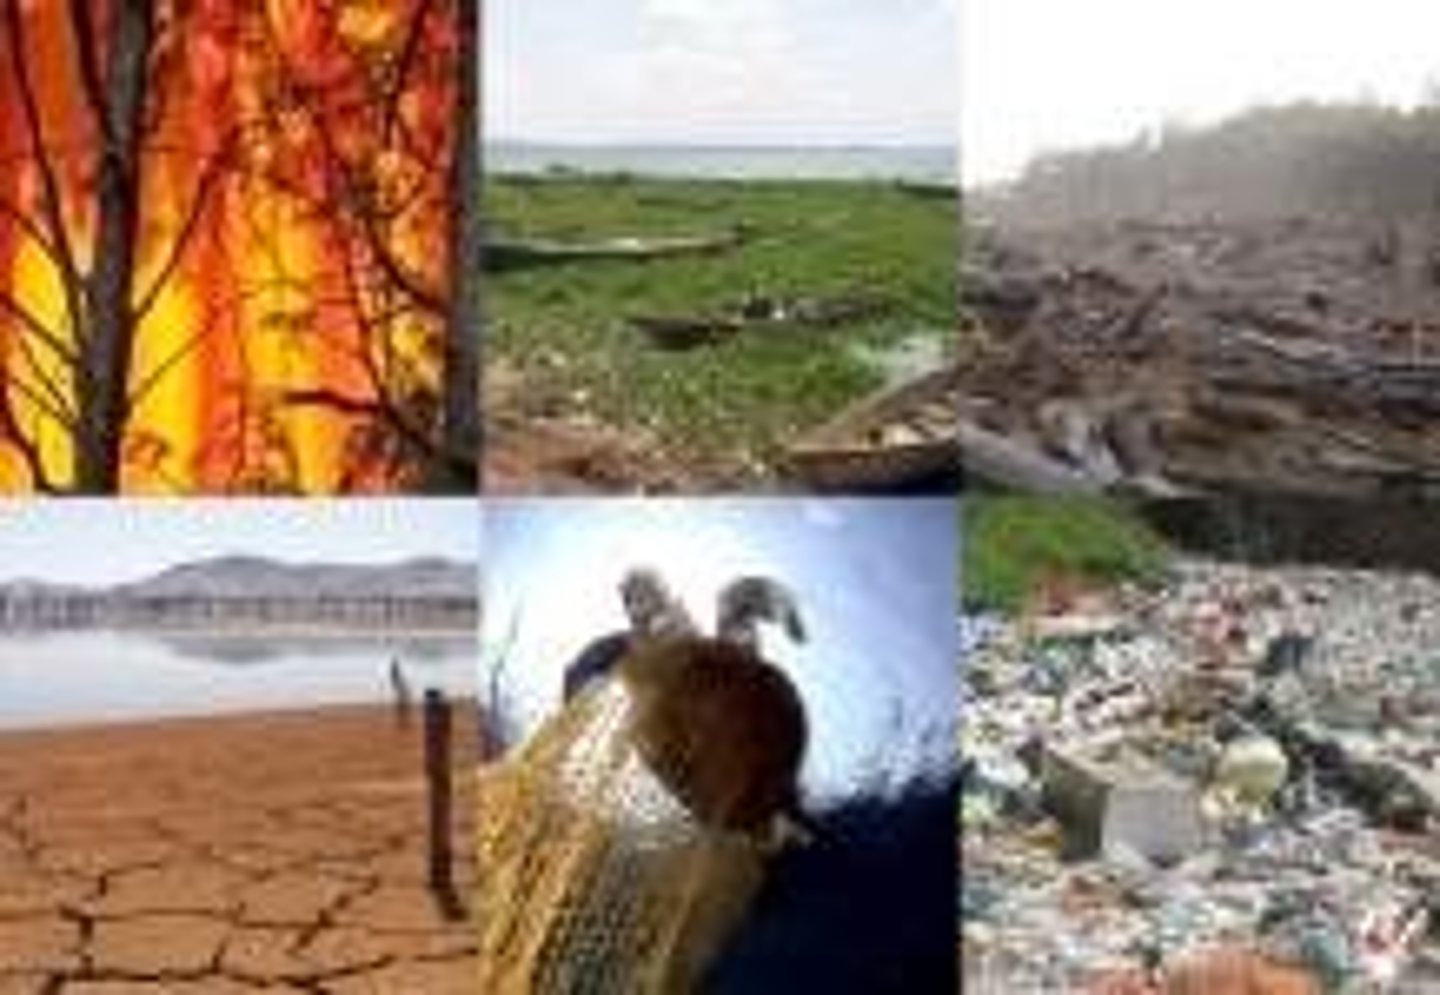
Threats to Biodiversity
Includes altering habitats, hunting, introducing invasive species, releasing pollution into food webs, and contributing to climate change.
Altered Habitats
When natural habitats are eliminated for agriculture or for urban development, the number of species in those habitats drops, and some species may become extinct.
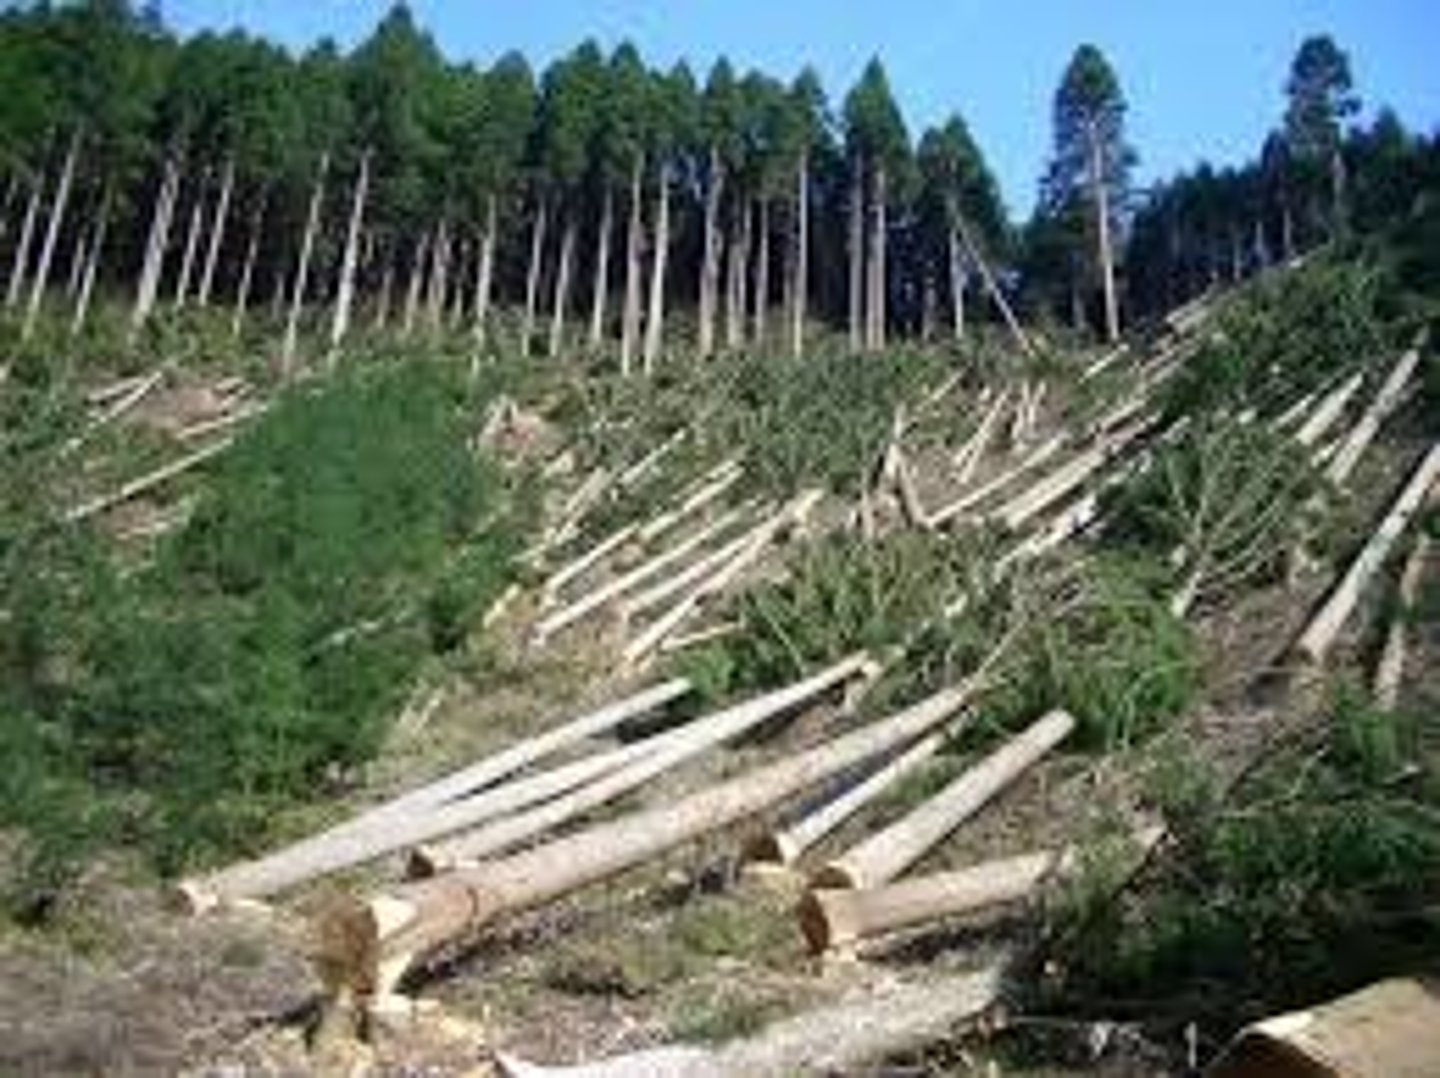
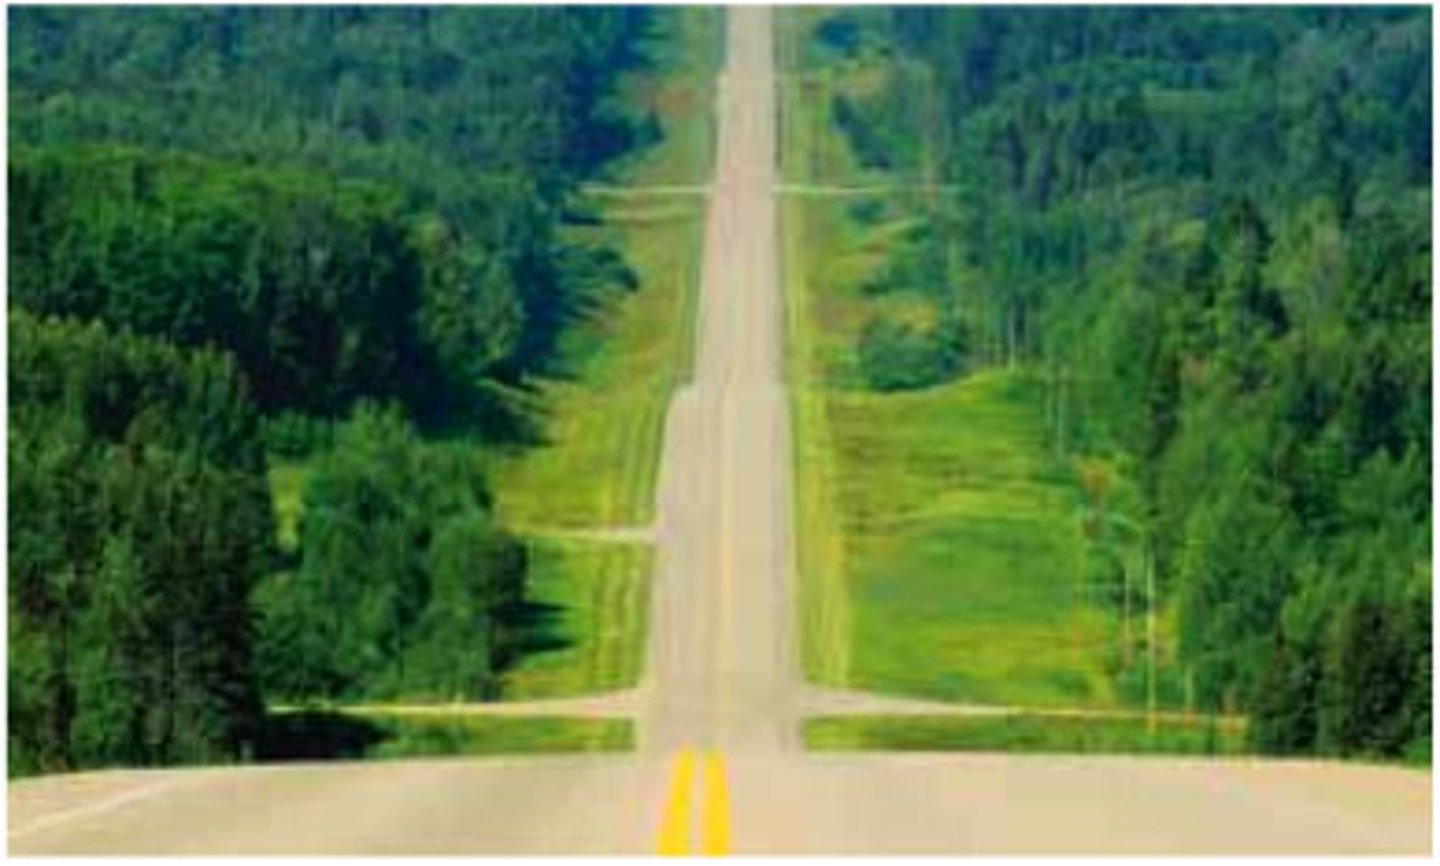
Habitat Fragmentation
A process that splits ecosystems into fragments. For example - deforestation in Florida leading to islands; putting a road through a forest.
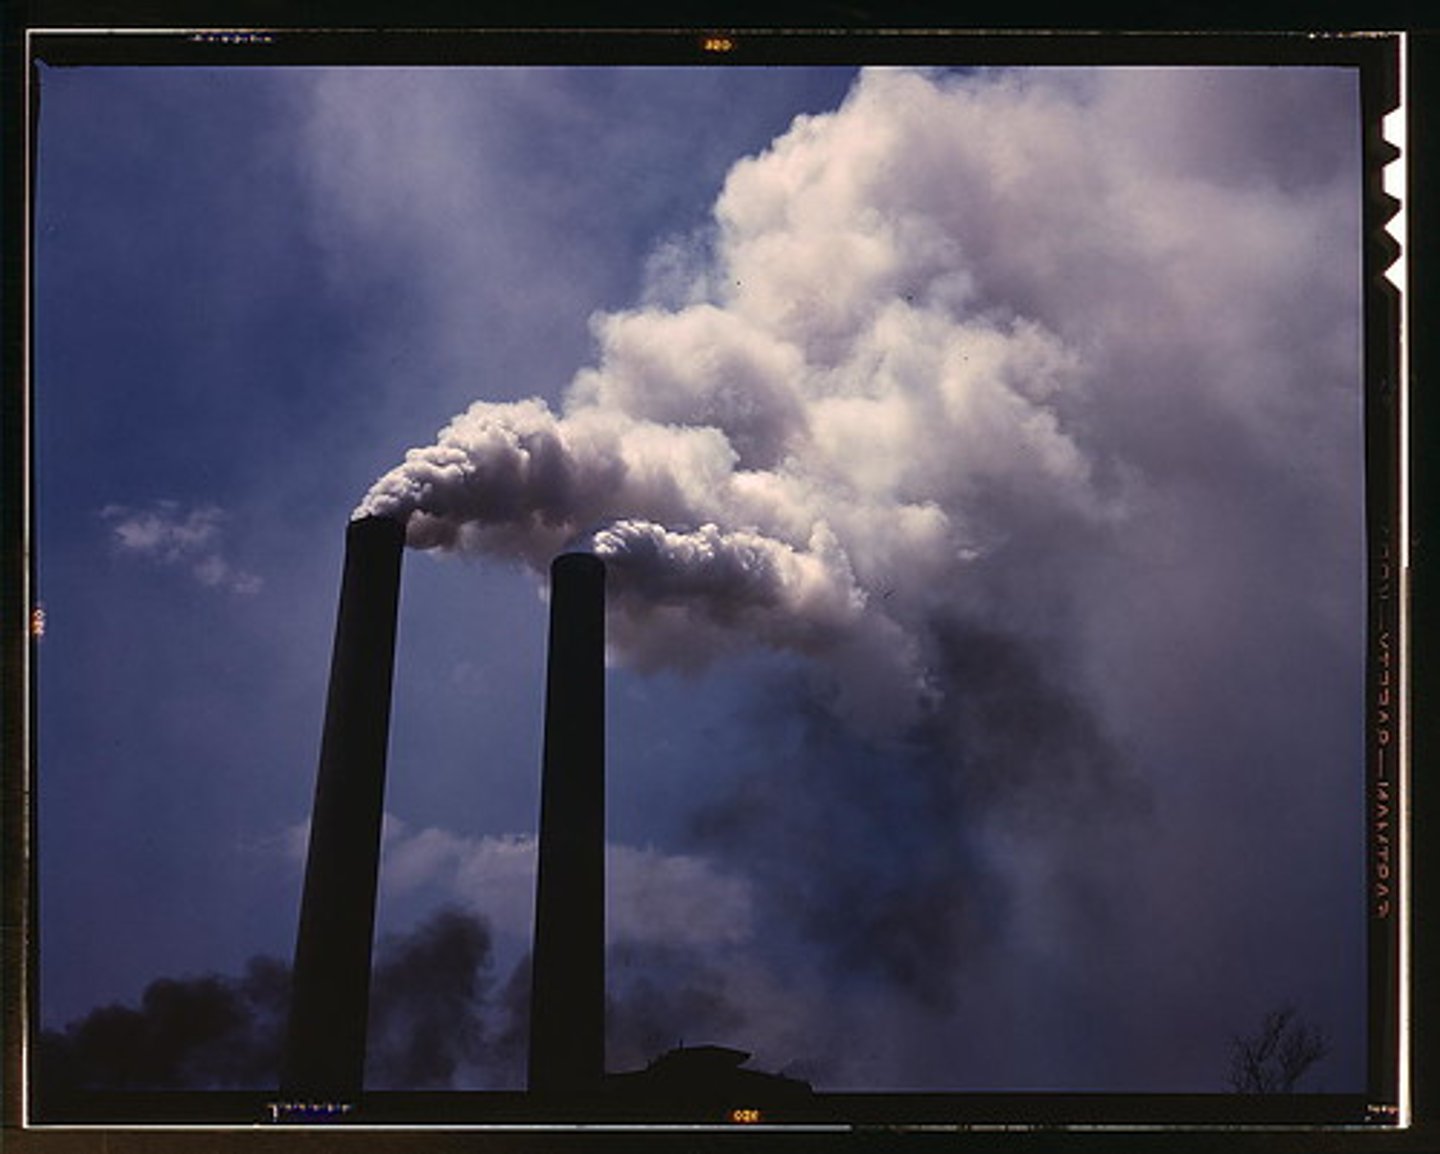
Pollution
DDT, for example, prevents birds from laying healthy eggs.
Acid rain places stress on land and water organisms.
Increased carbon dioxide in the atmosphere is dissolving in oceans, making them more acidic, which threatens biodiversity in marine ecosystems.
Biological Accumilation
A process in which concentrations of harmful substances like DDT or other pollutants INCREASE in organisms over time.
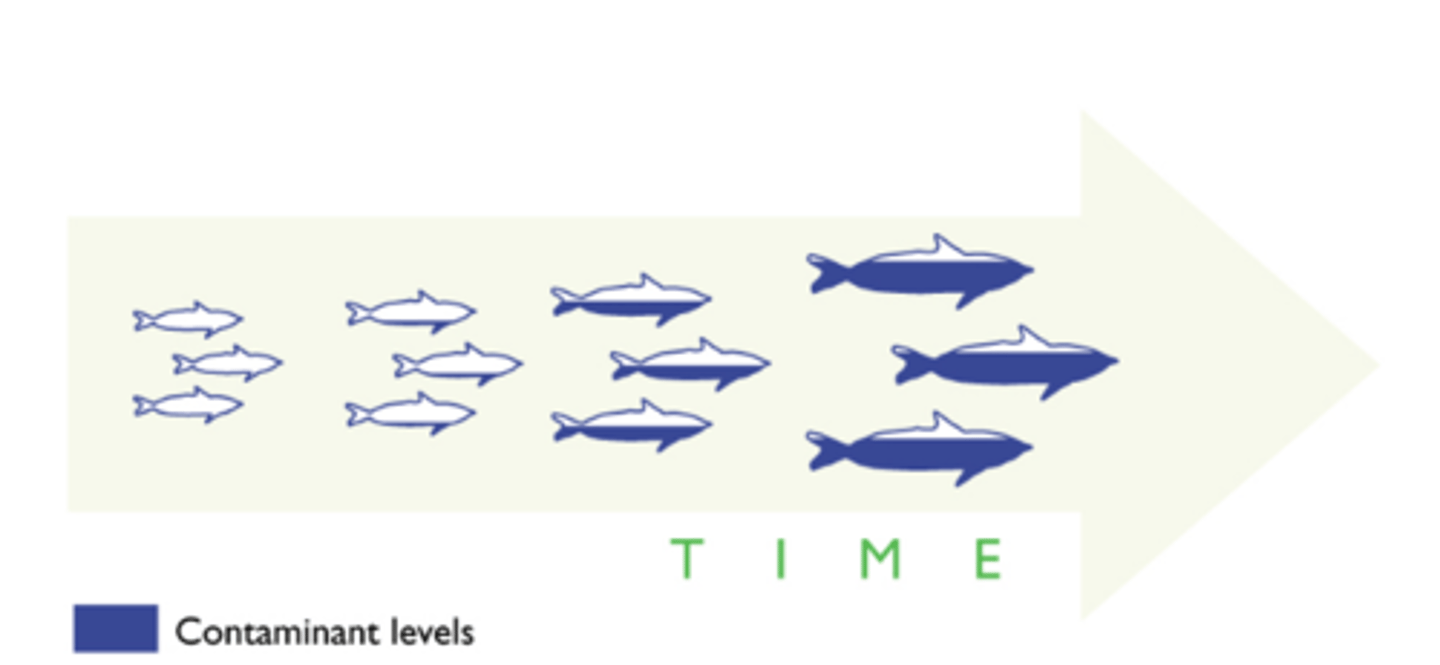
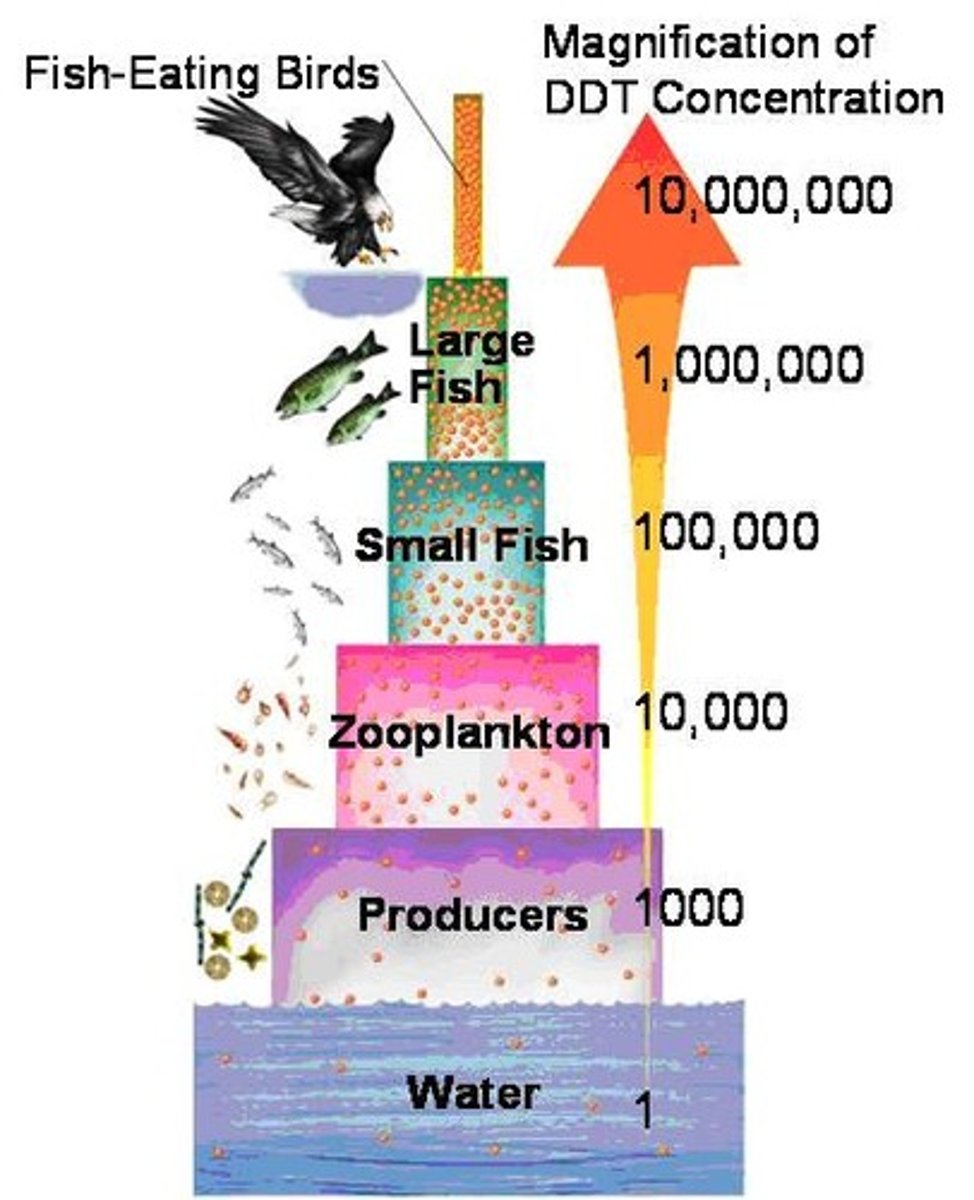
Biological Magnification
A process in which concentrations of harmful substances increase in organisms at higher trophic levels in a food chain or food web. Affects the entire food web, although the top-level carnivores are at the highest risk.
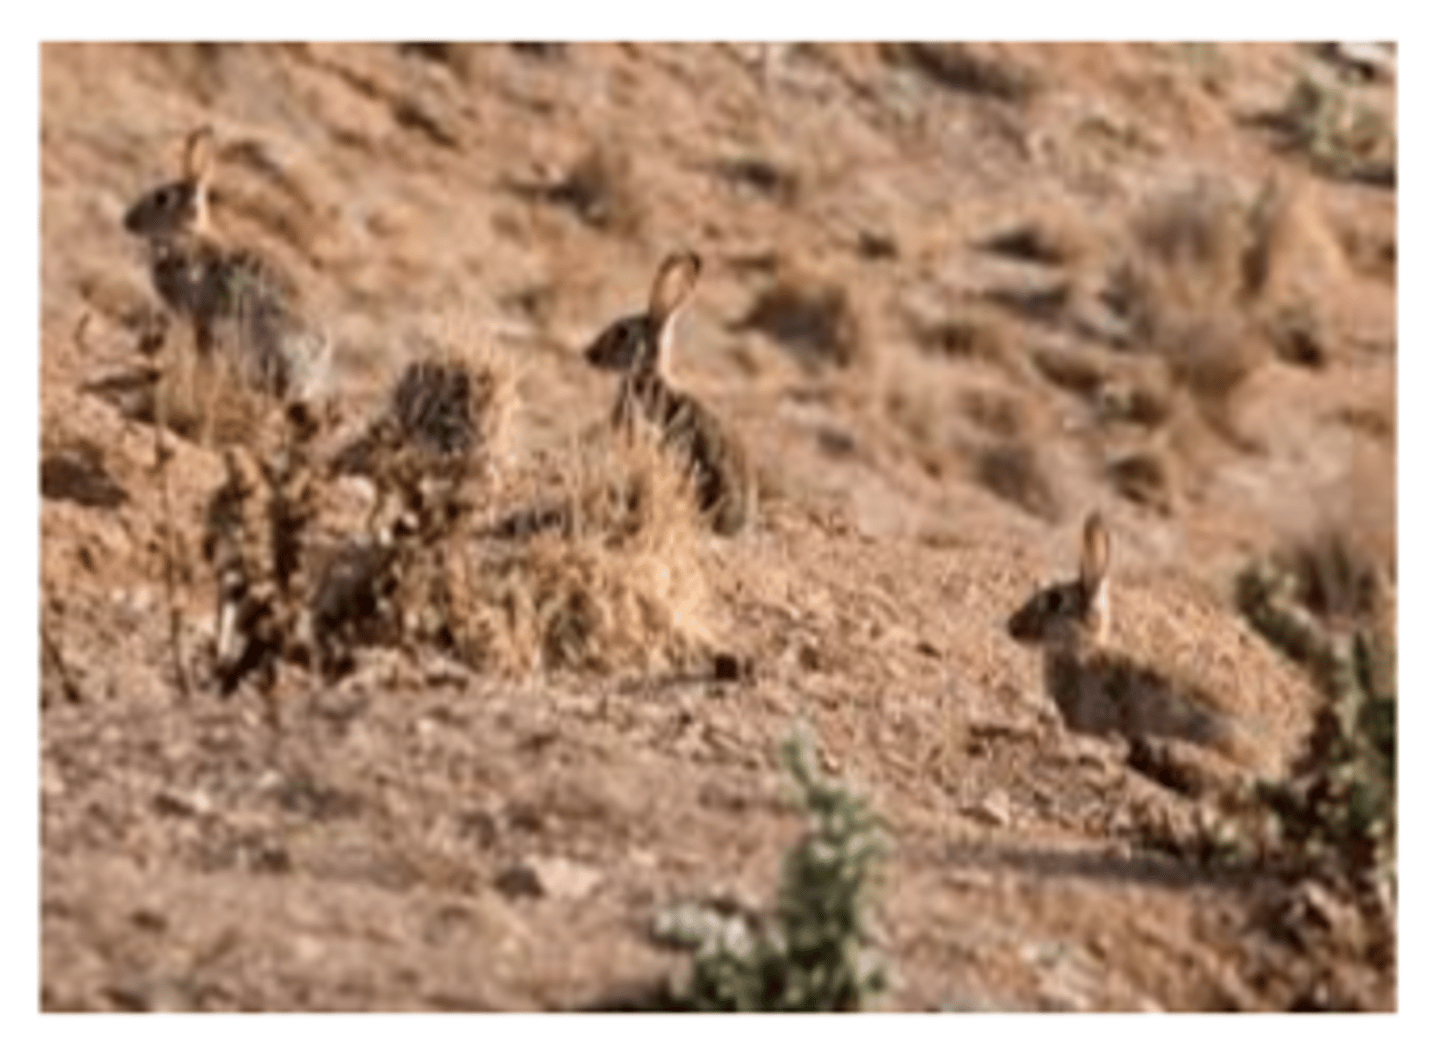
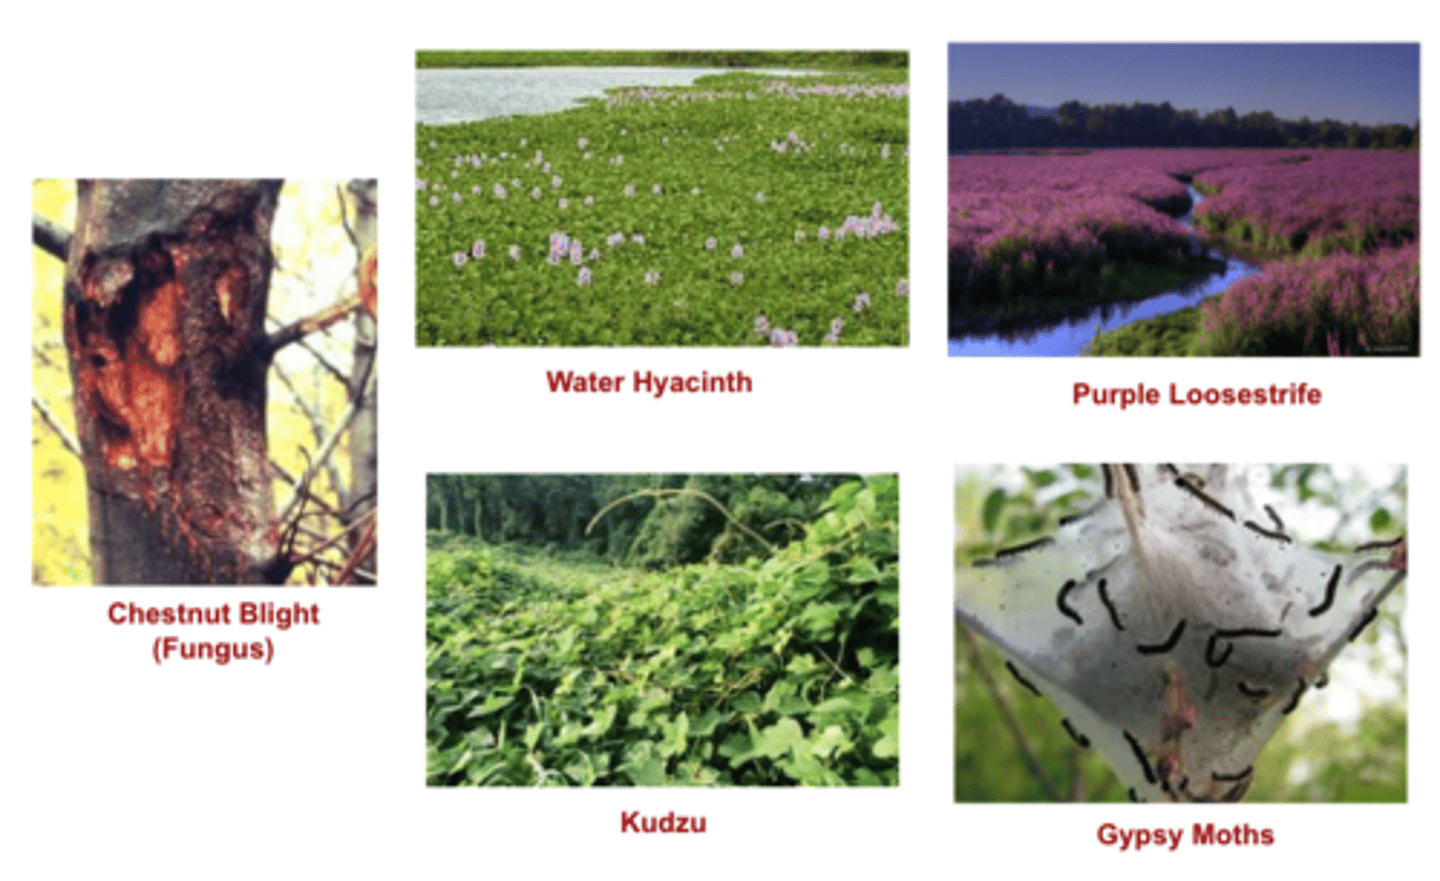
Introduced Species
Species reproduce rapidly because their new habitat lacks the parasites and predators that control their population "back home". (Australian Rabbit, Hyrdrilla, Kudzu vine, etc)
Conservation
Efforts to protect individual species, preserve habitats and ecosystems, and make certain that human neighbors of protected areas benefit from participating in conservation efforts.
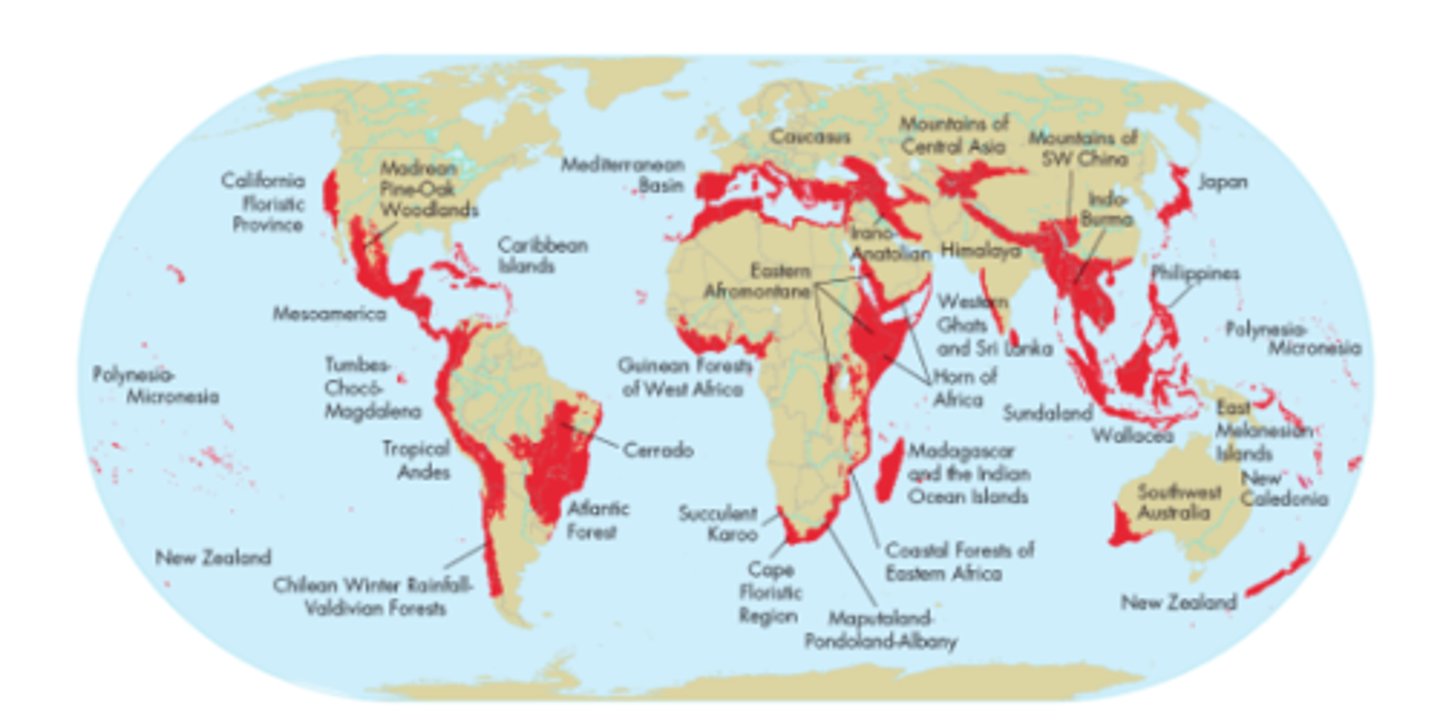
Ecological Hot Spot
A place where significant numbers of species and habitats are in immediate danger of extinction.